Air Pollution in Bharuch: Real-time Air Quality Index and smog alert.
Pollution and air quality forecast for Bharuch. Today is Wednesday, May 13, 2026. The following air pollution values have been recorded for Bharuch:- particulate matter (PM2.5) dust - 88 (Very Unhealthy)
- particulate matter (PM10) suspended dust - 159 (Very bad Hazardous)
- nitrogen dioxide (NO2) - 36 (Good)
- sulfur dioxide (SO2) - 82 (Moderate)
- carbon monoxide (CO) - 1250 (Good)
- ozone (O3) - 32 (Good)

What is the air quality in Bharuch today? Is the air polluted in Bharuch?. Is there smog?
What is the current level of PM2.5 in Bharuch? (particulate matter (PM2.5) dust)
Today's PM2.5 level is:
88 (Very Unhealthy)
For comparison, the highest level of PM2.5 in Bharuch in the last 7 days was: 88 (Monday, October 31, 2022) and the lowest: 88 (Monday, October 31, 2022).
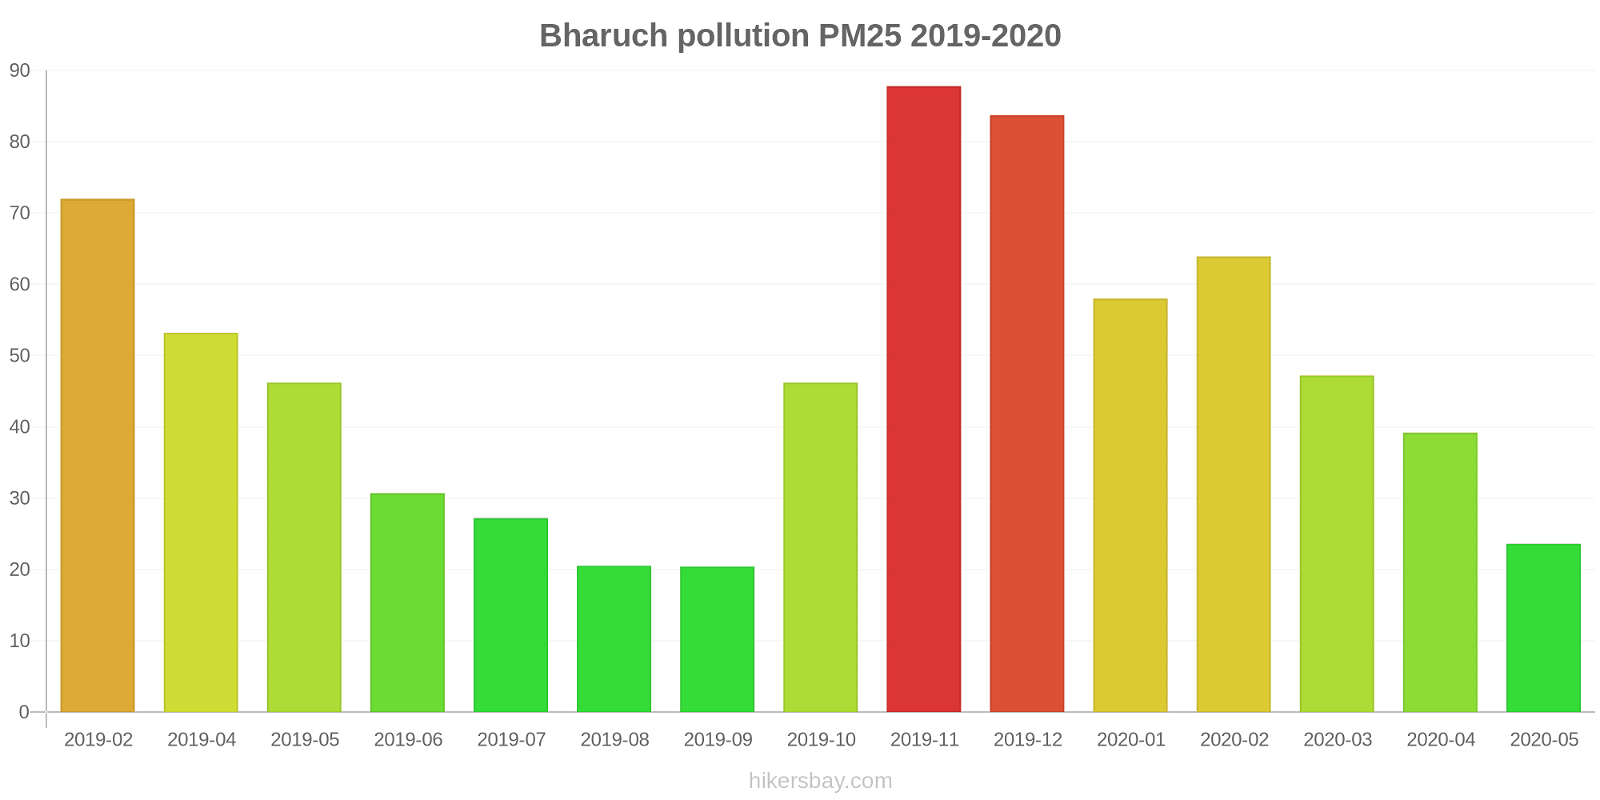
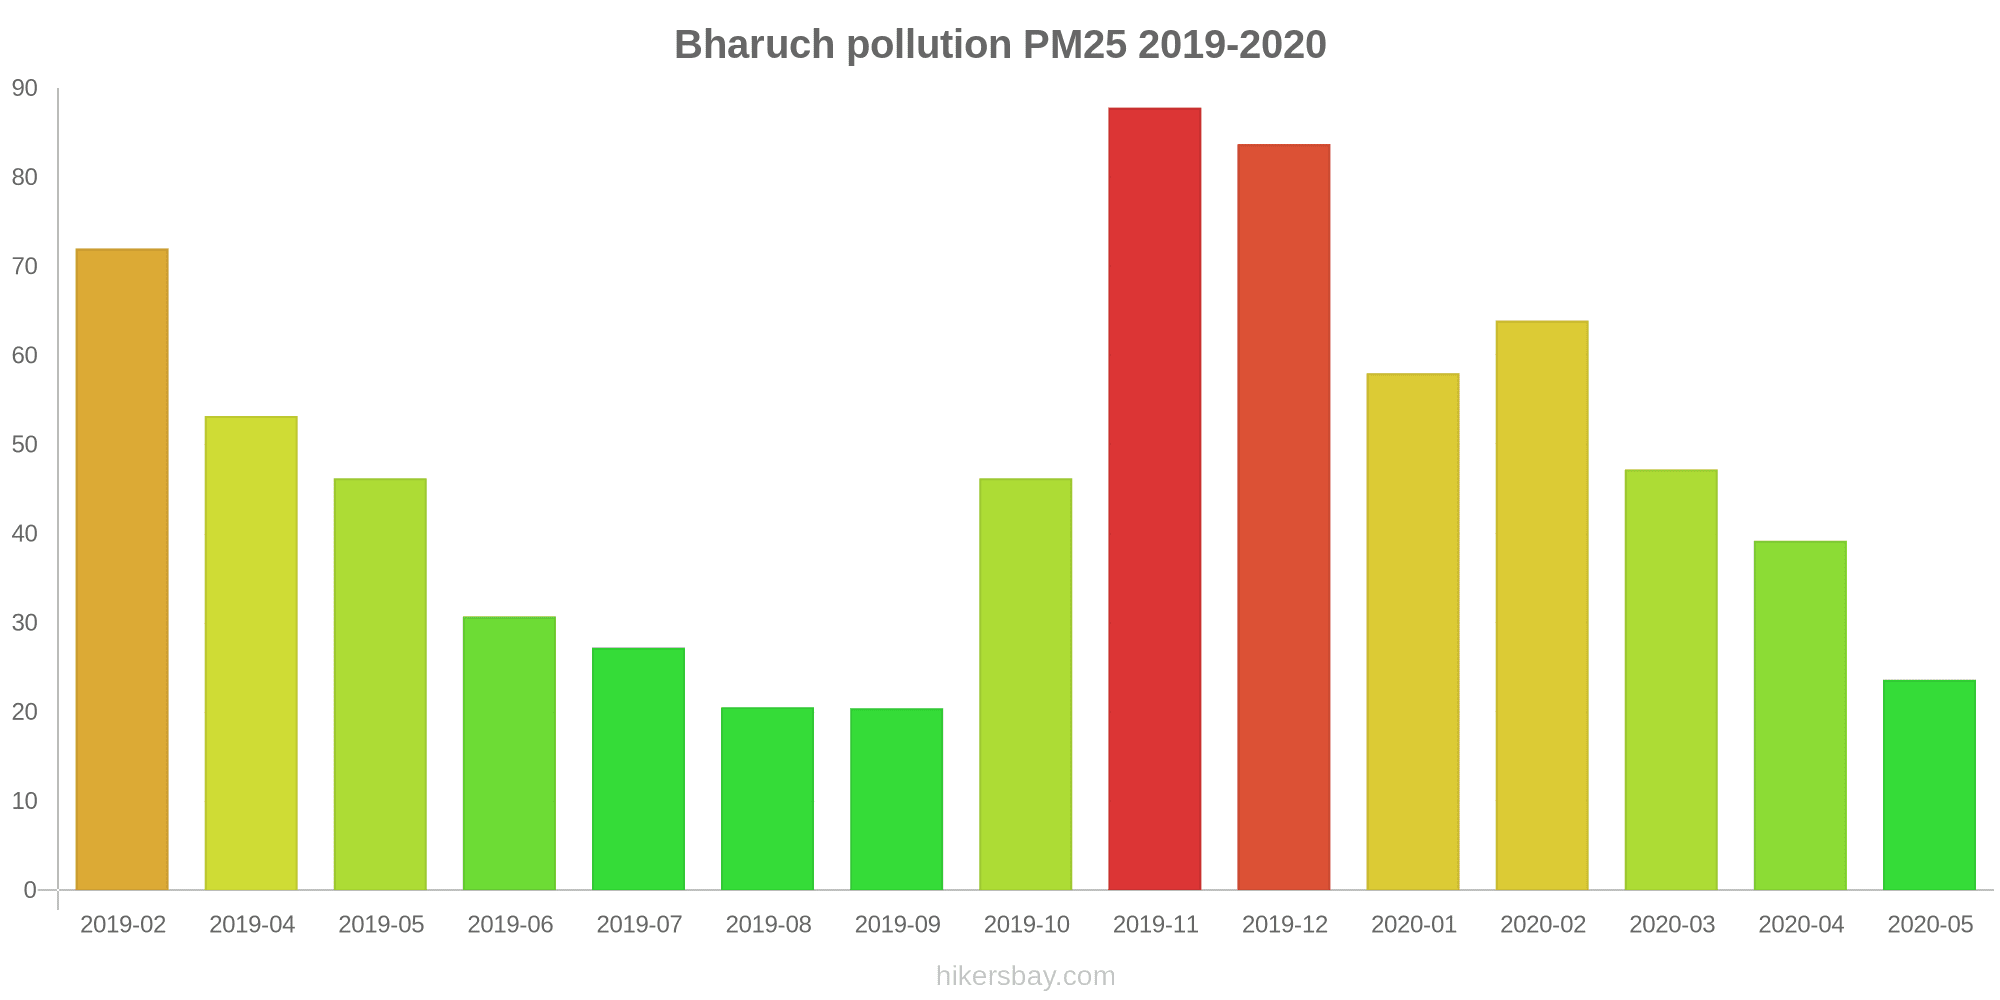
The highest PM2.5 values were recorded: 88 (November 2019).
The lowest level of particulate matter PM2.5 pollution occurs in month: September (20).
What is the level of PM10 today in Bharuch? (particulate matter (PM10) suspended dust)
The current level of particulate matter PM10 in Bharuch is:
159 (Very bad Hazardous)
The highest PM10 values usually occur in month: 157 (November 2019).
The lowest value of particulate matter PM10 pollution in Bharuch is usually recorded in: September (52).
How high is the level of NO2? (nitrogen dioxide (NO2))
36 (Good)
What is the level of SO2 pollution? (sulfur dioxide (SO2))
82 (Moderate)
How high is the CO level? (carbon monoxide (CO))
1250 (Good)
How is the O3 level today in Bharuch? (ozone (O3))
32 (Good)
Current data Monday, October 31, 2022, 1:45 AM
PM2,5 88 (Very Unhealthy)
PM10 159 (Very bad Hazardous)
NO2 36 (Good)
SO2 82 (Moderate)
CO 1250 (Good)
O3 32 (Good)
Data on air pollution from recent days in Bharuch
index
2022-10-31
pm25
88
Very Unhealthy
pm10
159
Very bad Hazardous
no2
36
Good
so2
82
Moderate
co
1250
Good
o3
32
Good
data source »
Air pollution in Bharuch from February 2019 to May 2020
index
2020-05
2020-04
2020-03
2020-02
2020-01
2019-12
2019-11
2019-10
2019-09
2019-08
2019-07
2019-06
2019-05
2019-04
2019-02
pm25
24 (Moderate)
39 (Unhealthy for Sensitive Groups)
47 (Unhealthy for Sensitive Groups)
64 (Unhealthy)
58 (Unhealthy)
84 (Very Unhealthy)
88 (Very Unhealthy)
46 (Unhealthy for Sensitive Groups)
20 (Moderate)
21 (Moderate)
27 (Moderate)
31 (Moderate)
46 (Unhealthy for Sensitive Groups)
53 (Unhealthy for Sensitive Groups)
72 (Unhealthy)
pm10
69 (Unhealthy for Sensitive Groups)
90 (Unhealthy)
98 (Unhealthy)
123 (Very Unhealthy)
106 (Unhealthy)
142 (Very Unhealthy)
157 (Very bad Hazardous)
111 (Very Unhealthy)
52 (Unhealthy for Sensitive Groups)
55 (Unhealthy for Sensitive Groups)
61 (Unhealthy for Sensitive Groups)
73 (Unhealthy for Sensitive Groups)
123 (Very Unhealthy)
140 (Very Unhealthy)
136 (Very Unhealthy)
no2
3.1 (Good)
5.4 (Good)
8.4 (Good)
15 (Good)
16 (Good)
27 (Good)
6.8 (Good)
11 (Good)
24 (Good)
35 (Good)
4.8 (Good)
3.5 (Good)
14 (Good)
27 (Good)
25 (Good)
so2
5.6 (Good)
8.7 (Good)
31 (Good)
84 (Moderate)
54 (Moderate)
81 (Moderate)
71 (Moderate)
34 (Good)
21 (Good)
17 (Good)
16 (Good)
23 (Good)
20 (Good)
24 (Good)
26 (Good)
co
794 (Good)
814 (Good)
953 (Good)
1 (Good)
892 (Good)
1 (Good)
1 (Good)
1 (Good)
1 (Good)
1 (Good)
1 (Good)
1 (Good)
348 (Good)
533 (Good)
870 (Good)
o3
37 (Good)
43 (Good)
41 (Good)
40 (Good)
31 (Good)
32 (Good)
26 (Good)
21 (Good)
8.2 (Good)
15 (Good)
18 (Good)
24 (Good)
12 (Good)
16 (Good)
10 (Good)
data source »
Quality of life in Bharuch
Green and Parks in the City
Bharuch
36%
Nepal: 32%
Bangladesh: 33%
Bhutan: 82%
Sri Lanka: 59%
Pakistan: 49%
particulate matter PM2.5
Bharuch
53 (Unhealthy for Sensitive Groups)
Pleasure of spending time in the city
Bharuch
31%
Nepal: 32%
Bangladesh: 26%
Bhutan: 61%
Sri Lanka: 52%
Pakistan: 43%
particulate matter PM10
Bharuch
100 (Unhealthy)
Air Pollution
Bharuch
70%
Nepal: 76%
Bangladesh: 78%
Bhutan: 45%
Sri Lanka: 53%
Pakistan: 64%
Garbage Disposal
Bharuch
20%
Nepal: 25%
Bangladesh: 22%
Bhutan: 47%
Sri Lanka: 41%
Pakistan: 34%
Availability and quality of drinking water
Bharuch
31%
Nepal: 36%
Bangladesh: 44%
Bhutan: 64%
Sri Lanka: 65%
Pakistan: 44%
Cleanliness and tidiness
Bharuch
21%
Nepal: 27%
Bangladesh: 23%
Bhutan: 57%
Sri Lanka: 52%
Pakistan: 40%
Noise and Light pollution
Bharuch
42%
Nepal: 55%
Bangladesh: 63%
Bhutan: 55%
Sri Lanka: 50%
Pakistan: 59%
Water Pollution
Bharuch
70%
Nepal: 76%
Bangladesh: 74%
Bhutan: 56%
Sri Lanka: 57%
Pakistan: 70%
Source: Numbeo
GIDC, Ankleshwar - GPCB
Monday, October 31, 2022, 1:45 AM
PM2,5 88 (Very Unhealthy)
particulate matter (PM2.5) dust
PM10 159 (Very bad Hazardous)
particulate matter (PM10) suspended dust
NO2 36 (Good)
nitrogen dioxide (NO2)
SO2 82 (Moderate)
sulfur dioxide (SO2)
CO 1250 (Good)
carbon monoxide (CO)
O3 32 (Good)
ozone (O3)
GIDC, Ankleshwar - GPCB
index
2022-10-31
pm25
88
pm10
159
no2
36
so2
82
co
1250
o3
32
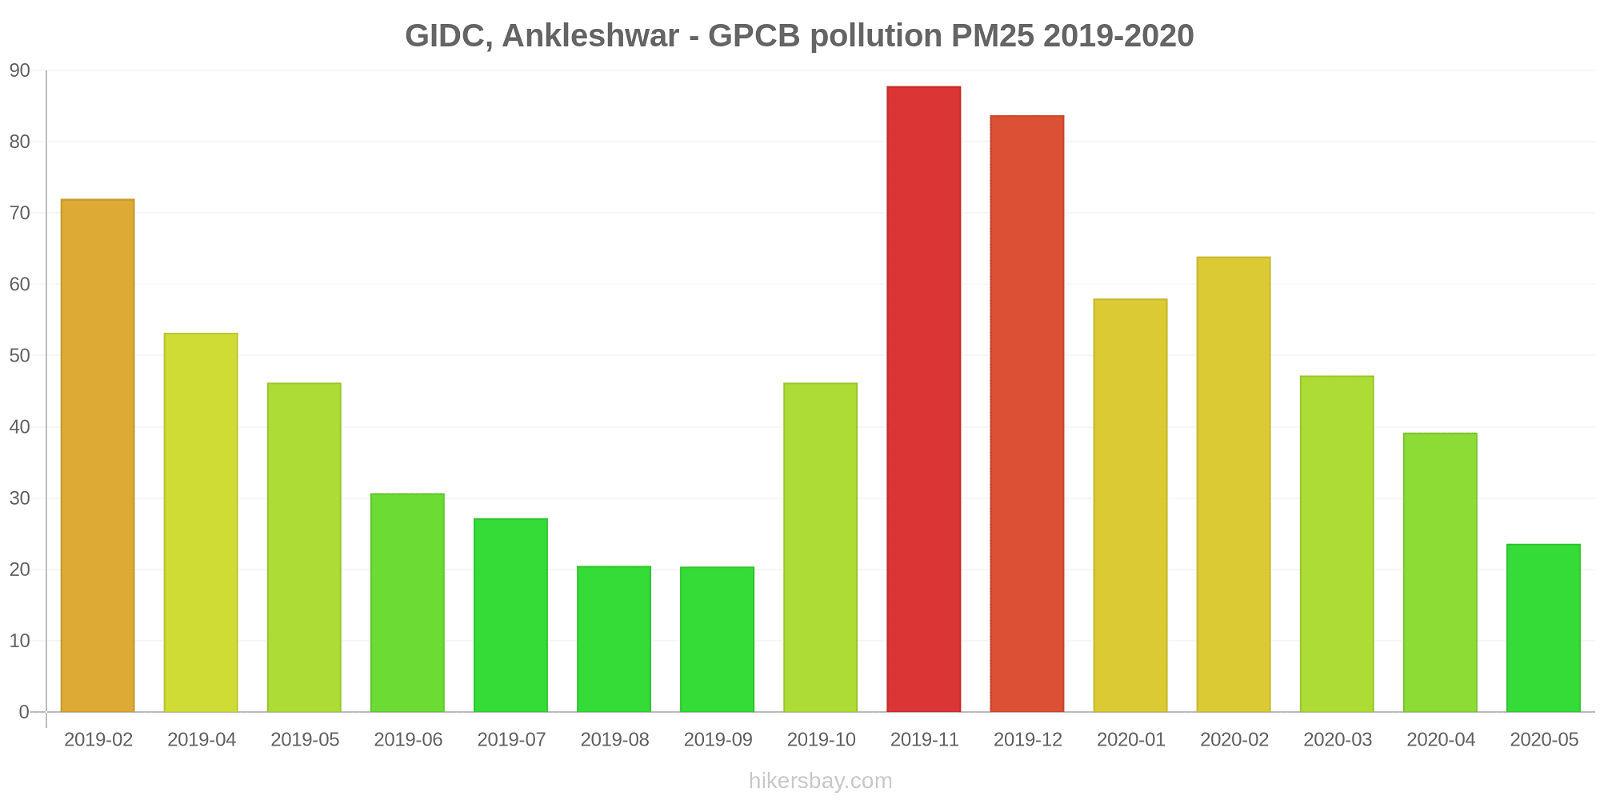
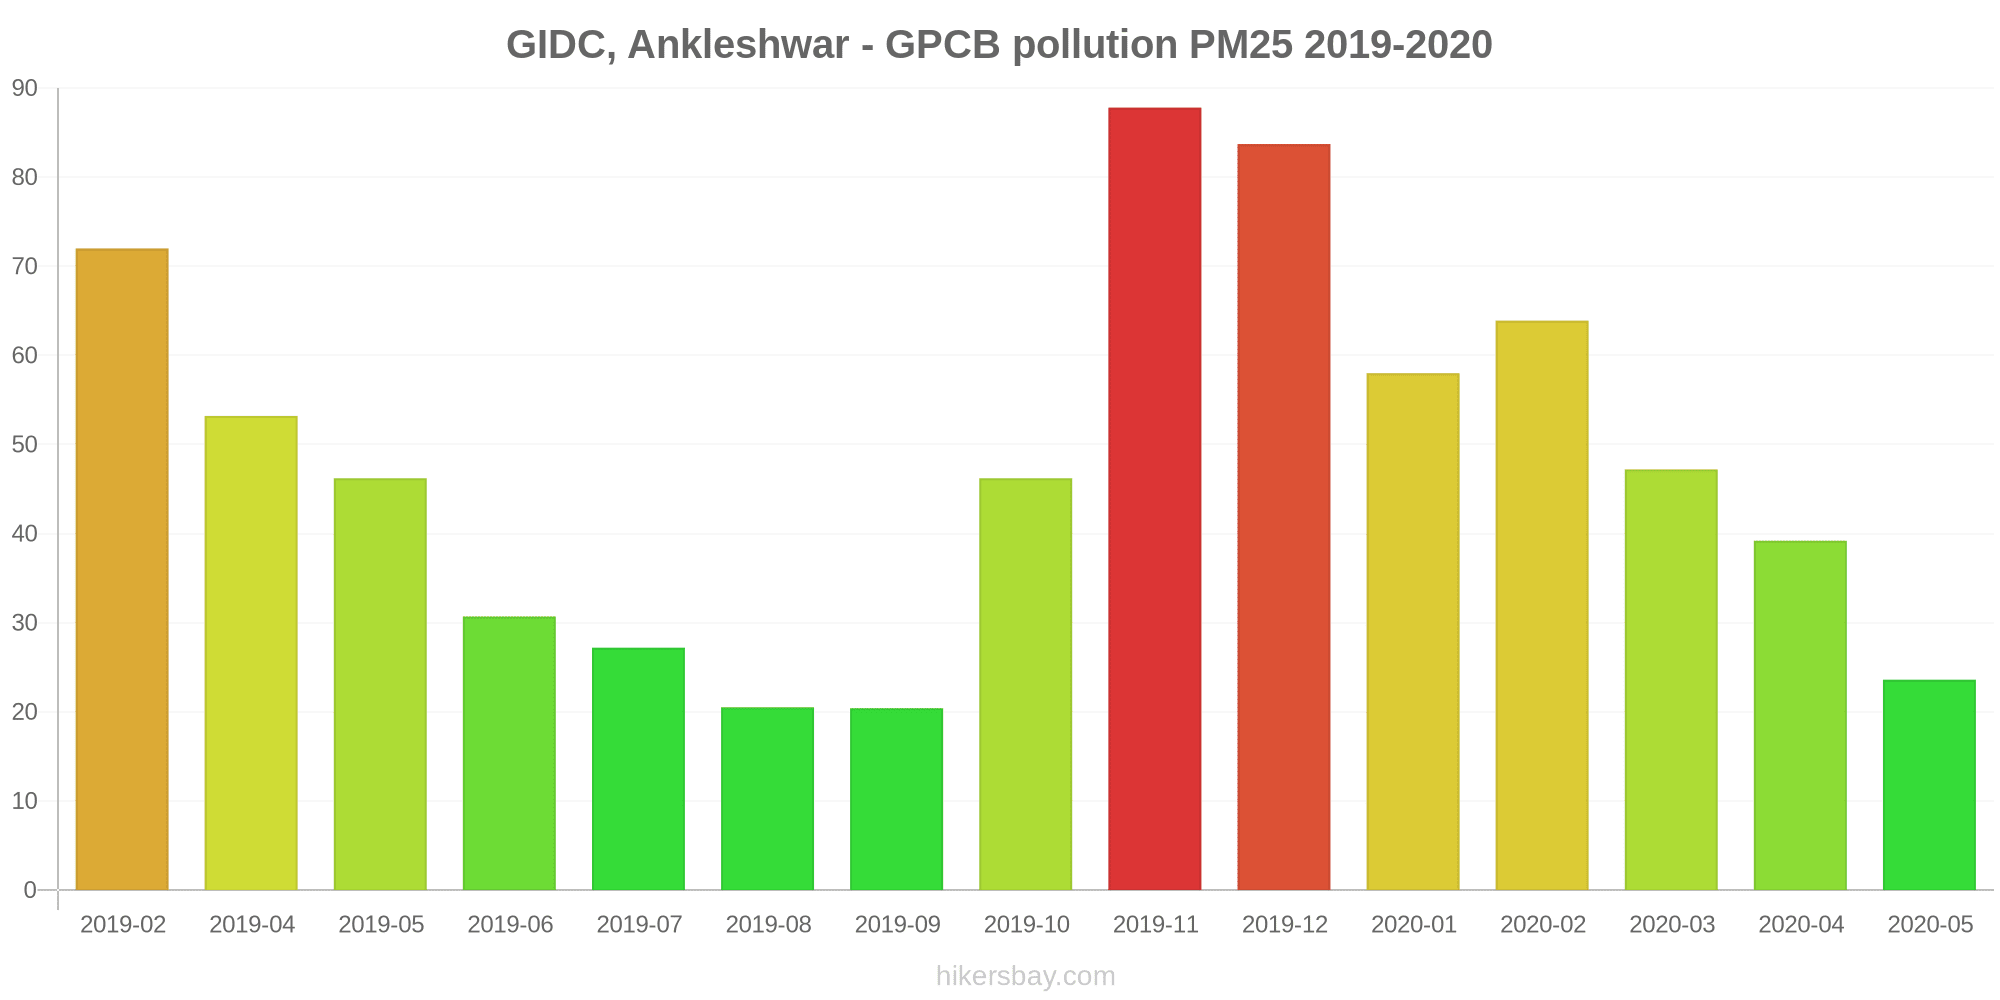
GIDC, Ankleshwar - GPCB
2019-02 2020-05
index
2020-05
2020-04
2020-03
2020-02
2020-01
2019-12
2019-11
2019-10
2019-09
2019-08
2019-07
2019-06
2019-05
2019-04
2019-02
pm25
24
39
47
64
58
84
88
46
20
21
27
31
46
53
72
pm10
69
90
98
123
106
142
157
111
52
55
61
73
123
140
136
no2
3.1
5.4
8.4
15
16
27
6.8
11
24
35
4.8
3.5
14
27
25
so2
5.6
8.7
31
84
54
81
71
34
21
17
16
23
20
24
26
co
794
814
953
1
892
1
1
1
1
1
1
1
348
533
870
o3
37
43
41
40
31
32
26
21
8.2
15
18
24
12
16
10
* Pollution data source:
https://openaq.org
(caaqm)
The data is licensed under CC-By 4.0
PM2,5 88 (Very Unhealthy)
PM10 159 (Very bad Hazardous)
NO2 36 (Good)
SO2 82 (Moderate)
CO 1250 (Good)
O3 32 (Good)
Data on air pollution from recent days in Bharuch
| index | 2022-10-31 |
|---|---|
| pm25 | 88 Very Unhealthy |
| pm10 | 159 Very bad Hazardous |
| no2 | 36 Good |
| so2 | 82 Moderate |
| co | 1250 Good |
| o3 | 32 Good |
| index | 2020-05 | 2020-04 | 2020-03 | 2020-02 | 2020-01 | 2019-12 | 2019-11 | 2019-10 | 2019-09 | 2019-08 | 2019-07 | 2019-06 | 2019-05 | 2019-04 | 2019-02 |
|---|---|---|---|---|---|---|---|---|---|---|---|---|---|---|---|
| pm25 | 24 (Moderate) | 39 (Unhealthy for Sensitive Groups) | 47 (Unhealthy for Sensitive Groups) | 64 (Unhealthy) | 58 (Unhealthy) | 84 (Very Unhealthy) | 88 (Very Unhealthy) | 46 (Unhealthy for Sensitive Groups) | 20 (Moderate) | 21 (Moderate) | 27 (Moderate) | 31 (Moderate) | 46 (Unhealthy for Sensitive Groups) | 53 (Unhealthy for Sensitive Groups) | 72 (Unhealthy) |
| pm10 | 69 (Unhealthy for Sensitive Groups) | 90 (Unhealthy) | 98 (Unhealthy) | 123 (Very Unhealthy) | 106 (Unhealthy) | 142 (Very Unhealthy) | 157 (Very bad Hazardous) | 111 (Very Unhealthy) | 52 (Unhealthy for Sensitive Groups) | 55 (Unhealthy for Sensitive Groups) | 61 (Unhealthy for Sensitive Groups) | 73 (Unhealthy for Sensitive Groups) | 123 (Very Unhealthy) | 140 (Very Unhealthy) | 136 (Very Unhealthy) |
| no2 | 3.1 (Good) | 5.4 (Good) | 8.4 (Good) | 15 (Good) | 16 (Good) | 27 (Good) | 6.8 (Good) | 11 (Good) | 24 (Good) | 35 (Good) | 4.8 (Good) | 3.5 (Good) | 14 (Good) | 27 (Good) | 25 (Good) |
| so2 | 5.6 (Good) | 8.7 (Good) | 31 (Good) | 84 (Moderate) | 54 (Moderate) | 81 (Moderate) | 71 (Moderate) | 34 (Good) | 21 (Good) | 17 (Good) | 16 (Good) | 23 (Good) | 20 (Good) | 24 (Good) | 26 (Good) |
| co | 794 (Good) | 814 (Good) | 953 (Good) | 1 (Good) | 892 (Good) | 1 (Good) | 1 (Good) | 1 (Good) | 1 (Good) | 1 (Good) | 1 (Good) | 1 (Good) | 348 (Good) | 533 (Good) | 870 (Good) |
| o3 | 37 (Good) | 43 (Good) | 41 (Good) | 40 (Good) | 31 (Good) | 32 (Good) | 26 (Good) | 21 (Good) | 8.2 (Good) | 15 (Good) | 18 (Good) | 24 (Good) | 12 (Good) | 16 (Good) | 10 (Good) |
Green and Parks in the City
Bharuch 36%
Nepal: 32% Bangladesh: 33% Bhutan: 82% Sri Lanka: 59% Pakistan: 49%particulate matter PM2.5
Bharuch 53 (Unhealthy for Sensitive Groups)
Pleasure of spending time in the city
Bharuch 31%
Nepal: 32% Bangladesh: 26% Bhutan: 61% Sri Lanka: 52% Pakistan: 43%particulate matter PM10
Bharuch 100 (Unhealthy)
Air Pollution
Bharuch 70%
Nepal: 76% Bangladesh: 78% Bhutan: 45% Sri Lanka: 53% Pakistan: 64%Garbage Disposal
Bharuch 20%
Nepal: 25% Bangladesh: 22% Bhutan: 47% Sri Lanka: 41% Pakistan: 34%Availability and quality of drinking water
Bharuch 31%
Nepal: 36% Bangladesh: 44% Bhutan: 64% Sri Lanka: 65% Pakistan: 44%Cleanliness and tidiness
Bharuch 21%
Nepal: 27% Bangladesh: 23% Bhutan: 57% Sri Lanka: 52% Pakistan: 40%Noise and Light pollution
Bharuch 42%
Nepal: 55% Bangladesh: 63% Bhutan: 55% Sri Lanka: 50% Pakistan: 59%Water Pollution
Bharuch 70%
Nepal: 76% Bangladesh: 74% Bhutan: 56% Sri Lanka: 57% Pakistan: 70%PM2,5 88 (Very Unhealthy)
particulate matter (PM2.5) dustPM10 159 (Very bad Hazardous)
particulate matter (PM10) suspended dustNO2 36 (Good)
nitrogen dioxide (NO2)SO2 82 (Moderate)
sulfur dioxide (SO2)CO 1250 (Good)
carbon monoxide (CO)O3 32 (Good)
ozone (O3)GIDC, Ankleshwar - GPCB
| index | 2022-10-31 |
|---|---|
| pm25 | 88 |
| pm10 | 159 |
| no2 | 36 |
| so2 | 82 |
| co | 1250 |
| o3 | 32 |
GIDC, Ankleshwar - GPCB
| index | 2020-05 | 2020-04 | 2020-03 | 2020-02 | 2020-01 | 2019-12 | 2019-11 | 2019-10 | 2019-09 | 2019-08 | 2019-07 | 2019-06 | 2019-05 | 2019-04 | 2019-02 |
|---|---|---|---|---|---|---|---|---|---|---|---|---|---|---|---|
| pm25 | 24 | 39 | 47 | 64 | 58 | 84 | 88 | 46 | 20 | 21 | 27 | 31 | 46 | 53 | 72 |
| pm10 | 69 | 90 | 98 | 123 | 106 | 142 | 157 | 111 | 52 | 55 | 61 | 73 | 123 | 140 | 136 |
| no2 | 3.1 | 5.4 | 8.4 | 15 | 16 | 27 | 6.8 | 11 | 24 | 35 | 4.8 | 3.5 | 14 | 27 | 25 |
| so2 | 5.6 | 8.7 | 31 | 84 | 54 | 81 | 71 | 34 | 21 | 17 | 16 | 23 | 20 | 24 | 26 |
| co | 794 | 814 | 953 | 1 | 892 | 1 | 1 | 1 | 1 | 1 | 1 | 1 | 348 | 533 | 870 |
| o3 | 37 | 43 | 41 | 40 | 31 | 32 | 26 | 21 | 8.2 | 15 | 18 | 24 | 12 | 16 | 10 |