Air Pollution in Bathinda: Real-time Air Quality Index and smog alert.
Pollution and air quality forecast for Bathinda. Today is Wednesday, May 13, 2026. The following air pollution values have been recorded for Bathinda:- carbon monoxide (CO) - 950 (Good)
- particulate matter (PM2.5) dust - 48 (Unhealthy for Sensitive Groups)
- particulate matter (PM10) suspended dust - 109 (Unhealthy)
- nitrogen dioxide (NO2) - 22 (Good)
- sulfur dioxide (SO2) - 34 (Good)

What is the air quality in Bathinda today? Is the air polluted in Bathinda?. Is there smog?
How high is the CO level? (carbon monoxide (CO))
950 (Good)
What is the current level of PM2.5 in Bathinda? (particulate matter (PM2.5) dust)
Today's PM2.5 level is:
48 (Unhealthy for Sensitive Groups)
For comparison, the highest level of PM2.5 in Bathinda in the last 7 days was: 48 (Monday, October 31, 2022) and the lowest: 48 (Monday, October 31, 2022).
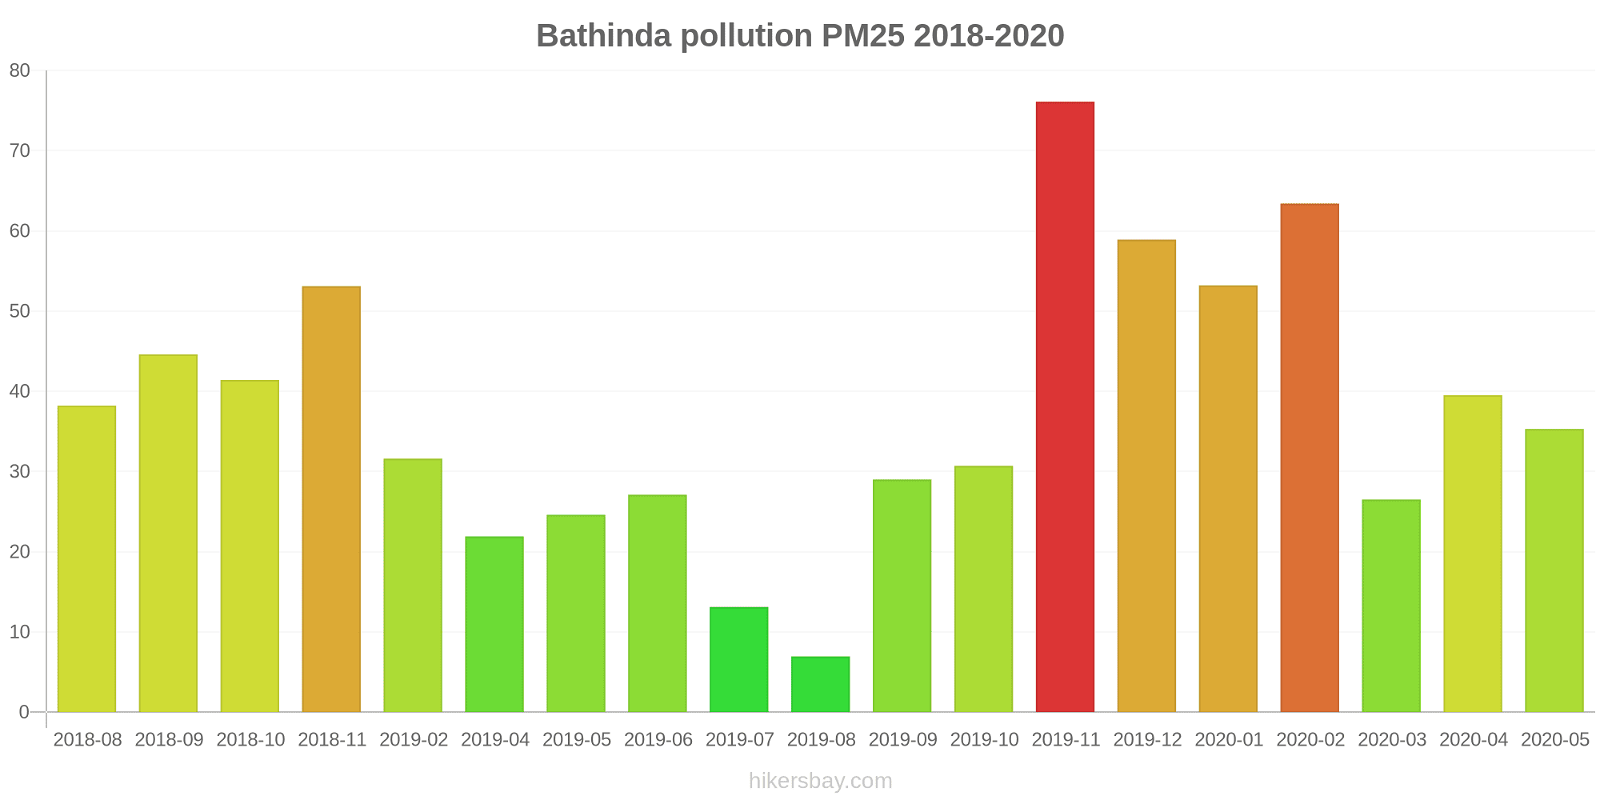
The highest PM2.5 values were recorded: 76 (November 2019).
The lowest level of particulate matter PM2.5 pollution occurs in month: August (6.9).
What is the level of PM10 today in Bathinda? (particulate matter (PM10) suspended dust)
The current level of particulate matter PM10 in Bathinda is:
109 (Unhealthy)
The highest PM10 values usually occur in month: 159 (December 2019).
The lowest value of particulate matter PM10 pollution in Bathinda is usually recorded in: August (14).
How high is the level of NO2? (nitrogen dioxide (NO2))
22 (Good)
What is the level of SO2 pollution? (sulfur dioxide (SO2))
34 (Good)
Current data Monday, October 31, 2022, 1:45 AM
CO 950 (Good)
PM2,5 48 (Unhealthy for Sensitive Groups)
PM10 109 (Unhealthy)
NO2 22 (Good)
SO2 34 (Good)
Data on air pollution from recent days in Bathinda
index
2022-10-31
co
1450
Good
pm25
48
Unhealthy for Sensitive Groups
pm10
71
Unhealthy for Sensitive Groups
no2
21
Good
so2
34
Good
data source »
Air pollution in Bathinda from August 2018 to May 2020
index
2020-05
2020-04
2020-03
2020-02
2020-01
2019-12
2019-11
2019-10
2019-09
2019-08
2019-07
2019-06
2019-05
2019-04
2019-02
2018-11
2018-10
2018-09
2018-08
pm25
35 (Unhealthy for Sensitive Groups)
40 (Unhealthy for Sensitive Groups)
27 (Moderate)
63 (Unhealthy)
53 (Unhealthy for Sensitive Groups)
59 (Unhealthy)
76 (Very Unhealthy)
31 (Moderate)
29 (Moderate)
6.9 (Good)
13 (Moderate)
27 (Moderate)
25 (Moderate)
22 (Moderate)
32 (Moderate)
53 (Unhealthy for Sensitive Groups)
41 (Unhealthy for Sensitive Groups)
45 (Unhealthy for Sensitive Groups)
38 (Unhealthy for Sensitive Groups)
pm10
76 (Unhealthy for Sensitive Groups)
55 (Unhealthy for Sensitive Groups)
83 (Unhealthy)
118 (Very Unhealthy)
92 (Unhealthy)
159 (Very bad Hazardous)
149 (Very Unhealthy)
111 (Very Unhealthy)
64 (Unhealthy for Sensitive Groups)
14 (Good)
45 (Moderate)
88 (Unhealthy)
106 (Unhealthy)
124 (Very Unhealthy)
118 (Very Unhealthy)
120 (Very Unhealthy)
100 (Unhealthy)
68 (Unhealthy for Sensitive Groups)
59 (Unhealthy for Sensitive Groups)
no2
18 (Good)
18 (Good)
18 (Good)
18 (Good)
18 (Good)
18 (Good)
23 (Good)
23 (Good)
23 (Good)
23 (Good)
21 (Good)
20 (Good)
21 (Good)
21 (Good)
18 (Good)
14 (Good)
16 (Good)
9.6 (Good)
10 (Good)
so2
9.6 (Good)
8.8 (Good)
8.6 (Good)
5.3 (Good)
7.4 (Good)
7.4 (Good)
7.1 (Good)
6.7 (Good)
6.5 (Good)
4.6 (Good)
4.4 (Good)
15 (Good)
4.4 (Good)
5.3 (Good)
3.1 (Good)
18 (Good)
3 (Good)
6.1 (Good)
6.6 (Good)
co
502 (Good)
1 (Good)
2 (Good)
1 (Good)
1 (Good)
1 (Good)
2 (Good)
2 (Good)
1 (Good)
- (Good)
1 (Good)
966 (Good)
1 (Good)
953 (Good)
575 (Good)
218 (Good)
200 (Good)
128 (Good)
392 (Good)
data source »
Quality of life in Bathinda
Green and Parks in the City
Bathinda
59%
Nepal: 32%
Bangladesh: 33%
Bhutan: 82%
Sri Lanka: 59%
Pakistan: 49%
Pleasure of spending time in the city
Bathinda
41%
Nepal: 32%
Bangladesh: 26%
Bhutan: 61%
Sri Lanka: 52%
Pakistan: 43%
Air Pollution
Bathinda
69%
Nepal: 76%
Bangladesh: 78%
Bhutan: 45%
Sri Lanka: 53%
Pakistan: 64%
Garbage Disposal
Bathinda
44%
Nepal: 25%
Bangladesh: 22%
Bhutan: 47%
Sri Lanka: 41%
Pakistan: 34%
Availability and quality of drinking water
Bathinda
55%
Nepal: 36%
Bangladesh: 44%
Bhutan: 64%
Sri Lanka: 65%
Pakistan: 44%
Cleanliness and tidiness
Bathinda
53%
Nepal: 27%
Bangladesh: 23%
Bhutan: 57%
Sri Lanka: 52%
Pakistan: 40%
Noise and Light pollution
Bathinda
53%
Nepal: 55%
Bangladesh: 63%
Bhutan: 55%
Sri Lanka: 50%
Pakistan: 59%
Water Pollution
Bathinda
69%
Nepal: 76%
Bangladesh: 74%
Bhutan: 56%
Sri Lanka: 57%
Pakistan: 70%
Source: Numbeo
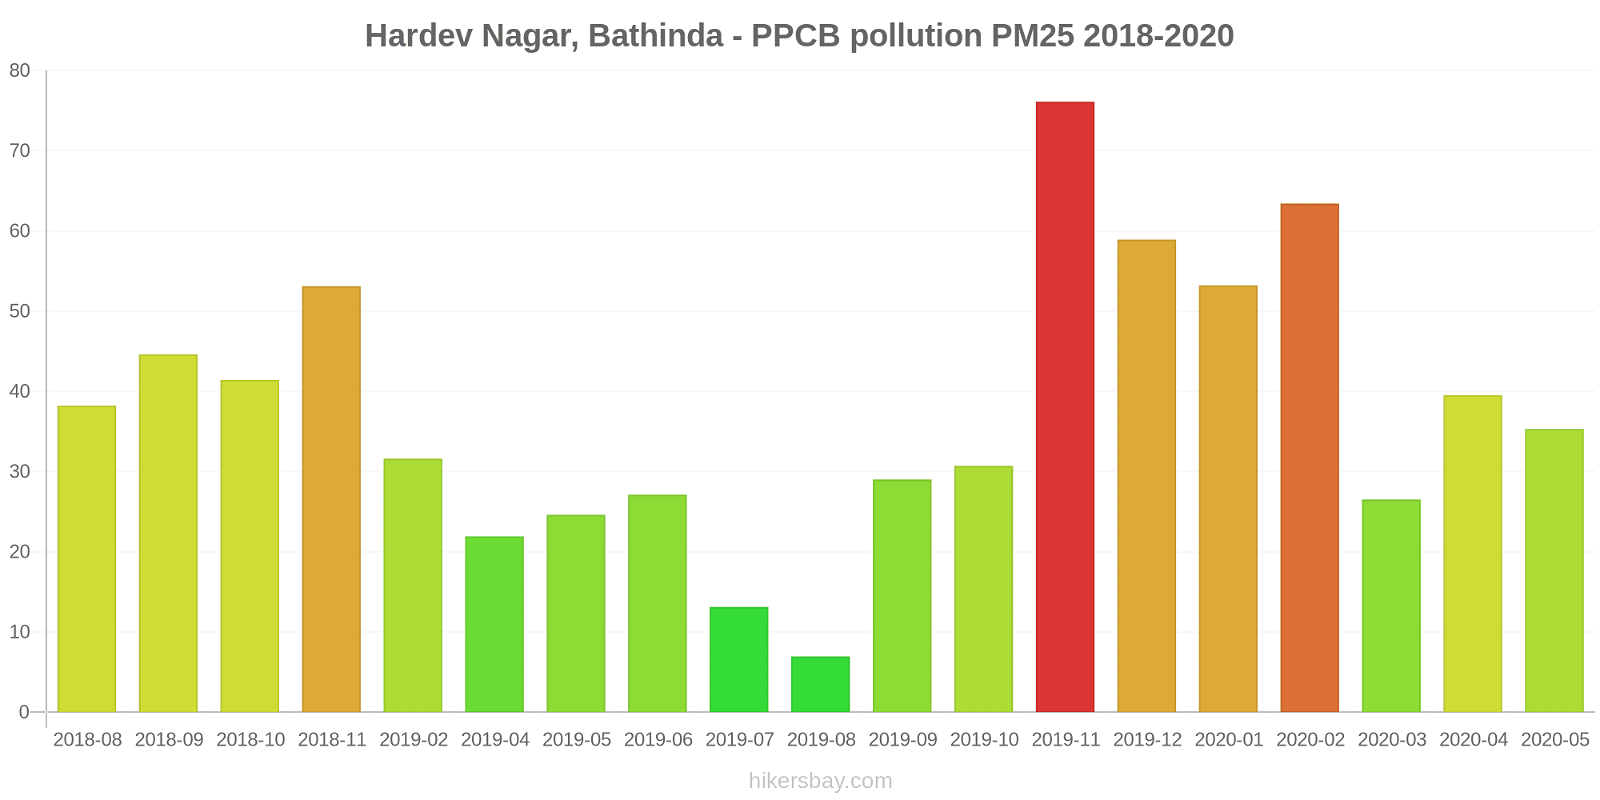
Hardev Nagar, Bathinda - PPCB
Monday, October 31, 2022, 1:45 AM
CO 950 (Good)
carbon monoxide (CO)
PM2,5 48 (Unhealthy for Sensitive Groups)
particulate matter (PM2.5) dust
PM10 109 (Unhealthy)
particulate matter (PM10) suspended dust
NO2 22 (Good)
nitrogen dioxide (NO2)
SO2 34 (Good)
sulfur dioxide (SO2)
Hardev Nagar, Bathinda - PPCB
index
2022-10-31
co
1450
pm25
48
pm10
71
no2
21
so2
34
Hardev Nagar, Bathinda - PPCB
2018-08 2020-05
index
2020-05
2020-04
2020-03
2020-02
2020-01
2019-12
2019-11
2019-10
2019-09
2019-08
2019-07
2019-06
2019-05
2019-04
2019-02
2018-11
2018-10
2018-09
2018-08
pm25
35
40
27
63
53
59
76
31
29
6.9
13
27
25
22
32
53
41
45
38
pm10
76
55
83
118
92
159
149
111
64
14
45
88
106
124
118
120
100
68
59
no2
18
18
18
18
18
18
23
23
23
23
21
20
21
21
18
14
16
9.6
10
so2
9.6
8.8
8.6
5.3
7.4
7.4
7.1
6.7
6.5
4.6
4.4
15
4.4
5.3
3.1
18
3
6.1
6.6
co
502
1
2
1
1
1
2
2
1
-
1
966
1
953
575
218
200
128
392
* Pollution data source:
https://openaq.org
(caaqm)
The data is licensed under CC-By 4.0
CO 950 (Good)
PM2,5 48 (Unhealthy for Sensitive Groups)
PM10 109 (Unhealthy)
NO2 22 (Good)
SO2 34 (Good)
Data on air pollution from recent days in Bathinda
| index | 2022-10-31 |
|---|---|
| co | 1450 Good |
| pm25 | 48 Unhealthy for Sensitive Groups |
| pm10 | 71 Unhealthy for Sensitive Groups |
| no2 | 21 Good |
| so2 | 34 Good |

| index | 2020-05 | 2020-04 | 2020-03 | 2020-02 | 2020-01 | 2019-12 | 2019-11 | 2019-10 | 2019-09 | 2019-08 | 2019-07 | 2019-06 | 2019-05 | 2019-04 | 2019-02 | 2018-11 | 2018-10 | 2018-09 | 2018-08 |
|---|---|---|---|---|---|---|---|---|---|---|---|---|---|---|---|---|---|---|---|
| pm25 | 35 (Unhealthy for Sensitive Groups) | 40 (Unhealthy for Sensitive Groups) | 27 (Moderate) | 63 (Unhealthy) | 53 (Unhealthy for Sensitive Groups) | 59 (Unhealthy) | 76 (Very Unhealthy) | 31 (Moderate) | 29 (Moderate) | 6.9 (Good) | 13 (Moderate) | 27 (Moderate) | 25 (Moderate) | 22 (Moderate) | 32 (Moderate) | 53 (Unhealthy for Sensitive Groups) | 41 (Unhealthy for Sensitive Groups) | 45 (Unhealthy for Sensitive Groups) | 38 (Unhealthy for Sensitive Groups) |
| pm10 | 76 (Unhealthy for Sensitive Groups) | 55 (Unhealthy for Sensitive Groups) | 83 (Unhealthy) | 118 (Very Unhealthy) | 92 (Unhealthy) | 159 (Very bad Hazardous) | 149 (Very Unhealthy) | 111 (Very Unhealthy) | 64 (Unhealthy for Sensitive Groups) | 14 (Good) | 45 (Moderate) | 88 (Unhealthy) | 106 (Unhealthy) | 124 (Very Unhealthy) | 118 (Very Unhealthy) | 120 (Very Unhealthy) | 100 (Unhealthy) | 68 (Unhealthy for Sensitive Groups) | 59 (Unhealthy for Sensitive Groups) |
| no2 | 18 (Good) | 18 (Good) | 18 (Good) | 18 (Good) | 18 (Good) | 18 (Good) | 23 (Good) | 23 (Good) | 23 (Good) | 23 (Good) | 21 (Good) | 20 (Good) | 21 (Good) | 21 (Good) | 18 (Good) | 14 (Good) | 16 (Good) | 9.6 (Good) | 10 (Good) |
| so2 | 9.6 (Good) | 8.8 (Good) | 8.6 (Good) | 5.3 (Good) | 7.4 (Good) | 7.4 (Good) | 7.1 (Good) | 6.7 (Good) | 6.5 (Good) | 4.6 (Good) | 4.4 (Good) | 15 (Good) | 4.4 (Good) | 5.3 (Good) | 3.1 (Good) | 18 (Good) | 3 (Good) | 6.1 (Good) | 6.6 (Good) |
| co | 502 (Good) | 1 (Good) | 2 (Good) | 1 (Good) | 1 (Good) | 1 (Good) | 2 (Good) | 2 (Good) | 1 (Good) | - (Good) | 1 (Good) | 966 (Good) | 1 (Good) | 953 (Good) | 575 (Good) | 218 (Good) | 200 (Good) | 128 (Good) | 392 (Good) |
Green and Parks in the City
Bathinda 59%
Nepal: 32% Bangladesh: 33% Bhutan: 82% Sri Lanka: 59% Pakistan: 49%Pleasure of spending time in the city
Bathinda 41%
Nepal: 32% Bangladesh: 26% Bhutan: 61% Sri Lanka: 52% Pakistan: 43%Air Pollution
Bathinda 69%
Nepal: 76% Bangladesh: 78% Bhutan: 45% Sri Lanka: 53% Pakistan: 64%Garbage Disposal
Bathinda 44%
Nepal: 25% Bangladesh: 22% Bhutan: 47% Sri Lanka: 41% Pakistan: 34%Availability and quality of drinking water
Bathinda 55%
Nepal: 36% Bangladesh: 44% Bhutan: 64% Sri Lanka: 65% Pakistan: 44%Cleanliness and tidiness
Bathinda 53%
Nepal: 27% Bangladesh: 23% Bhutan: 57% Sri Lanka: 52% Pakistan: 40%Noise and Light pollution
Bathinda 53%
Nepal: 55% Bangladesh: 63% Bhutan: 55% Sri Lanka: 50% Pakistan: 59%Water Pollution
Bathinda 69%
Nepal: 76% Bangladesh: 74% Bhutan: 56% Sri Lanka: 57% Pakistan: 70%CO 950 (Good)
carbon monoxide (CO)PM2,5 48 (Unhealthy for Sensitive Groups)
particulate matter (PM2.5) dustPM10 109 (Unhealthy)
particulate matter (PM10) suspended dustNO2 22 (Good)
nitrogen dioxide (NO2)SO2 34 (Good)
sulfur dioxide (SO2)Hardev Nagar, Bathinda - PPCB
| index | 2022-10-31 |
|---|---|
| co | 1450 |
| pm25 | 48 |
| pm10 | 71 |
| no2 | 21 |
| so2 | 34 |
Hardev Nagar, Bathinda - PPCB

| index | 2020-05 | 2020-04 | 2020-03 | 2020-02 | 2020-01 | 2019-12 | 2019-11 | 2019-10 | 2019-09 | 2019-08 | 2019-07 | 2019-06 | 2019-05 | 2019-04 | 2019-02 | 2018-11 | 2018-10 | 2018-09 | 2018-08 |
|---|---|---|---|---|---|---|---|---|---|---|---|---|---|---|---|---|---|---|---|
| pm25 | 35 | 40 | 27 | 63 | 53 | 59 | 76 | 31 | 29 | 6.9 | 13 | 27 | 25 | 22 | 32 | 53 | 41 | 45 | 38 |
| pm10 | 76 | 55 | 83 | 118 | 92 | 159 | 149 | 111 | 64 | 14 | 45 | 88 | 106 | 124 | 118 | 120 | 100 | 68 | 59 |
| no2 | 18 | 18 | 18 | 18 | 18 | 18 | 23 | 23 | 23 | 23 | 21 | 20 | 21 | 21 | 18 | 14 | 16 | 9.6 | 10 |
| so2 | 9.6 | 8.8 | 8.6 | 5.3 | 7.4 | 7.4 | 7.1 | 6.7 | 6.5 | 4.6 | 4.4 | 15 | 4.4 | 5.3 | 3.1 | 18 | 3 | 6.1 | 6.6 |
| co | 502 | 1 | 2 | 1 | 1 | 1 | 2 | 2 | 1 | - | 1 | 966 | 1 | 953 | 575 | 218 | 200 | 128 | 392 |