Air Pollution in Damoh: Real-time Air Quality Index and smog alert.
Pollution and air quality forecast for Damoh. Today is Wednesday, May 13, 2026. The following air pollution values have been recorded for Damoh:- particulate matter (PM2.5) dust - 81 (Very Unhealthy)
- nitrogen dioxide (NO2) - 4 (Good)
- particulate matter (PM10) suspended dust - 93 (Unhealthy)
- carbon monoxide (CO) - 490 (Good)

What is the air quality in Damoh today? Is the air polluted in Damoh?. Is there smog?
What is the current level of PM2.5 in Damoh? (particulate matter (PM2.5) dust)
Today's PM2.5 level is:
81 (Very Unhealthy)
For comparison, the highest level of PM2.5 in Damoh in the last 7 days was: 79 (Monday, October 31, 2022) and the lowest: 79 (Monday, October 31, 2022).
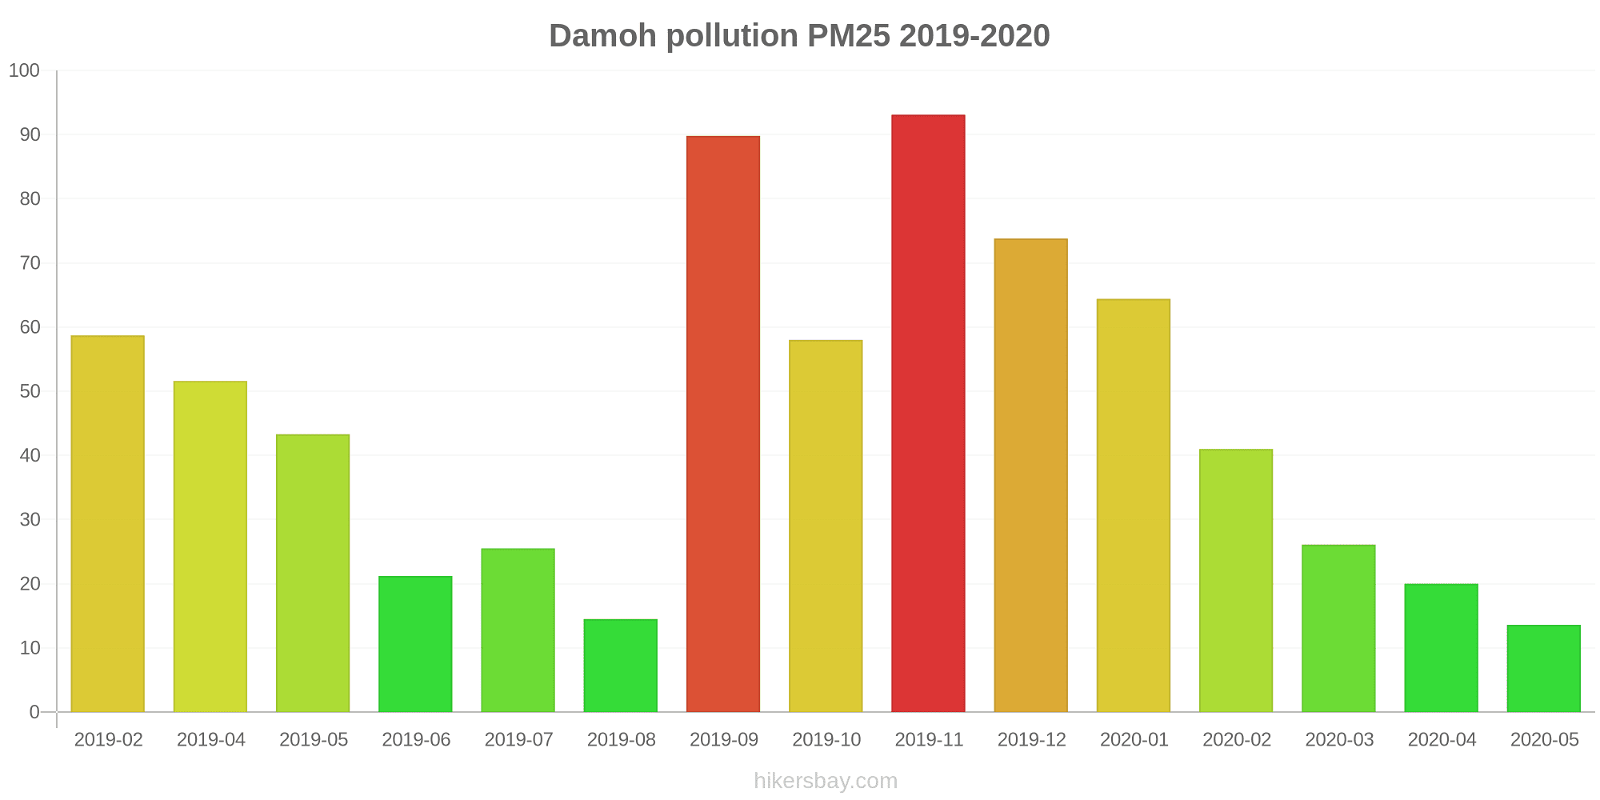
The highest PM2.5 values were recorded: 93 (November 2019).
The lowest level of particulate matter PM2.5 pollution occurs in month: May (14).
How high is the level of NO2? (nitrogen dioxide (NO2))
4 (Good)
What is the level of PM10 today in Damoh? (particulate matter (PM10) suspended dust)
The current level of particulate matter PM10 in Damoh is:
93 (Unhealthy)
The highest PM10 values usually occur in month: 137 (October 2019).
The lowest value of particulate matter PM10 pollution in Damoh is usually recorded in: August (42).
How high is the CO level? (carbon monoxide (CO))
490 (Good)
Current data Monday, October 31, 2022, 2:00 AM
PM2,5 81 (Very Unhealthy)
NO2 4 (Good)
PM10 93 (Unhealthy)
CO 490 (Good)
Data on air pollution from recent days in Damoh
index
2022-10-31
pm25
79
Very Unhealthy
no2
4
Good
pm10
85
Unhealthy
co
495
Good
data source »
Air pollution in Damoh from February 2019 to May 2020
index
2020-05
2020-04
2020-03
2020-02
2020-01
2019-12
2019-11
2019-10
2019-09
2019-08
2019-07
2019-06
2019-05
2019-04
2019-02
pm25
14 (Moderate)
20 (Moderate)
26 (Moderate)
41 (Unhealthy for Sensitive Groups)
64 (Unhealthy)
74 (Unhealthy)
93 (Very Unhealthy)
58 (Unhealthy)
90 (Very Unhealthy)
15 (Moderate)
26 (Moderate)
21 (Moderate)
43 (Unhealthy for Sensitive Groups)
52 (Unhealthy for Sensitive Groups)
59 (Unhealthy)
pm10
68 (Unhealthy for Sensitive Groups)
58 (Unhealthy for Sensitive Groups)
74 (Unhealthy for Sensitive Groups)
85 (Unhealthy)
79 (Unhealthy for Sensitive Groups)
100 (Unhealthy)
121 (Very Unhealthy)
137 (Very Unhealthy)
88 (Unhealthy)
42 (Moderate)
114 (Very Unhealthy)
42 (Moderate)
74 (Unhealthy for Sensitive Groups)
79 (Unhealthy for Sensitive Groups)
114 (Very Unhealthy)
no2
15 (Good)
15 (Good)
15 (Good)
15 (Good)
15 (Good)
14 (Good)
15 (Good)
16 (Good)
- (Good)
15 (Good)
- (Good)
- (Good)
- (Good)
- (Good)
14 (Good)
co
319 (Good)
295 (Good)
291 (Good)
291 (Good)
293 (Good)
223 (Good)
177 (Good)
143 (Good)
93 (Good)
19 (Good)
19 (Good)
23 (Good)
35 (Good)
26 (Good)
519 (Good)
data source »
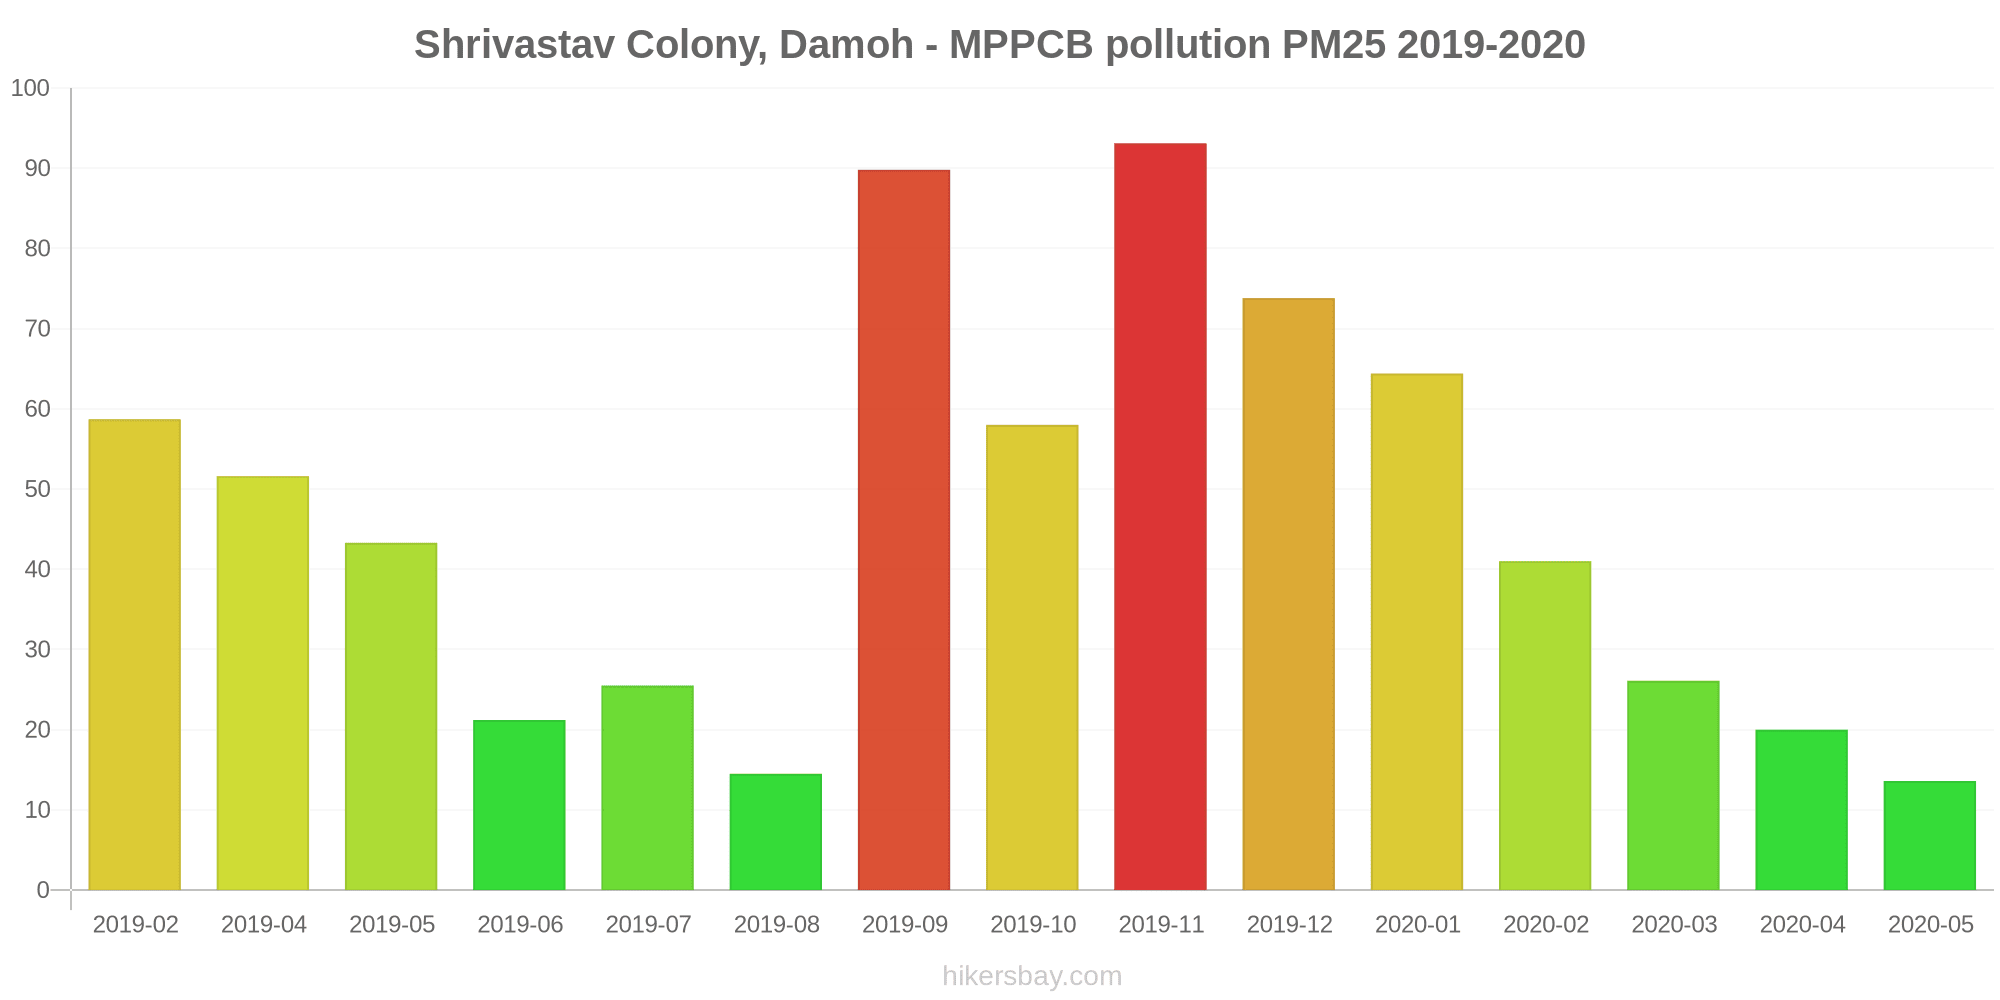
Shrivastav Colony, Damoh - MPPCB
Monday, October 31, 2022, 2:00 AM
PM2,5 81 (Very Unhealthy)
particulate matter (PM2.5) dust
NO2 4.4 (Good)
nitrogen dioxide (NO2)
PM10 93 (Unhealthy)
particulate matter (PM10) suspended dust
CO 490 (Good)
carbon monoxide (CO)
Shrivastav Colony, Damoh - MPPCB
index
2022-10-31
pm25
79
no2
4.3
pm10
85
co
495
Shrivastav Colony, Damoh - MPPCB
2019-02 2020-05

index
2020-05
2020-04
2020-03
2020-02
2020-01
2019-12
2019-11
2019-10
2019-09
2019-08
2019-07
2019-06
2019-05
2019-04
2019-02
pm25
14
20
26
41
64
74
93
58
90
15
26
21
43
52
59
pm10
68
58
74
85
79
100
121
137
88
42
114
42
74
79
114
no2
15
15
15
15
15
14
15
16
-
15
-
-
-
-
14
co
319
295
291
291
293
223
177
143
93
19
19
23
35
26
519
* Pollution data source:
https://openaq.org
(caaqm)
The data is licensed under CC-By 4.0
PM2,5 81 (Very Unhealthy)
NO2 4 (Good)
PM10 93 (Unhealthy)
CO 490 (Good)
Data on air pollution from recent days in Damoh
| index | 2022-10-31 |
|---|---|
| pm25 | 79 Very Unhealthy |
| no2 | 4 Good |
| pm10 | 85 Unhealthy |
| co | 495 Good |

| index | 2020-05 | 2020-04 | 2020-03 | 2020-02 | 2020-01 | 2019-12 | 2019-11 | 2019-10 | 2019-09 | 2019-08 | 2019-07 | 2019-06 | 2019-05 | 2019-04 | 2019-02 |
|---|---|---|---|---|---|---|---|---|---|---|---|---|---|---|---|
| pm25 | 14 (Moderate) | 20 (Moderate) | 26 (Moderate) | 41 (Unhealthy for Sensitive Groups) | 64 (Unhealthy) | 74 (Unhealthy) | 93 (Very Unhealthy) | 58 (Unhealthy) | 90 (Very Unhealthy) | 15 (Moderate) | 26 (Moderate) | 21 (Moderate) | 43 (Unhealthy for Sensitive Groups) | 52 (Unhealthy for Sensitive Groups) | 59 (Unhealthy) |
| pm10 | 68 (Unhealthy for Sensitive Groups) | 58 (Unhealthy for Sensitive Groups) | 74 (Unhealthy for Sensitive Groups) | 85 (Unhealthy) | 79 (Unhealthy for Sensitive Groups) | 100 (Unhealthy) | 121 (Very Unhealthy) | 137 (Very Unhealthy) | 88 (Unhealthy) | 42 (Moderate) | 114 (Very Unhealthy) | 42 (Moderate) | 74 (Unhealthy for Sensitive Groups) | 79 (Unhealthy for Sensitive Groups) | 114 (Very Unhealthy) |
| no2 | 15 (Good) | 15 (Good) | 15 (Good) | 15 (Good) | 15 (Good) | 14 (Good) | 15 (Good) | 16 (Good) | - (Good) | 15 (Good) | - (Good) | - (Good) | - (Good) | - (Good) | 14 (Good) |
| co | 319 (Good) | 295 (Good) | 291 (Good) | 291 (Good) | 293 (Good) | 223 (Good) | 177 (Good) | 143 (Good) | 93 (Good) | 19 (Good) | 19 (Good) | 23 (Good) | 35 (Good) | 26 (Good) | 519 (Good) |
PM2,5 81 (Very Unhealthy)
particulate matter (PM2.5) dustNO2 4.4 (Good)
nitrogen dioxide (NO2)PM10 93 (Unhealthy)
particulate matter (PM10) suspended dustCO 490 (Good)
carbon monoxide (CO)Shrivastav Colony, Damoh - MPPCB
| index | 2022-10-31 |
|---|---|
| pm25 | 79 |
| no2 | 4.3 |
| pm10 | 85 |
| co | 495 |
Shrivastav Colony, Damoh - MPPCB
| index | 2020-05 | 2020-04 | 2020-03 | 2020-02 | 2020-01 | 2019-12 | 2019-11 | 2019-10 | 2019-09 | 2019-08 | 2019-07 | 2019-06 | 2019-05 | 2019-04 | 2019-02 |
|---|---|---|---|---|---|---|---|---|---|---|---|---|---|---|---|
| pm25 | 14 | 20 | 26 | 41 | 64 | 74 | 93 | 58 | 90 | 15 | 26 | 21 | 43 | 52 | 59 |
| pm10 | 68 | 58 | 74 | 85 | 79 | 100 | 121 | 137 | 88 | 42 | 114 | 42 | 74 | 79 | 114 |
| no2 | 15 | 15 | 15 | 15 | 15 | 14 | 15 | 16 | - | 15 | - | - | - | - | 14 |
| co | 319 | 295 | 291 | 291 | 293 | 223 | 177 | 143 | 93 | 19 | 19 | 23 | 35 | 26 | 519 |