Air Pollution in Darjeeling: Real-time Air Quality Index and smog alert.
Pollution and air quality forecast for Darjeeling. Today is Wednesday, May 13, 2026. The following air pollution values have been recorded for Darjeeling:- ozone (O3) - 25 (Good)
- particulate matter (PM2.5) dust - 62 (Unhealthy)
- particulate matter (PM10) suspended dust - 259 (Very bad Hazardous)
- nitrogen dioxide (NO2) - 24 (Good)
- carbon monoxide (CO) - 300 (Good)

What is the air quality in Darjeeling today? Is the air polluted in Darjeeling?. Is there smog?
How is the O3 level today in Darjeeling? (ozone (O3))
25 (Good)
What is the current level of PM2.5 in Darjeeling? (particulate matter (PM2.5) dust)
Today's PM2.5 level is:
62 (Unhealthy)
For comparison, the highest level of PM2.5 in Darjeeling in the last 7 days was: 58 (Monday, October 31, 2022) and the lowest: 58 (Monday, October 31, 2022).
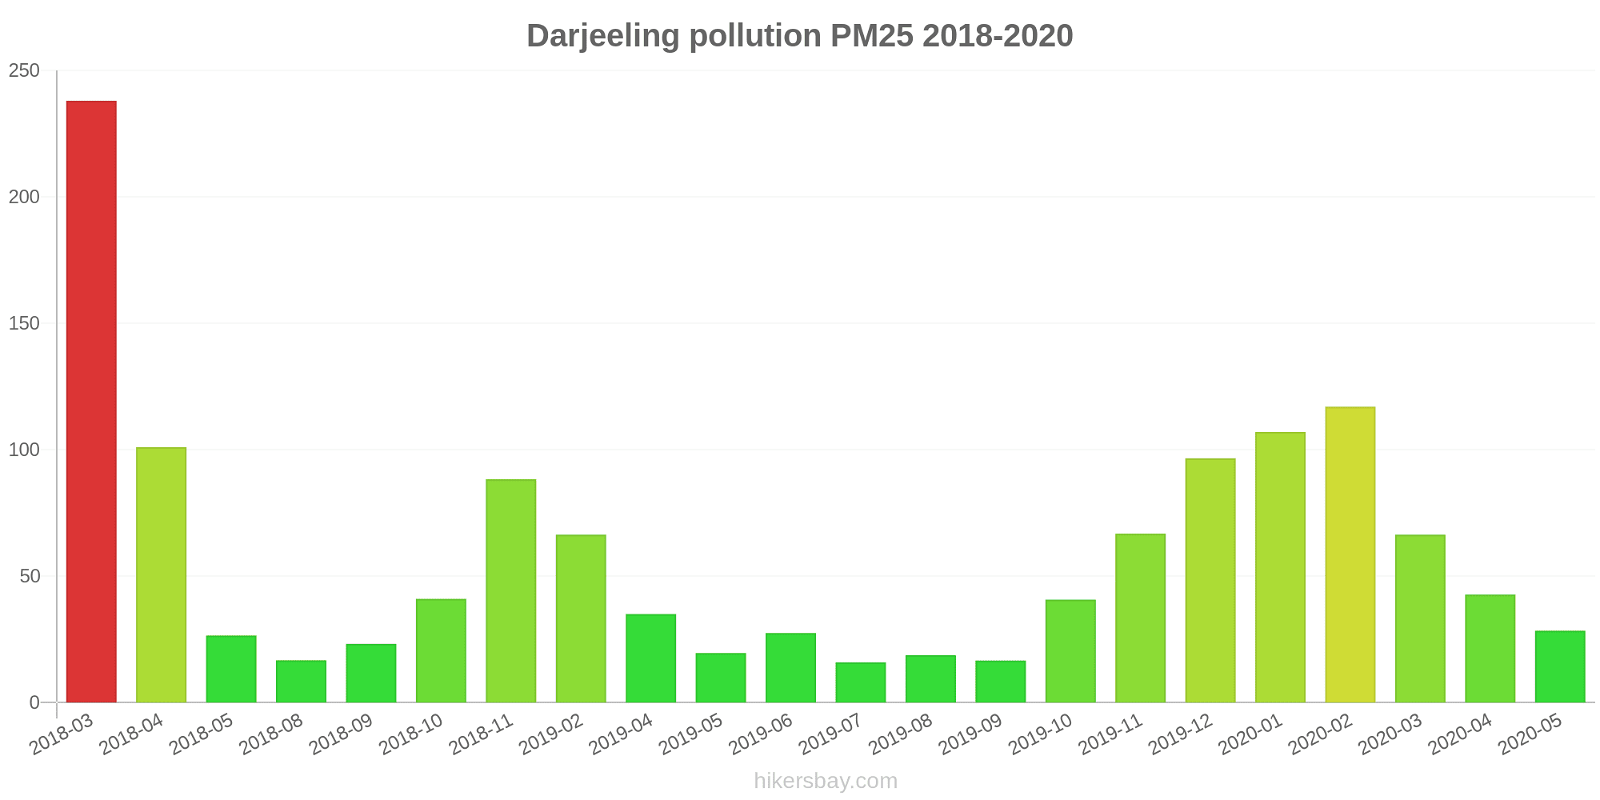
The highest PM2.5 values were recorded: 238 (March 2018).
The lowest level of particulate matter PM2.5 pollution occurs in month: July (16).
What is the level of PM10 today in Darjeeling? (particulate matter (PM10) suspended dust)
The current level of particulate matter PM10 in Darjeeling is:
259 (Very bad Hazardous)
The highest PM10 values usually occur in month: 193 (February 2020).
The lowest value of particulate matter PM10 pollution in Darjeeling is usually recorded in: July (30).
How high is the level of NO2? (nitrogen dioxide (NO2))
24 (Good)
How high is the CO level? (carbon monoxide (CO))
300 (Good)
Current data Monday, October 31, 2022, 1:45 AM
O3 25 (Good)
PM2,5 62 (Unhealthy)
PM10 259 (Very bad Hazardous)
NO2 24 (Good)
CO 300 (Good)
Data on air pollution from recent days in Darjeeling
index
2022-10-31
o3
20
Good
pm25
58
Unhealthy
pm10
293
Very bad Hazardous
no2
25
Good
co
860
Good
data source »
Air pollution in Darjeeling from March 2018 to May 2020
index
2020-05
2020-04
2020-03
2020-02
2020-01
2019-12
2019-11
2019-10
2019-09
2019-08
2019-07
2019-06
2019-05
2019-04
2019-02
2018-11
2018-10
2018-09
2018-08
2018-05
2018-04
2018-03
pm25
28 (Moderate)
43 (Unhealthy for Sensitive Groups)
66 (Unhealthy)
117 (Very bad Hazardous)
107 (Very Unhealthy)
97 (Very Unhealthy)
67 (Unhealthy)
41 (Unhealthy for Sensitive Groups)
17 (Moderate)
19 (Moderate)
16 (Moderate)
28 (Moderate)
20 (Moderate)
35 (Unhealthy for Sensitive Groups)
66 (Unhealthy)
88 (Very Unhealthy)
41 (Unhealthy for Sensitive Groups)
23 (Moderate)
17 (Moderate)
27 (Moderate)
101 (Very Unhealthy)
238 (Very bad Hazardous)
pm10
41 (Moderate)
67 (Unhealthy for Sensitive Groups)
115 (Very Unhealthy)
193 (Very bad Hazardous)
183 (Very bad Hazardous)
166 (Very bad Hazardous)
161 (Very bad Hazardous)
74 (Unhealthy for Sensitive Groups)
33 (Moderate)
35 (Moderate)
30 (Moderate)
54 (Unhealthy for Sensitive Groups)
34 (Moderate)
56 (Unhealthy for Sensitive Groups)
147 (Very Unhealthy)
161 (Very bad Hazardous)
86 (Unhealthy)
47 (Moderate)
34 (Moderate)
59 (Unhealthy for Sensitive Groups)
89 (Unhealthy)
155 (Very bad Hazardous)
no2
24 (Good)
27 (Good)
51 (Moderate)
52 (Moderate)
44 (Moderate)
44 (Moderate)
27 (Good)
16 (Good)
20 (Good)
16 (Good)
16 (Good)
23 (Good)
24 (Good)
26 (Good)
40 (Moderate)
36 (Good)
26 (Good)
18 (Good)
16 (Good)
24 (Good)
34 (Good)
49 (Moderate)
co
469 (Good)
543 (Good)
690 (Good)
885 (Good)
941 (Good)
817 (Good)
845 (Good)
583 (Good)
513 (Good)
463 (Good)
694 (Good)
963 (Good)
971 (Good)
1 (Good)
872 (Good)
798 (Good)
706 (Good)
552 (Good)
488 (Good)
769 (Good)
18 (Good)
43 (Good)
o3
35 (Good)
30 (Good)
27 (Good)
26 (Good)
25 (Good)
28 (Good)
29 (Good)
25 (Good)
16 (Good)
15 (Good)
17 (Good)
19 (Good)
29 (Good)
33 (Good)
30 (Good)
28 (Good)
34 (Good)
17 (Good)
15 (Good)
44 (Good)
45 (Good)
29 (Good)
so2
- (Good)
- (Good)
- (Good)
- (Good)
- (Good)
- (Good)
- (Good)
- (Good)
- (Good)
- (Good)
- (Good)
- (Good)
- (Good)
- (Good)
- (Good)
- (Good)
- (Good)
- (Good)
- (Good)
- (Good)
7.8 (Good)
8.3 (Good)
data source »
Quality of life in Darjeeling
Green and Parks in the City
Darjeeling
50%
Nepal: 32%
Bangladesh: 33%
Bhutan: 82%
Sri Lanka: 59%
Pakistan: 49%
Pleasure of spending time in the city
Darjeeling
47%
Nepal: 32%
Bangladesh: 26%
Bhutan: 61%
Sri Lanka: 52%
Pakistan: 43%
Air Pollution
Darjeeling
61%
Nepal: 76%
Bangladesh: 78%
Bhutan: 45%
Sri Lanka: 53%
Pakistan: 64%
Garbage Disposal
Darjeeling
23%
Nepal: 25%
Bangladesh: 22%
Bhutan: 47%
Sri Lanka: 41%
Pakistan: 34%
Availability and quality of drinking water
Darjeeling
53%
Nepal: 36%
Bangladesh: 44%
Bhutan: 64%
Sri Lanka: 65%
Pakistan: 44%
Cleanliness and tidiness
Darjeeling
28%
Nepal: 27%
Bangladesh: 23%
Bhutan: 57%
Sri Lanka: 52%
Pakistan: 40%
Noise and Light pollution
Darjeeling
61%
Nepal: 55%
Bangladesh: 63%
Bhutan: 55%
Sri Lanka: 50%
Pakistan: 59%
Water Pollution
Darjeeling
65%
Nepal: 76%
Bangladesh: 74%
Bhutan: 56%
Sri Lanka: 57%
Pakistan: 70%
Source: Numbeo
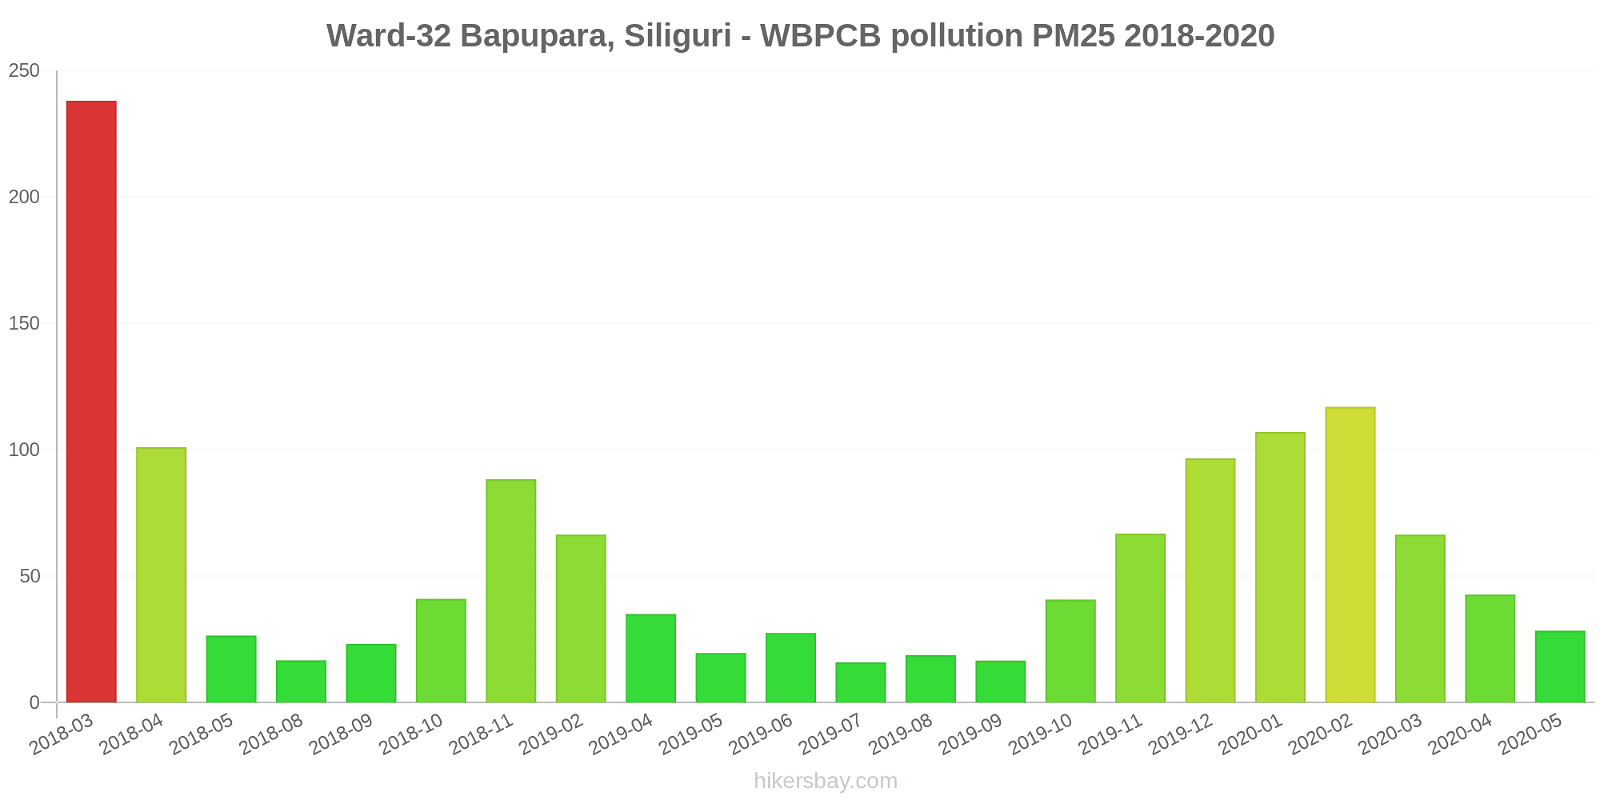
Ward-32 Bapupara, Siliguri - WBPCB
Monday, October 31, 2022, 1:45 AM
O3 25 (Good)
ozone (O3)
PM2,5 62 (Unhealthy)
particulate matter (PM2.5) dust
PM10 259 (Very bad Hazardous)
particulate matter (PM10) suspended dust
NO2 24 (Good)
nitrogen dioxide (NO2)
CO 300 (Good)
carbon monoxide (CO)
Ward-32 Bapupara, Siliguri - WBPCB
index
2022-10-31
o3
20
pm25
58
pm10
293
no2
25
co
860
Ward-32 Bapupara, Siliguri - WBPCB
2018-03 2020-05
index
2020-05
2020-04
2020-03
2020-02
2020-01
2019-12
2019-11
2019-10
2019-09
2019-08
2019-07
2019-06
2019-05
2019-04
2019-02
2018-11
2018-10
2018-09
2018-08
2018-05
2018-04
2018-03
pm25
28
43
66
117
107
97
67
41
17
19
16
28
20
35
66
88
41
23
17
27
101
238
pm10
41
67
115
193
183
166
161
74
33
35
30
54
34
56
147
161
86
47
34
59
89
155
no2
24
27
51
52
44
44
27
16
20
16
16
23
24
26
40
36
26
18
16
24
34
49
so2
-
-
-
-
-
-
-
-
-
-
-
-
-
-
-
-
-
-
-
-
7.8
8.3
co
469
543
690
885
941
817
845
583
513
463
694
963
971
1
872
798
706
552
488
769
18
43
o3
35
30
27
26
25
28
29
25
16
15
17
19
29
33
30
28
34
17
15
44
45
29
* Pollution data source:
https://openaq.org
(caaqm)
The data is licensed under CC-By 4.0
O3 25 (Good)
PM2,5 62 (Unhealthy)
PM10 259 (Very bad Hazardous)
NO2 24 (Good)
CO 300 (Good)
Data on air pollution from recent days in Darjeeling
| index | 2022-10-31 |
|---|---|
| o3 | 20 Good |
| pm25 | 58 Unhealthy |
| pm10 | 293 Very bad Hazardous |
| no2 | 25 Good |
| co | 860 Good |

| index | 2020-05 | 2020-04 | 2020-03 | 2020-02 | 2020-01 | 2019-12 | 2019-11 | 2019-10 | 2019-09 | 2019-08 | 2019-07 | 2019-06 | 2019-05 | 2019-04 | 2019-02 | 2018-11 | 2018-10 | 2018-09 | 2018-08 | 2018-05 | 2018-04 | 2018-03 |
|---|---|---|---|---|---|---|---|---|---|---|---|---|---|---|---|---|---|---|---|---|---|---|
| pm25 | 28 (Moderate) | 43 (Unhealthy for Sensitive Groups) | 66 (Unhealthy) | 117 (Very bad Hazardous) | 107 (Very Unhealthy) | 97 (Very Unhealthy) | 67 (Unhealthy) | 41 (Unhealthy for Sensitive Groups) | 17 (Moderate) | 19 (Moderate) | 16 (Moderate) | 28 (Moderate) | 20 (Moderate) | 35 (Unhealthy for Sensitive Groups) | 66 (Unhealthy) | 88 (Very Unhealthy) | 41 (Unhealthy for Sensitive Groups) | 23 (Moderate) | 17 (Moderate) | 27 (Moderate) | 101 (Very Unhealthy) | 238 (Very bad Hazardous) |
| pm10 | 41 (Moderate) | 67 (Unhealthy for Sensitive Groups) | 115 (Very Unhealthy) | 193 (Very bad Hazardous) | 183 (Very bad Hazardous) | 166 (Very bad Hazardous) | 161 (Very bad Hazardous) | 74 (Unhealthy for Sensitive Groups) | 33 (Moderate) | 35 (Moderate) | 30 (Moderate) | 54 (Unhealthy for Sensitive Groups) | 34 (Moderate) | 56 (Unhealthy for Sensitive Groups) | 147 (Very Unhealthy) | 161 (Very bad Hazardous) | 86 (Unhealthy) | 47 (Moderate) | 34 (Moderate) | 59 (Unhealthy for Sensitive Groups) | 89 (Unhealthy) | 155 (Very bad Hazardous) |
| no2 | 24 (Good) | 27 (Good) | 51 (Moderate) | 52 (Moderate) | 44 (Moderate) | 44 (Moderate) | 27 (Good) | 16 (Good) | 20 (Good) | 16 (Good) | 16 (Good) | 23 (Good) | 24 (Good) | 26 (Good) | 40 (Moderate) | 36 (Good) | 26 (Good) | 18 (Good) | 16 (Good) | 24 (Good) | 34 (Good) | 49 (Moderate) |
| co | 469 (Good) | 543 (Good) | 690 (Good) | 885 (Good) | 941 (Good) | 817 (Good) | 845 (Good) | 583 (Good) | 513 (Good) | 463 (Good) | 694 (Good) | 963 (Good) | 971 (Good) | 1 (Good) | 872 (Good) | 798 (Good) | 706 (Good) | 552 (Good) | 488 (Good) | 769 (Good) | 18 (Good) | 43 (Good) |
| o3 | 35 (Good) | 30 (Good) | 27 (Good) | 26 (Good) | 25 (Good) | 28 (Good) | 29 (Good) | 25 (Good) | 16 (Good) | 15 (Good) | 17 (Good) | 19 (Good) | 29 (Good) | 33 (Good) | 30 (Good) | 28 (Good) | 34 (Good) | 17 (Good) | 15 (Good) | 44 (Good) | 45 (Good) | 29 (Good) |
| so2 | - (Good) | - (Good) | - (Good) | - (Good) | - (Good) | - (Good) | - (Good) | - (Good) | - (Good) | - (Good) | - (Good) | - (Good) | - (Good) | - (Good) | - (Good) | - (Good) | - (Good) | - (Good) | - (Good) | - (Good) | 7.8 (Good) | 8.3 (Good) |
Green and Parks in the City
Darjeeling 50%
Nepal: 32% Bangladesh: 33% Bhutan: 82% Sri Lanka: 59% Pakistan: 49%Pleasure of spending time in the city
Darjeeling 47%
Nepal: 32% Bangladesh: 26% Bhutan: 61% Sri Lanka: 52% Pakistan: 43%Air Pollution
Darjeeling 61%
Nepal: 76% Bangladesh: 78% Bhutan: 45% Sri Lanka: 53% Pakistan: 64%Garbage Disposal
Darjeeling 23%
Nepal: 25% Bangladesh: 22% Bhutan: 47% Sri Lanka: 41% Pakistan: 34%Availability and quality of drinking water
Darjeeling 53%
Nepal: 36% Bangladesh: 44% Bhutan: 64% Sri Lanka: 65% Pakistan: 44%Cleanliness and tidiness
Darjeeling 28%
Nepal: 27% Bangladesh: 23% Bhutan: 57% Sri Lanka: 52% Pakistan: 40%Noise and Light pollution
Darjeeling 61%
Nepal: 55% Bangladesh: 63% Bhutan: 55% Sri Lanka: 50% Pakistan: 59%Water Pollution
Darjeeling 65%
Nepal: 76% Bangladesh: 74% Bhutan: 56% Sri Lanka: 57% Pakistan: 70%O3 25 (Good)
ozone (O3)PM2,5 62 (Unhealthy)
particulate matter (PM2.5) dustPM10 259 (Very bad Hazardous)
particulate matter (PM10) suspended dustNO2 24 (Good)
nitrogen dioxide (NO2)CO 300 (Good)
carbon monoxide (CO)Ward-32 Bapupara, Siliguri - WBPCB
| index | 2022-10-31 |
|---|---|
| o3 | 20 |
| pm25 | 58 |
| pm10 | 293 |
| no2 | 25 |
| co | 860 |
Ward-32 Bapupara, Siliguri - WBPCB

| index | 2020-05 | 2020-04 | 2020-03 | 2020-02 | 2020-01 | 2019-12 | 2019-11 | 2019-10 | 2019-09 | 2019-08 | 2019-07 | 2019-06 | 2019-05 | 2019-04 | 2019-02 | 2018-11 | 2018-10 | 2018-09 | 2018-08 | 2018-05 | 2018-04 | 2018-03 |
|---|---|---|---|---|---|---|---|---|---|---|---|---|---|---|---|---|---|---|---|---|---|---|
| pm25 | 28 | 43 | 66 | 117 | 107 | 97 | 67 | 41 | 17 | 19 | 16 | 28 | 20 | 35 | 66 | 88 | 41 | 23 | 17 | 27 | 101 | 238 |
| pm10 | 41 | 67 | 115 | 193 | 183 | 166 | 161 | 74 | 33 | 35 | 30 | 54 | 34 | 56 | 147 | 161 | 86 | 47 | 34 | 59 | 89 | 155 |
| no2 | 24 | 27 | 51 | 52 | 44 | 44 | 27 | 16 | 20 | 16 | 16 | 23 | 24 | 26 | 40 | 36 | 26 | 18 | 16 | 24 | 34 | 49 |
| so2 | - | - | - | - | - | - | - | - | - | - | - | - | - | - | - | - | - | - | - | - | 7.8 | 8.3 |
| co | 469 | 543 | 690 | 885 | 941 | 817 | 845 | 583 | 513 | 463 | 694 | 963 | 971 | 1 | 872 | 798 | 706 | 552 | 488 | 769 | 18 | 43 |
| o3 | 35 | 30 | 27 | 26 | 25 | 28 | 29 | 25 | 16 | 15 | 17 | 19 | 29 | 33 | 30 | 28 | 34 | 17 | 15 | 44 | 45 | 29 |