Air Pollution in Dera Māndi: Real-time Air Quality Index and smog alert.
Pollution and air quality forecast for Dera Māndi. Today is Wednesday, May 13, 2026. The following air pollution values have been recorded for Dera Māndi:- carbon monoxide (CO) - 1235 (Good)
- particulate matter (PM2.5) dust - 81 (Very Unhealthy)
- particulate matter (PM10) suspended dust - 151 (Very bad Hazardous)
- nitrogen dioxide (NO2) - 32 (Good)
- ozone (O3) - 28 (Good)
- sulfur dioxide (SO2) - 18 (Good)

What is the air quality in Dera Māndi today? Is the air polluted in Dera Māndi?. Is there smog?
How high is the CO level? (carbon monoxide (CO))
1235 (Good)
What is the current level of PM2.5 in Dera Māndi? (particulate matter (PM2.5) dust)
Today's PM2.5 level is:
81 (Very Unhealthy)
For comparison, the highest level of PM2.5 in Dera Māndi in the last 7 days was: 92 (Friday, October 14, 2022) and the lowest: 6 (Monday, October 10, 2022).
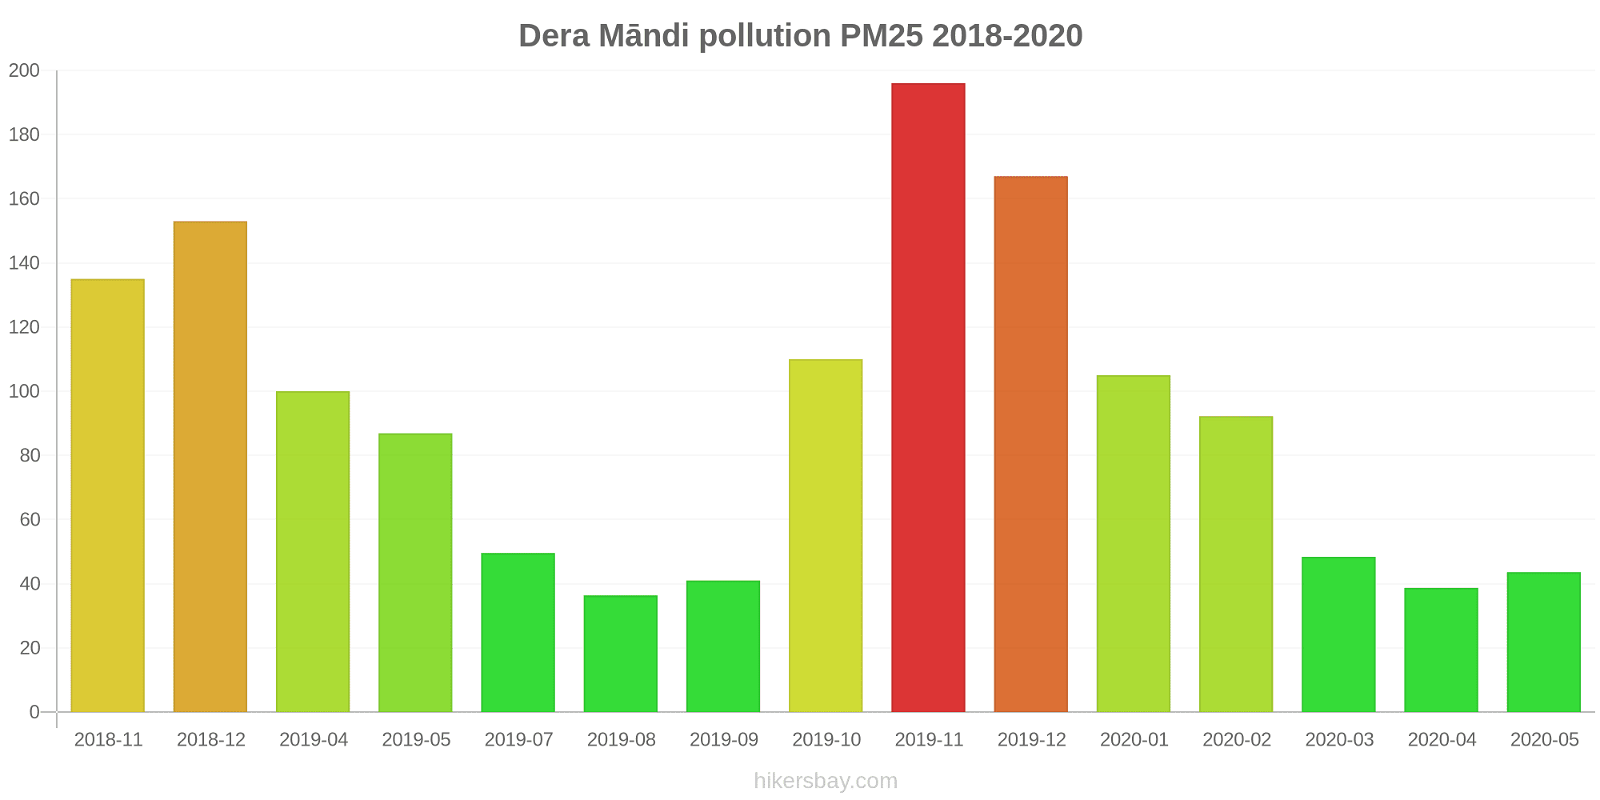
The highest PM2.5 values were recorded: 196 (November 2019).
The lowest level of particulate matter PM2.5 pollution occurs in month: August (36).
What is the level of PM10 today in Dera Māndi? (particulate matter (PM10) suspended dust)
The current level of particulate matter PM10 in Dera Māndi is:
151 (Very bad Hazardous)
The highest PM10 values usually occur in month: 294 (December 2018).
The lowest value of particulate matter PM10 pollution in Dera Māndi is usually recorded in: August (68).
How high is the level of NO2? (nitrogen dioxide (NO2))
32 (Good)
How is the O3 level today in Dera Māndi? (ozone (O3))
28 (Good)
What is the level of SO2 pollution? (sulfur dioxide (SO2))
18 (Good)
Current data Friday, October 14, 2022, 6:00 AM
CO 1235 (Good)
PM2,5 81 (Very Unhealthy)
PM10 151 (Very bad Hazardous)
NO2 32 (Good)
O3 28 (Good)
SO2 18 (Good)
Data on air pollution from recent days in Dera Māndi
index
2022-10-10
2022-10-11
2022-10-12
2022-10-13
2022-10-07
2022-10-08
2022-10-09
2022-10-14
pm25
6
Good
19
Moderate
49
Unhealthy for Sensitive Groups
49
Unhealthy for Sensitive Groups
13
Moderate
15
Moderate
20
Moderate
92
Very Unhealthy
no2
19
Good
26
Good
27
Good
34
Good
30
Good
24
Good
21
Good
53
Moderate
co
824
Good
1060
Good
1143
Good
1155
Good
291
Good
211
Good
238
Good
796
Good
pm10
20
Moderate
71
Unhealthy for Sensitive Groups
126
Very Unhealthy
142
Very Unhealthy
59
Unhealthy for Sensitive Groups
28
Moderate
29
Moderate
220
Very bad Hazardous
o3
16
Good
19
Good
19
Good
18
Good
23
Good
22
Good
18
Good
16
Good
so2
7
Good
14
Good
6
Good
9
Good
15
Good
14
Good
2
Good
13
Good
data source »
Air pollution in Dera Māndi from November 2018 to May 2020
index
2020-05
2020-04
2020-03
2020-02
2020-01
2019-12
2019-11
2019-10
2019-09
2019-08
2019-07
2019-05
2019-04
2018-12
2018-11
pm25
44 (Unhealthy for Sensitive Groups)
39 (Unhealthy for Sensitive Groups)
48 (Unhealthy for Sensitive Groups)
92 (Very Unhealthy)
105 (Very Unhealthy)
167 (Very bad Hazardous)
196 (Very bad Hazardous)
110 (Very bad Hazardous)
41 (Unhealthy for Sensitive Groups)
36 (Unhealthy for Sensitive Groups)
50 (Unhealthy for Sensitive Groups)
87 (Very Unhealthy)
100 (Very Unhealthy)
153 (Very bad Hazardous)
135 (Very bad Hazardous)
pm10
101 (Unhealthy)
91 (Unhealthy)
102 (Unhealthy)
172 (Very bad Hazardous)
163 (Very bad Hazardous)
261 (Very bad Hazardous)
267 (Very bad Hazardous)
186 (Very bad Hazardous)
80 (Unhealthy for Sensitive Groups)
68 (Unhealthy for Sensitive Groups)
88 (Unhealthy)
247 (Very bad Hazardous)
206 (Very bad Hazardous)
294 (Very bad Hazardous)
186 (Very bad Hazardous)
no2
9.2 (Good)
10 (Good)
15 (Good)
8.2 (Good)
16 (Good)
16 (Good)
22 (Good)
26 (Good)
12 (Good)
14 (Good)
560 (Very bad Hazardous)
29 (Good)
25 (Good)
87 (Moderate)
18 (Good)
co
571 (Good)
603 (Good)
1 (Good)
1 (Good)
2 (Good)
1 (Good)
1 (Good)
1 (Good)
1 (Good)
629 (Good)
616 (Good)
951 (Good)
872 (Good)
668 (Good)
730 (Good)
data source »
NISE Gwal Pahari, Gurugram - IMD
Thursday, October 13, 2022, 11:00 PM
CO 1790 (Good)
carbon monoxide (CO)
PM2,5 70 (Unhealthy)
particulate matter (PM2.5) dust
PM10 124 (Very Unhealthy)
particulate matter (PM10) suspended dust
NO2 29 (Good)
nitrogen dioxide (NO2)
Teri Gram, Gurugram - HSPCB
Friday, October 14, 2022, 6:00 AM
CO 680 (Good)
carbon monoxide (CO)
O3 28 (Good)
ozone (O3)
NO2 36 (Good)
nitrogen dioxide (NO2)
PM2,5 92 (Very Unhealthy)
particulate matter (PM2.5) dust
SO2 18 (Good)
sulfur dioxide (SO2)
PM10 178 (Very bad Hazardous)
particulate matter (PM10) suspended dust
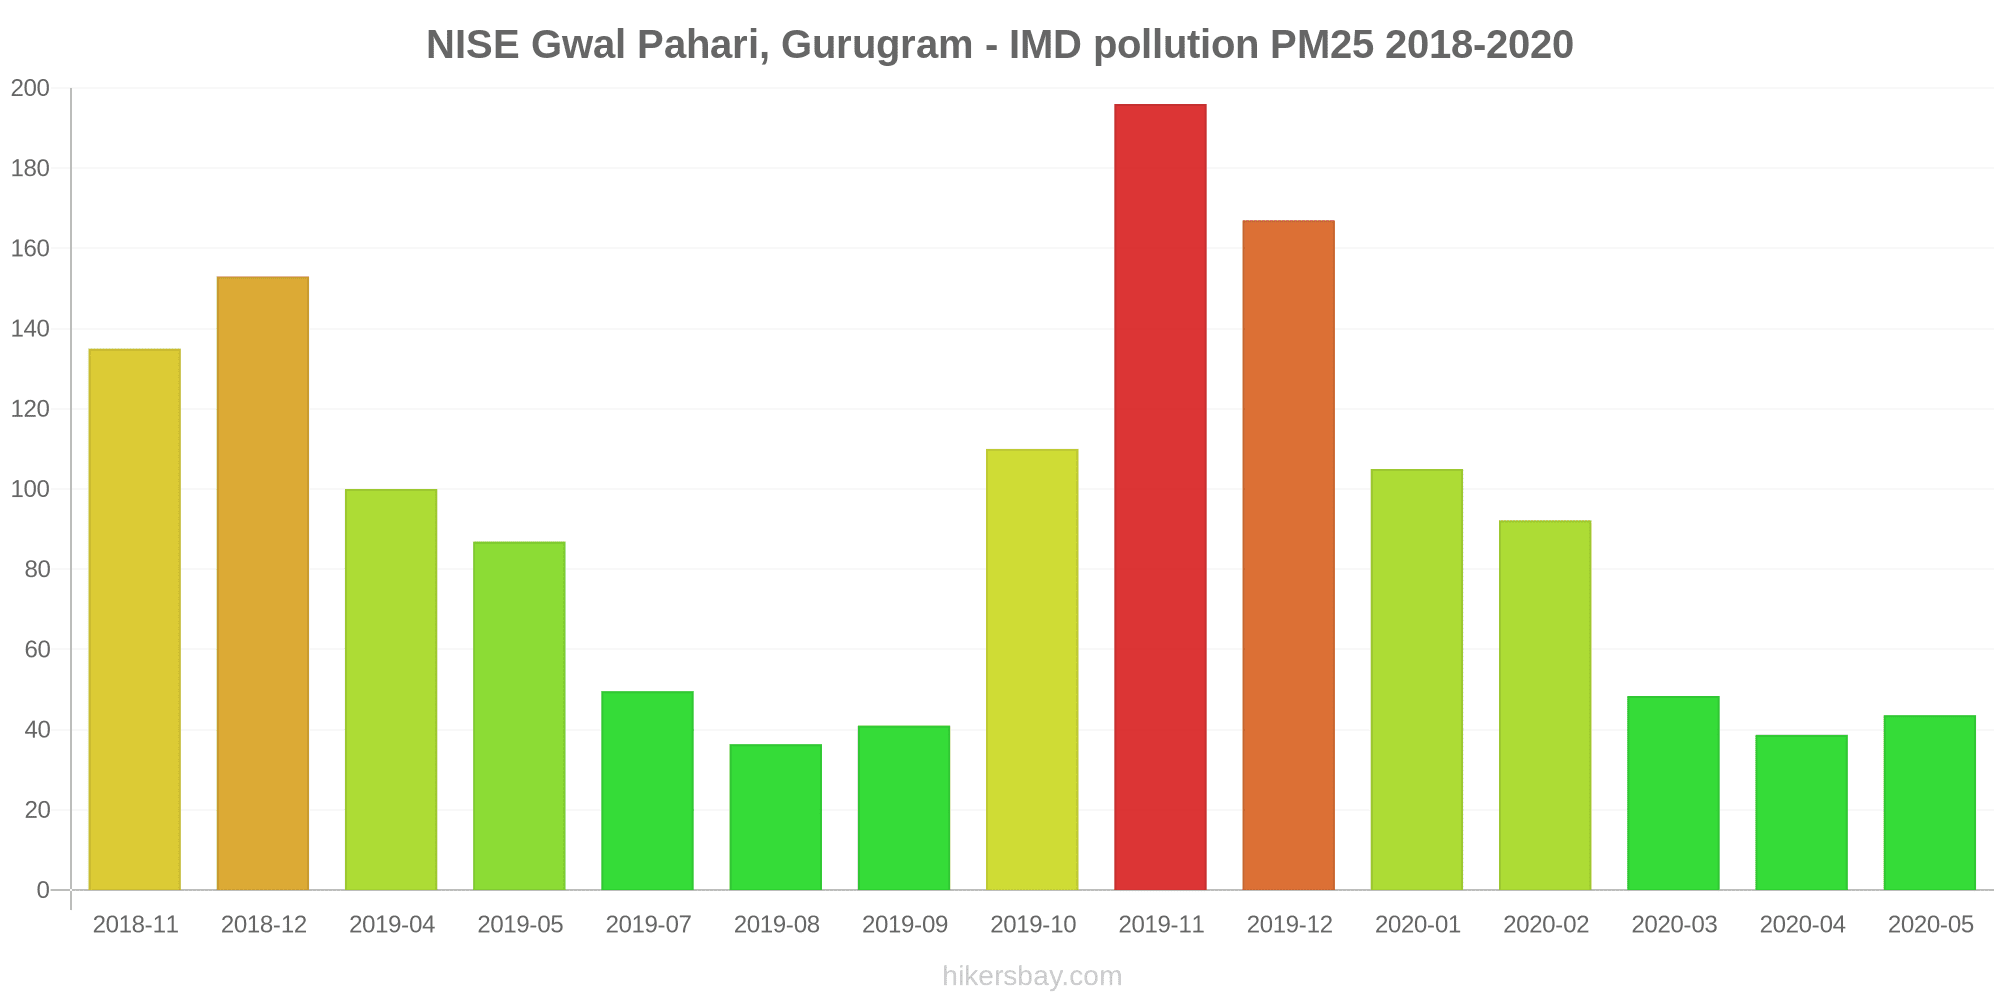
NISE Gwal Pahari, Gurugram - IMD
index
2022-10-13
2022-10-12
2022-10-11
2022-10-10
pm25
46
50
10
0
no2
24
22
16
17
co
1657
1725
1590
1390
pm10
86
91
27
0
Teri Gram, Gurugram - HSPCB
index
2022-10-14
2022-10-13
2022-10-12
2022-10-11
2022-10-10
2022-10-09
2022-10-08
2022-10-07
so2
13
8.6
5.8
14
7.4
2
14
15
pm10
220
198
162
116
39
29
28
59
no2
53
44
32
36
20
21
24
30
o3
16
18
19
19
16
18
22
23
pm25
92
53
49
28
13
20
15
13
co
796
653
560
530
257
238
211
291
NISE Gwal Pahari, Gurugram - IMD
2018-11 2020-05

index
2020-05
2020-04
2020-03
2020-02
2020-01
2019-12
2019-11
2019-10
2019-09
2019-08
2019-07
2019-05
2019-04
2018-12
2018-11
pm25
44
39
48
92
105
167
196
110
41
36
50
87
100
153
135
pm10
101
91
102
172
163
261
267
186
80
68
88
247
206
294
186
no2
9.2
10
15
8.2
16
16
22
26
12
14
560
29
25
87
18
co
571
603
1
1
2
1
1
1
1
629
616
951
872
668
730
* Pollution data source:
https://openaq.org
(caaqm)
The data is licensed under CC-By 4.0
CO 1235 (Good)
PM2,5 81 (Very Unhealthy)
PM10 151 (Very bad Hazardous)
NO2 32 (Good)
O3 28 (Good)
SO2 18 (Good)
Data on air pollution from recent days in Dera Māndi
| index | 2022-10-10 | 2022-10-11 | 2022-10-12 | 2022-10-13 | 2022-10-07 | 2022-10-08 | 2022-10-09 | 2022-10-14 |
|---|---|---|---|---|---|---|---|---|
| pm25 | 6 Good |
19 Moderate |
49 Unhealthy for Sensitive Groups |
49 Unhealthy for Sensitive Groups |
13 Moderate |
15 Moderate |
20 Moderate |
92 Very Unhealthy |
| no2 | 19 Good |
26 Good |
27 Good |
34 Good |
30 Good |
24 Good |
21 Good |
53 Moderate |
| co | 824 Good |
1060 Good |
1143 Good |
1155 Good |
291 Good |
211 Good |
238 Good |
796 Good |
| pm10 | 20 Moderate |
71 Unhealthy for Sensitive Groups |
126 Very Unhealthy |
142 Very Unhealthy |
59 Unhealthy for Sensitive Groups |
28 Moderate |
29 Moderate |
220 Very bad Hazardous |
| o3 | 16 Good |
19 Good |
19 Good |
18 Good |
23 Good |
22 Good |
18 Good |
16 Good |
| so2 | 7 Good |
14 Good |
6 Good |
9 Good |
15 Good |
14 Good |
2 Good |
13 Good |

| index | 2020-05 | 2020-04 | 2020-03 | 2020-02 | 2020-01 | 2019-12 | 2019-11 | 2019-10 | 2019-09 | 2019-08 | 2019-07 | 2019-05 | 2019-04 | 2018-12 | 2018-11 |
|---|---|---|---|---|---|---|---|---|---|---|---|---|---|---|---|
| pm25 | 44 (Unhealthy for Sensitive Groups) | 39 (Unhealthy for Sensitive Groups) | 48 (Unhealthy for Sensitive Groups) | 92 (Very Unhealthy) | 105 (Very Unhealthy) | 167 (Very bad Hazardous) | 196 (Very bad Hazardous) | 110 (Very bad Hazardous) | 41 (Unhealthy for Sensitive Groups) | 36 (Unhealthy for Sensitive Groups) | 50 (Unhealthy for Sensitive Groups) | 87 (Very Unhealthy) | 100 (Very Unhealthy) | 153 (Very bad Hazardous) | 135 (Very bad Hazardous) |
| pm10 | 101 (Unhealthy) | 91 (Unhealthy) | 102 (Unhealthy) | 172 (Very bad Hazardous) | 163 (Very bad Hazardous) | 261 (Very bad Hazardous) | 267 (Very bad Hazardous) | 186 (Very bad Hazardous) | 80 (Unhealthy for Sensitive Groups) | 68 (Unhealthy for Sensitive Groups) | 88 (Unhealthy) | 247 (Very bad Hazardous) | 206 (Very bad Hazardous) | 294 (Very bad Hazardous) | 186 (Very bad Hazardous) |
| no2 | 9.2 (Good) | 10 (Good) | 15 (Good) | 8.2 (Good) | 16 (Good) | 16 (Good) | 22 (Good) | 26 (Good) | 12 (Good) | 14 (Good) | 560 (Very bad Hazardous) | 29 (Good) | 25 (Good) | 87 (Moderate) | 18 (Good) |
| co | 571 (Good) | 603 (Good) | 1 (Good) | 1 (Good) | 2 (Good) | 1 (Good) | 1 (Good) | 1 (Good) | 1 (Good) | 629 (Good) | 616 (Good) | 951 (Good) | 872 (Good) | 668 (Good) | 730 (Good) |
CO 1790 (Good)
carbon monoxide (CO)PM2,5 70 (Unhealthy)
particulate matter (PM2.5) dustPM10 124 (Very Unhealthy)
particulate matter (PM10) suspended dustNO2 29 (Good)
nitrogen dioxide (NO2)CO 680 (Good)
carbon monoxide (CO)O3 28 (Good)
ozone (O3)NO2 36 (Good)
nitrogen dioxide (NO2)PM2,5 92 (Very Unhealthy)
particulate matter (PM2.5) dustSO2 18 (Good)
sulfur dioxide (SO2)PM10 178 (Very bad Hazardous)
particulate matter (PM10) suspended dustNISE Gwal Pahari, Gurugram - IMD
| index | 2022-10-13 | 2022-10-12 | 2022-10-11 | 2022-10-10 |
|---|---|---|---|---|
| pm25 | 46 | 50 | 10 | 0 |
| no2 | 24 | 22 | 16 | 17 |
| co | 1657 | 1725 | 1590 | 1390 |
| pm10 | 86 | 91 | 27 | 0 |
Teri Gram, Gurugram - HSPCB
| index | 2022-10-14 | 2022-10-13 | 2022-10-12 | 2022-10-11 | 2022-10-10 | 2022-10-09 | 2022-10-08 | 2022-10-07 |
|---|---|---|---|---|---|---|---|---|
| so2 | 13 | 8.6 | 5.8 | 14 | 7.4 | 2 | 14 | 15 |
| pm10 | 220 | 198 | 162 | 116 | 39 | 29 | 28 | 59 |
| no2 | 53 | 44 | 32 | 36 | 20 | 21 | 24 | 30 |
| o3 | 16 | 18 | 19 | 19 | 16 | 18 | 22 | 23 |
| pm25 | 92 | 53 | 49 | 28 | 13 | 20 | 15 | 13 |
| co | 796 | 653 | 560 | 530 | 257 | 238 | 211 | 291 |
NISE Gwal Pahari, Gurugram - IMD
| index | 2020-05 | 2020-04 | 2020-03 | 2020-02 | 2020-01 | 2019-12 | 2019-11 | 2019-10 | 2019-09 | 2019-08 | 2019-07 | 2019-05 | 2019-04 | 2018-12 | 2018-11 |
|---|---|---|---|---|---|---|---|---|---|---|---|---|---|---|---|
| pm25 | 44 | 39 | 48 | 92 | 105 | 167 | 196 | 110 | 41 | 36 | 50 | 87 | 100 | 153 | 135 |
| pm10 | 101 | 91 | 102 | 172 | 163 | 261 | 267 | 186 | 80 | 68 | 88 | 247 | 206 | 294 | 186 |
| no2 | 9.2 | 10 | 15 | 8.2 | 16 | 16 | 22 | 26 | 12 | 14 | 560 | 29 | 25 | 87 | 18 |
| co | 571 | 603 | 1 | 1 | 2 | 1 | 1 | 1 | 1 | 629 | 616 | 951 | 872 | 668 | 730 |