Air Pollution in Dewas: Real-time Air Quality Index and smog alert.
Pollution and air quality forecast for Dewas. Today is Wednesday, May 13, 2026. The following air pollution values have been recorded for Dewas:- particulate matter (PM10) suspended dust - 167 (Very bad Hazardous)
- sulfur dioxide (SO2) - 14 (Good)
- particulate matter (PM2.5) dust - 27 (Moderate)
- carbon monoxide (CO) - 810 (Good)
- nitrogen dioxide (NO2) - 38 (Good)
- ozone (O3) - 30 (Good)

What is the air quality in Dewas today? Is the air polluted in Dewas?. Is there smog?
What is the level of PM10 today in Dewas? (particulate matter (PM10) suspended dust)
The current level of particulate matter PM10 in Dewas is:
167 (Very bad Hazardous)
The highest PM10 values usually occur in month: 237 (May 2019).
The lowest value of particulate matter PM10 pollution in Dewas is usually recorded in: September (40).
What is the level of SO2 pollution? (sulfur dioxide (SO2))
14 (Good)
What is the current level of PM2.5 in Dewas? (particulate matter (PM2.5) dust)
Today's PM2.5 level is:
27 (Moderate)
For comparison, the highest level of PM2.5 in Dewas in the last 7 days was: 29 (Monday, October 31, 2022) and the lowest: 29 (Monday, October 31, 2022).
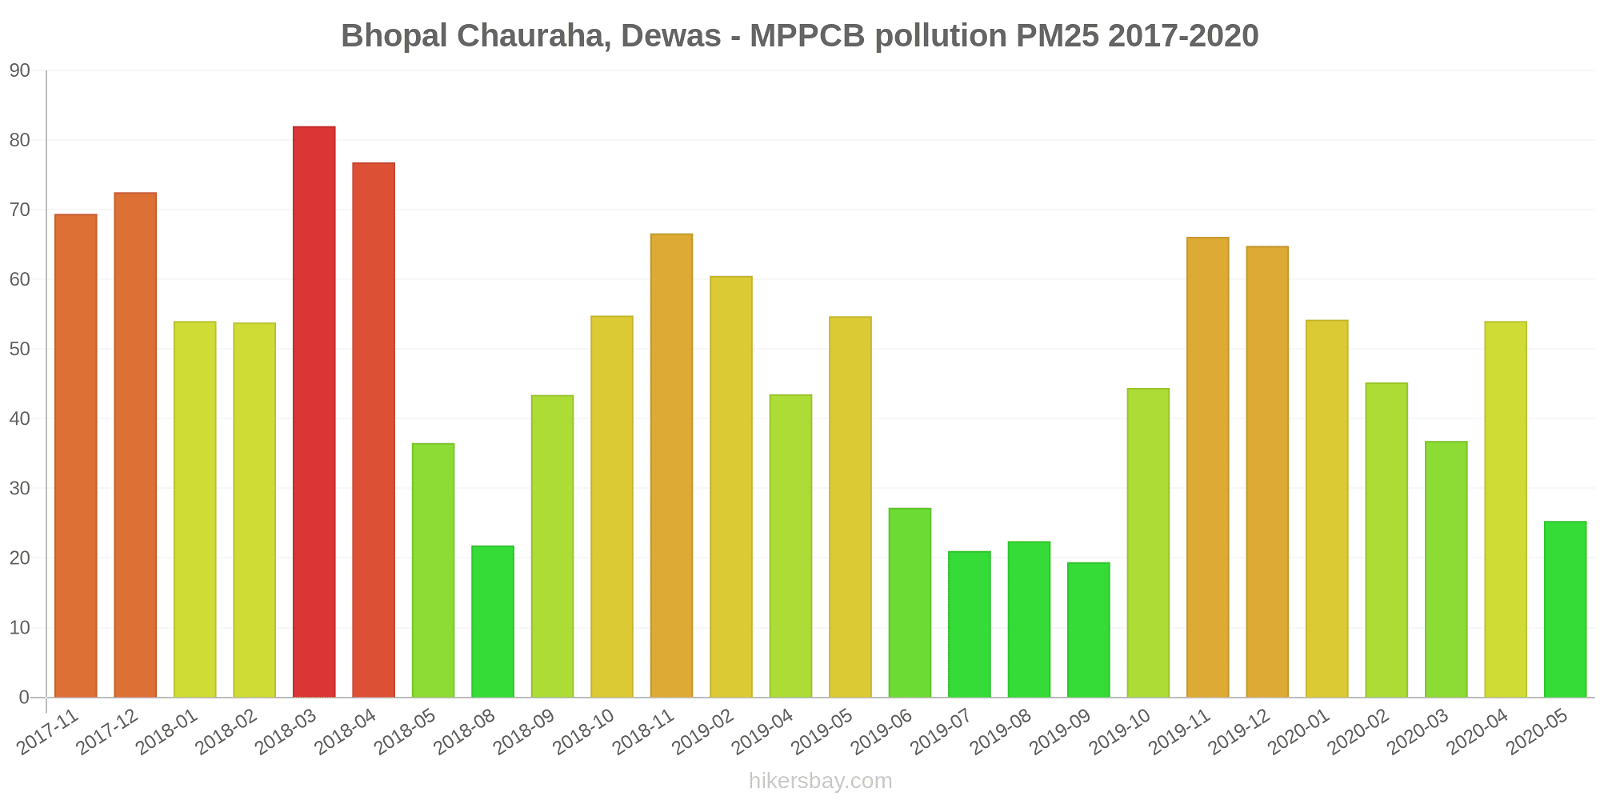
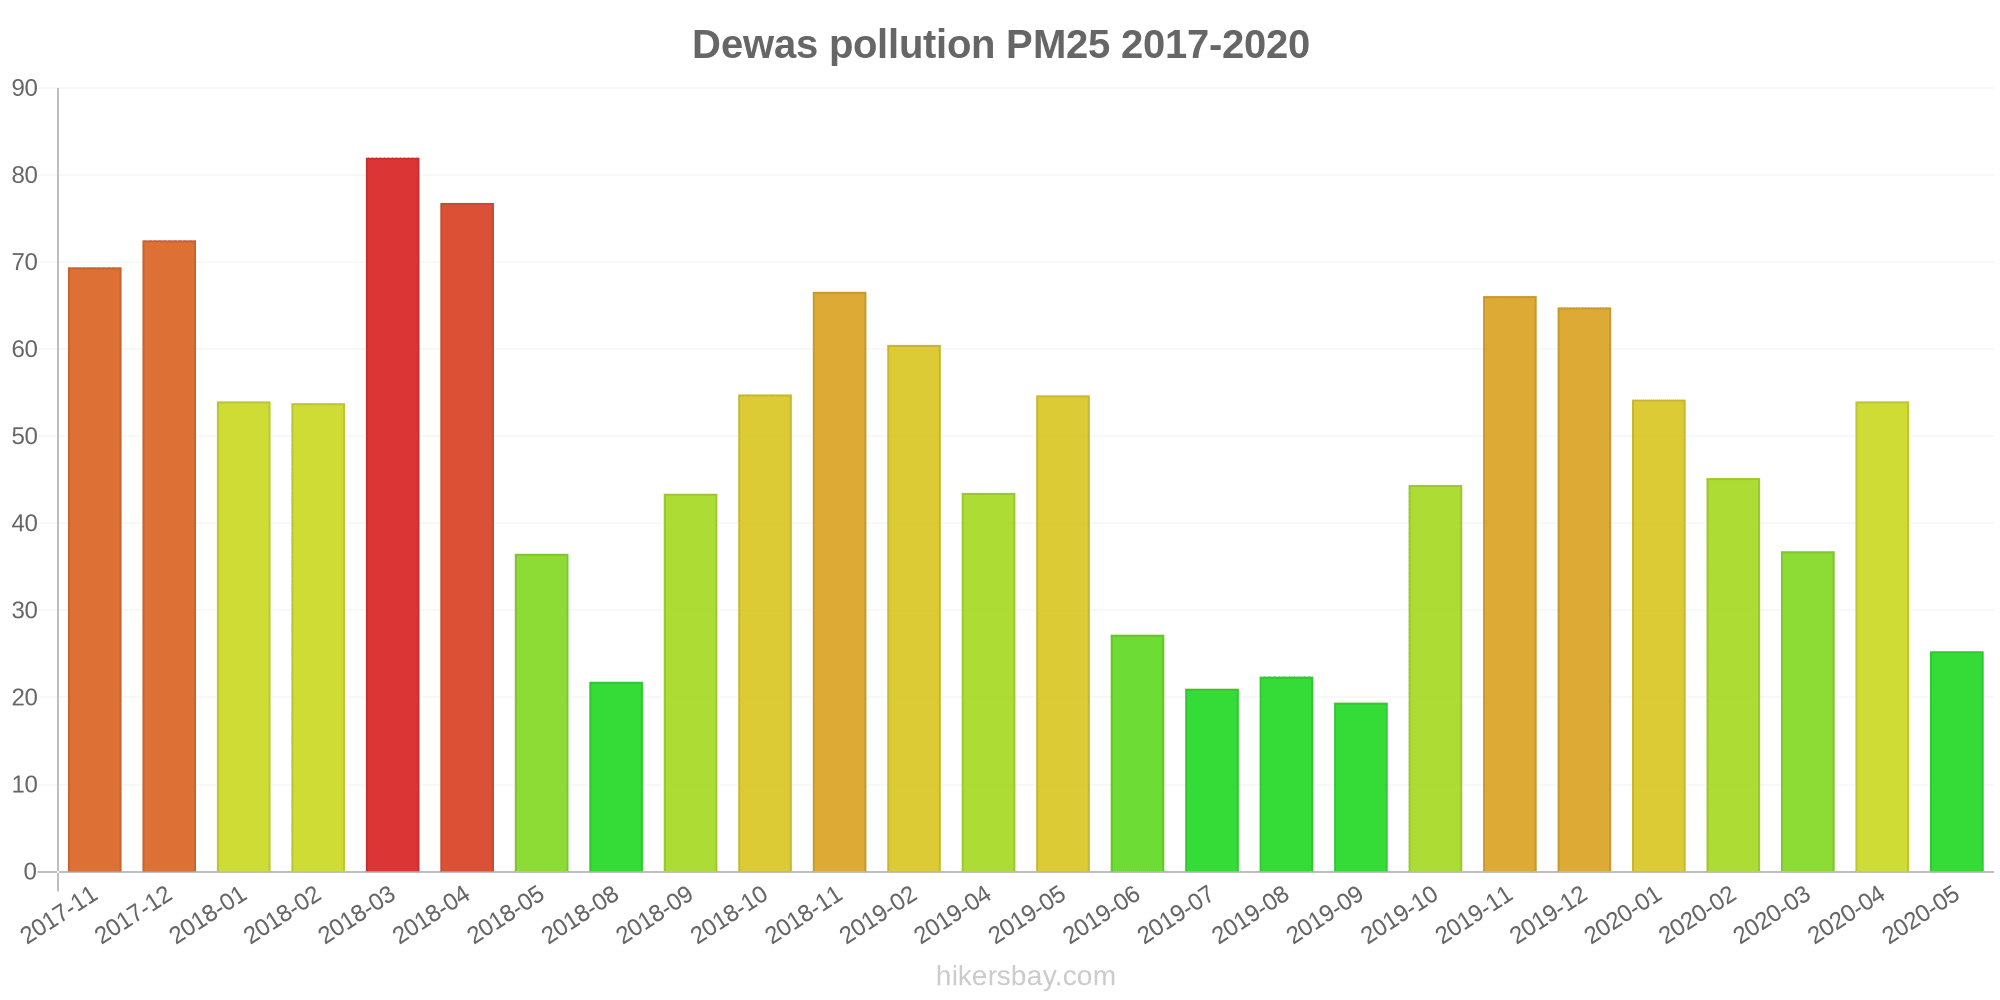
The highest PM2.5 values were recorded: 82 (March 2018).
The lowest level of particulate matter PM2.5 pollution occurs in month: September (19).
How high is the CO level? (carbon monoxide (CO))
810 (Good)
How high is the level of NO2? (nitrogen dioxide (NO2))
38 (Good)
How is the O3 level today in Dewas? (ozone (O3))
30 (Good)
Current data Monday, October 31, 2022, 2:00 AM
PM10 167 (Very bad Hazardous)
SO2 14 (Good)
PM2,5 27 (Moderate)
CO 810 (Good)
NO2 38 (Good)
O3 30 (Good)
Data on air pollution from recent days in Dewas
index
2022-10-31
pm10
166
Very bad Hazardous
so2
14
Good
pm25
29
Moderate
co
750
Good
no2
32
Good
o3
38
Good
data source »
Air pollution in Dewas from November 2017 to May 2020

index
2020-05
2020-04
2020-03
2020-02
2020-01
2019-12
2019-11
2019-10
2019-09
2019-08
2019-07
2019-06
2019-05
2019-04
2019-02
2018-11
2018-10
2018-09
2018-08
2018-05
2018-04
2018-03
2018-02
2018-01
2017-12
2017-11
pm25
25 (Moderate)
54 (Unhealthy for Sensitive Groups)
37 (Unhealthy for Sensitive Groups)
45 (Unhealthy for Sensitive Groups)
54 (Unhealthy for Sensitive Groups)
65 (Unhealthy)
66 (Unhealthy)
44 (Unhealthy for Sensitive Groups)
19 (Moderate)
22 (Moderate)
21 (Moderate)
27 (Moderate)
55 (Unhealthy for Sensitive Groups)
44 (Unhealthy for Sensitive Groups)
61 (Unhealthy)
67 (Unhealthy)
55 (Unhealthy for Sensitive Groups)
43 (Unhealthy for Sensitive Groups)
22 (Moderate)
37 (Unhealthy for Sensitive Groups)
77 (Very Unhealthy)
82 (Very Unhealthy)
54 (Unhealthy for Sensitive Groups)
54 (Unhealthy for Sensitive Groups)
73 (Unhealthy)
69 (Unhealthy)
pm10
88 (Unhealthy)
108 (Unhealthy)
111 (Very Unhealthy)
105 (Unhealthy)
103 (Unhealthy)
118 (Very Unhealthy)
120 (Very Unhealthy)
112 (Very Unhealthy)
40 (Moderate)
49 (Moderate)
57 (Unhealthy for Sensitive Groups)
65 (Unhealthy for Sensitive Groups)
237 (Very bad Hazardous)
129 (Very Unhealthy)
128 (Very Unhealthy)
137 (Very Unhealthy)
153 (Very bad Hazardous)
86 (Unhealthy)
51 (Unhealthy for Sensitive Groups)
146 (Very Unhealthy)
143 (Very Unhealthy)
119 (Very Unhealthy)
128 (Very Unhealthy)
118 (Very Unhealthy)
132 (Very Unhealthy)
135 (Very Unhealthy)
no2
9.8 (Good)
16 (Good)
23 (Good)
18 (Good)
17 (Good)
29 (Good)
33 (Good)
25 (Good)
14 (Good)
20 (Good)
13 (Good)
16 (Good)
15 (Good)
18 (Good)
34 (Good)
30 (Good)
29 (Good)
14 (Good)
11 (Good)
16 (Good)
22 (Good)
25 (Good)
26 (Good)
30 (Good)
30 (Good)
32 (Good)
so2
13 (Good)
15 (Good)
14 (Good)
8.2 (Good)
6.8 (Good)
17 (Good)
12 (Good)
12 (Good)
8.2 (Good)
15 (Good)
16 (Good)
13 (Good)
5.9 (Good)
10 (Good)
7.8 (Good)
11 (Good)
16 (Good)
6.8 (Good)
3.6 (Good)
8.2 (Good)
17 (Good)
21 (Good)
14 (Good)
9.6 (Good)
23 (Good)
21 (Good)
co
689 (Good)
1 (Good)
787 (Good)
1 (Good)
675 (Good)
664 (Good)
564 (Good)
558 (Good)
447 (Good)
386 (Good)
436 (Good)
398 (Good)
449 (Good)
429 (Good)
339 (Good)
599 (Good)
669 (Good)
531 (Good)
531 (Good)
683 (Good)
20 (Good)
34 (Good)
563 (Good)
556 (Good)
650 (Good)
877 (Good)
o3
87 (Moderate)
66 (Good)
84 (Moderate)
37 (Good)
35 (Good)
68 (Good)
94 (Moderate)
65 (Good)
35 (Good)
35 (Good)
51 (Good)
80 (Moderate)
78 (Moderate)
79 (Moderate)
20 (Good)
100 (Moderate)
70 (Moderate)
42 (Good)
26 (Good)
62 (Good)
64 (Good)
73 (Moderate)
86 (Moderate)
87 (Moderate)
73 (Moderate)
32 (Good)
data source »
Bhopal Chauraha, Dewas - MPPCB
Monday, October 31, 2022, 2:00 AM
PM10 167 (Very bad Hazardous)
particulate matter (PM10) suspended dust
SO2 14 (Good)
sulfur dioxide (SO2)
PM2,5 27 (Moderate)
particulate matter (PM2.5) dust
CO 810 (Good)
carbon monoxide (CO)
NO2 38 (Good)
nitrogen dioxide (NO2)
O3 30 (Good)
ozone (O3)
Bhopal Chauraha, Dewas - MPPCB
index
2022-10-31
pm10
166
so2
14
pm25
29
co
750
no2
32
o3
38
Bhopal Chauraha, Dewas - MPPCB
2017-11 2020-05
index
2020-05
2020-04
2020-03
2020-02
2020-01
2019-12
2019-11
2019-10
2019-09
2019-08
2019-07
2019-06
2019-05
2019-04
2019-02
2018-11
2018-10
2018-09
2018-08
2018-05
2018-04
2018-03
2018-02
2018-01
2017-12
2017-11
no2
9.8
16
23
18
17
29
33
25
14
20
13
16
15
18
34
30
29
14
11
16
22
25
26
30
30
32
so2
13
15
14
8.2
6.8
17
12
12
8.2
15
16
13
5.9
10
7.8
11
16
6.8
3.6
8.2
17
21
14
9.6
23
21
co
689
1
787
1
675
664
564
558
447
386
436
398
449
429
339
599
669
531
531
683
20
34
563
556
650
877
o3
87
66
84
37
35
68
94
65
35
35
51
80
78
79
20
100
70
42
26
62
64
73
86
87
73
32
pm25
25
54
37
45
54
65
66
44
19
22
21
27
55
44
61
67
55
43
22
37
77
82
54
54
73
69
pm10
88
108
111
105
103
118
120
112
40
49
57
65
237
129
128
137
153
86
51
146
143
119
128
118
132
135
* Pollution data source:
https://openaq.org
(caaqm)
The data is licensed under CC-By 4.0
PM10 167 (Very bad Hazardous)
SO2 14 (Good)
PM2,5 27 (Moderate)
CO 810 (Good)
NO2 38 (Good)
O3 30 (Good)
Data on air pollution from recent days in Dewas
| index | 2022-10-31 |
|---|---|
| pm10 | 166 Very bad Hazardous |
| so2 | 14 Good |
| pm25 | 29 Moderate |
| co | 750 Good |
| no2 | 32 Good |
| o3 | 38 Good |
| index | 2020-05 | 2020-04 | 2020-03 | 2020-02 | 2020-01 | 2019-12 | 2019-11 | 2019-10 | 2019-09 | 2019-08 | 2019-07 | 2019-06 | 2019-05 | 2019-04 | 2019-02 | 2018-11 | 2018-10 | 2018-09 | 2018-08 | 2018-05 | 2018-04 | 2018-03 | 2018-02 | 2018-01 | 2017-12 | 2017-11 |
|---|---|---|---|---|---|---|---|---|---|---|---|---|---|---|---|---|---|---|---|---|---|---|---|---|---|---|
| pm25 | 25 (Moderate) | 54 (Unhealthy for Sensitive Groups) | 37 (Unhealthy for Sensitive Groups) | 45 (Unhealthy for Sensitive Groups) | 54 (Unhealthy for Sensitive Groups) | 65 (Unhealthy) | 66 (Unhealthy) | 44 (Unhealthy for Sensitive Groups) | 19 (Moderate) | 22 (Moderate) | 21 (Moderate) | 27 (Moderate) | 55 (Unhealthy for Sensitive Groups) | 44 (Unhealthy for Sensitive Groups) | 61 (Unhealthy) | 67 (Unhealthy) | 55 (Unhealthy for Sensitive Groups) | 43 (Unhealthy for Sensitive Groups) | 22 (Moderate) | 37 (Unhealthy for Sensitive Groups) | 77 (Very Unhealthy) | 82 (Very Unhealthy) | 54 (Unhealthy for Sensitive Groups) | 54 (Unhealthy for Sensitive Groups) | 73 (Unhealthy) | 69 (Unhealthy) |
| pm10 | 88 (Unhealthy) | 108 (Unhealthy) | 111 (Very Unhealthy) | 105 (Unhealthy) | 103 (Unhealthy) | 118 (Very Unhealthy) | 120 (Very Unhealthy) | 112 (Very Unhealthy) | 40 (Moderate) | 49 (Moderate) | 57 (Unhealthy for Sensitive Groups) | 65 (Unhealthy for Sensitive Groups) | 237 (Very bad Hazardous) | 129 (Very Unhealthy) | 128 (Very Unhealthy) | 137 (Very Unhealthy) | 153 (Very bad Hazardous) | 86 (Unhealthy) | 51 (Unhealthy for Sensitive Groups) | 146 (Very Unhealthy) | 143 (Very Unhealthy) | 119 (Very Unhealthy) | 128 (Very Unhealthy) | 118 (Very Unhealthy) | 132 (Very Unhealthy) | 135 (Very Unhealthy) |
| no2 | 9.8 (Good) | 16 (Good) | 23 (Good) | 18 (Good) | 17 (Good) | 29 (Good) | 33 (Good) | 25 (Good) | 14 (Good) | 20 (Good) | 13 (Good) | 16 (Good) | 15 (Good) | 18 (Good) | 34 (Good) | 30 (Good) | 29 (Good) | 14 (Good) | 11 (Good) | 16 (Good) | 22 (Good) | 25 (Good) | 26 (Good) | 30 (Good) | 30 (Good) | 32 (Good) |
| so2 | 13 (Good) | 15 (Good) | 14 (Good) | 8.2 (Good) | 6.8 (Good) | 17 (Good) | 12 (Good) | 12 (Good) | 8.2 (Good) | 15 (Good) | 16 (Good) | 13 (Good) | 5.9 (Good) | 10 (Good) | 7.8 (Good) | 11 (Good) | 16 (Good) | 6.8 (Good) | 3.6 (Good) | 8.2 (Good) | 17 (Good) | 21 (Good) | 14 (Good) | 9.6 (Good) | 23 (Good) | 21 (Good) |
| co | 689 (Good) | 1 (Good) | 787 (Good) | 1 (Good) | 675 (Good) | 664 (Good) | 564 (Good) | 558 (Good) | 447 (Good) | 386 (Good) | 436 (Good) | 398 (Good) | 449 (Good) | 429 (Good) | 339 (Good) | 599 (Good) | 669 (Good) | 531 (Good) | 531 (Good) | 683 (Good) | 20 (Good) | 34 (Good) | 563 (Good) | 556 (Good) | 650 (Good) | 877 (Good) |
| o3 | 87 (Moderate) | 66 (Good) | 84 (Moderate) | 37 (Good) | 35 (Good) | 68 (Good) | 94 (Moderate) | 65 (Good) | 35 (Good) | 35 (Good) | 51 (Good) | 80 (Moderate) | 78 (Moderate) | 79 (Moderate) | 20 (Good) | 100 (Moderate) | 70 (Moderate) | 42 (Good) | 26 (Good) | 62 (Good) | 64 (Good) | 73 (Moderate) | 86 (Moderate) | 87 (Moderate) | 73 (Moderate) | 32 (Good) |
PM10 167 (Very bad Hazardous)
particulate matter (PM10) suspended dustSO2 14 (Good)
sulfur dioxide (SO2)PM2,5 27 (Moderate)
particulate matter (PM2.5) dustCO 810 (Good)
carbon monoxide (CO)NO2 38 (Good)
nitrogen dioxide (NO2)O3 30 (Good)
ozone (O3)Bhopal Chauraha, Dewas - MPPCB
| index | 2022-10-31 |
|---|---|
| pm10 | 166 |
| so2 | 14 |
| pm25 | 29 |
| co | 750 |
| no2 | 32 |
| o3 | 38 |
Bhopal Chauraha, Dewas - MPPCB

| index | 2020-05 | 2020-04 | 2020-03 | 2020-02 | 2020-01 | 2019-12 | 2019-11 | 2019-10 | 2019-09 | 2019-08 | 2019-07 | 2019-06 | 2019-05 | 2019-04 | 2019-02 | 2018-11 | 2018-10 | 2018-09 | 2018-08 | 2018-05 | 2018-04 | 2018-03 | 2018-02 | 2018-01 | 2017-12 | 2017-11 |
|---|---|---|---|---|---|---|---|---|---|---|---|---|---|---|---|---|---|---|---|---|---|---|---|---|---|---|
| no2 | 9.8 | 16 | 23 | 18 | 17 | 29 | 33 | 25 | 14 | 20 | 13 | 16 | 15 | 18 | 34 | 30 | 29 | 14 | 11 | 16 | 22 | 25 | 26 | 30 | 30 | 32 |
| so2 | 13 | 15 | 14 | 8.2 | 6.8 | 17 | 12 | 12 | 8.2 | 15 | 16 | 13 | 5.9 | 10 | 7.8 | 11 | 16 | 6.8 | 3.6 | 8.2 | 17 | 21 | 14 | 9.6 | 23 | 21 |
| co | 689 | 1 | 787 | 1 | 675 | 664 | 564 | 558 | 447 | 386 | 436 | 398 | 449 | 429 | 339 | 599 | 669 | 531 | 531 | 683 | 20 | 34 | 563 | 556 | 650 | 877 |
| o3 | 87 | 66 | 84 | 37 | 35 | 68 | 94 | 65 | 35 | 35 | 51 | 80 | 78 | 79 | 20 | 100 | 70 | 42 | 26 | 62 | 64 | 73 | 86 | 87 | 73 | 32 |
| pm25 | 25 | 54 | 37 | 45 | 54 | 65 | 66 | 44 | 19 | 22 | 21 | 27 | 55 | 44 | 61 | 67 | 55 | 43 | 22 | 37 | 77 | 82 | 54 | 54 | 73 | 69 |
| pm10 | 88 | 108 | 111 | 105 | 103 | 118 | 120 | 112 | 40 | 49 | 57 | 65 | 237 | 129 | 128 | 137 | 153 | 86 | 51 | 146 | 143 | 119 | 128 | 118 | 132 | 135 |