Air Pollution in Dharwad: Real-time Air Quality Index and smog alert.
Pollution and air quality forecast for Dharwad. Today is Wednesday, May 13, 2026. The following air pollution values have been recorded for Dharwad:- particulate matter (PM10) suspended dust - 77 (Unhealthy for Sensitive Groups)
- particulate matter (PM2.5) dust - 43 (Unhealthy for Sensitive Groups)
- nitrogen dioxide (NO2) - 7 (Good)
- carbon monoxide (CO) - 1430 (Good)
- ozone (O3) - 48 (Good)
- sulfur dioxide (SO2) - 97 (Moderate)

What is the air quality in Dharwad today? Is the air polluted in Dharwad?. Is there smog?
What is the level of PM10 today in Dharwad? (particulate matter (PM10) suspended dust)
The current level of particulate matter PM10 in Dharwad is:
77 (Unhealthy for Sensitive Groups)
The highest PM10 values usually occur in month: 117 (May 2019).
The lowest value of particulate matter PM10 pollution in Dharwad is usually recorded in: August (42).
What is the current level of PM2.5 in Dharwad? (particulate matter (PM2.5) dust)
Today's PM2.5 level is:
43 (Unhealthy for Sensitive Groups)
For comparison, the highest level of PM2.5 in Dharwad in the last 7 days was: 41 (Monday, October 31, 2022) and the lowest: 41 (Monday, October 31, 2022).
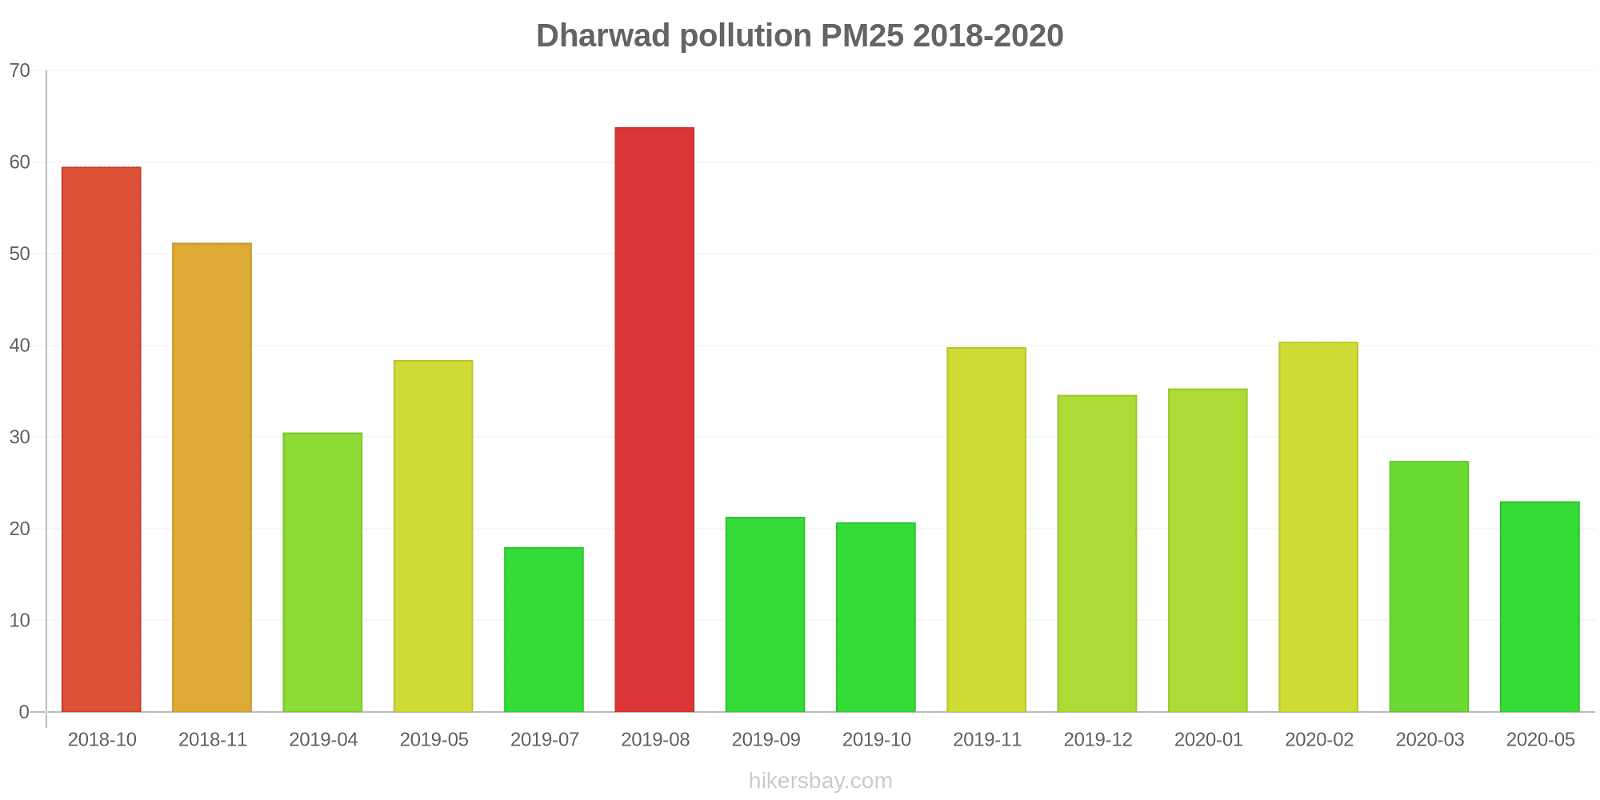
The highest PM2.5 values were recorded: 64 (August 2019).
The lowest level of particulate matter PM2.5 pollution occurs in month: July (18).
How high is the level of NO2? (nitrogen dioxide (NO2))
7 (Good)
How high is the CO level? (carbon monoxide (CO))
1430 (Good)
How is the O3 level today in Dharwad? (ozone (O3))
48 (Good)
What is the level of SO2 pollution? (sulfur dioxide (SO2))
97 (Moderate)
Current data Monday, October 31, 2022, 2:00 AM
PM10 77 (Unhealthy for Sensitive Groups)
PM2,5 43 (Unhealthy for Sensitive Groups)
NO2 7 (Good)
CO 1430 (Good)
O3 48 (Good)
SO2 97 (Moderate)
Data on air pollution from recent days in Dharwad
index
2022-10-27
2022-10-31
so2
97
Moderate
-
Good
pm10
-
Good
71
Unhealthy for Sensitive Groups
pm25
-
Good
41
Unhealthy for Sensitive Groups
no2
-
Good
6
Good
co
-
Good
1395
Good
o3
-
Good
47
Good
data source »
Air pollution in Dharwad from October 2018 to May 2020
index
2020-05
2020-03
2020-02
2020-01
2019-12
2019-11
2019-10
2019-09
2019-08
2019-07
2019-05
2019-04
2018-11
2018-10
pm25
23 (Moderate)
27 (Moderate)
40 (Unhealthy for Sensitive Groups)
35 (Unhealthy for Sensitive Groups)
35 (Moderate)
40 (Unhealthy for Sensitive Groups)
21 (Moderate)
21 (Moderate)
64 (Unhealthy)
18 (Moderate)
38 (Unhealthy for Sensitive Groups)
31 (Moderate)
51 (Unhealthy for Sensitive Groups)
60 (Unhealthy)
pm10
44 (Moderate)
80 (Unhealthy for Sensitive Groups)
100 (Unhealthy)
101 (Unhealthy)
79 (Unhealthy for Sensitive Groups)
110 (Very Unhealthy)
81 (Unhealthy)
80 (Unhealthy)
42 (Moderate)
59 (Unhealthy for Sensitive Groups)
117 (Very Unhealthy)
82 (Unhealthy)
114 (Very Unhealthy)
94 (Unhealthy)
no2
12 (Good)
28 (Good)
37 (Good)
35 (Good)
29 (Good)
24 (Good)
22 (Good)
12 (Good)
15 (Good)
15 (Good)
11 (Good)
17 (Good)
35 (Good)
28 (Good)
so2
3 (Good)
3.5 (Good)
4.4 (Good)
3 (Good)
4.2 (Good)
24 (Good)
28 (Good)
26 (Good)
25 (Good)
22 (Good)
22 (Good)
23 (Good)
- (Good)
12 (Good)
co
209 (Good)
399 (Good)
521 (Good)
428 (Good)
383 (Good)
420 (Good)
349 (Good)
290 (Good)
300 (Good)
338 (Good)
184 (Good)
364 (Good)
601 (Good)
465 (Good)
o3
1.3 (Good)
1.3 (Good)
41 (Good)
0.89 (Good)
0.95 (Good)
0.92 (Good)
3.9 (Good)
12 (Good)
12 (Good)
11 (Good)
20 (Good)
40 (Good)
40 (Good)
41 (Good)
data source »
Quality of life in Dharwad
Green and Parks in the City
Dharwad
33%
Nepal: 32%
Bangladesh: 33%
Bhutan: 82%
Sri Lanka: 59%
Pakistan: 49%
Pleasure of spending time in the city
Dharwad
39%
Nepal: 32%
Bangladesh: 26%
Bhutan: 61%
Sri Lanka: 52%
Pakistan: 43%
Air Pollution
Dharwad
74%
Nepal: 76%
Bangladesh: 78%
Bhutan: 45%
Sri Lanka: 53%
Pakistan: 64%
Garbage Disposal
Dharwad
29%
Nepal: 25%
Bangladesh: 22%
Bhutan: 47%
Sri Lanka: 41%
Pakistan: 34%
Availability and quality of drinking water
Dharwad
39%
Nepal: 36%
Bangladesh: 44%
Bhutan: 64%
Sri Lanka: 65%
Pakistan: 44%
Cleanliness and tidiness
Dharwad
28%
Nepal: 27%
Bangladesh: 23%
Bhutan: 57%
Sri Lanka: 52%
Pakistan: 40%
Noise and Light pollution
Dharwad
72%
Nepal: 55%
Bangladesh: 63%
Bhutan: 55%
Sri Lanka: 50%
Pakistan: 59%
Water Pollution
Dharwad
71%
Nepal: 76%
Bangladesh: 74%
Bhutan: 56%
Sri Lanka: 57%
Pakistan: 70%
Source: Numbeo
Deshpande Nagar, Hubballi - KSPCB
Monday, October 31, 2022, 2:00 AM
PM10 77 (Unhealthy for Sensitive Groups)
particulate matter (PM10) suspended dust
PM2,5 43 (Unhealthy for Sensitive Groups)
particulate matter (PM2.5) dust
NO2 6.8 (Good)
nitrogen dioxide (NO2)
CO 1430 (Good)
carbon monoxide (CO)
O3 48 (Good)
ozone (O3)
SO2 97 (Moderate)
sulfur dioxide (SO2)
Deshpande Nagar, Hubballi - KSPCB
index
2022-10-31
2022-10-27
so2
-
97
pm10
71
-
pm25
41
-
no2
5.9
-
co
1395
-
o3
47
-
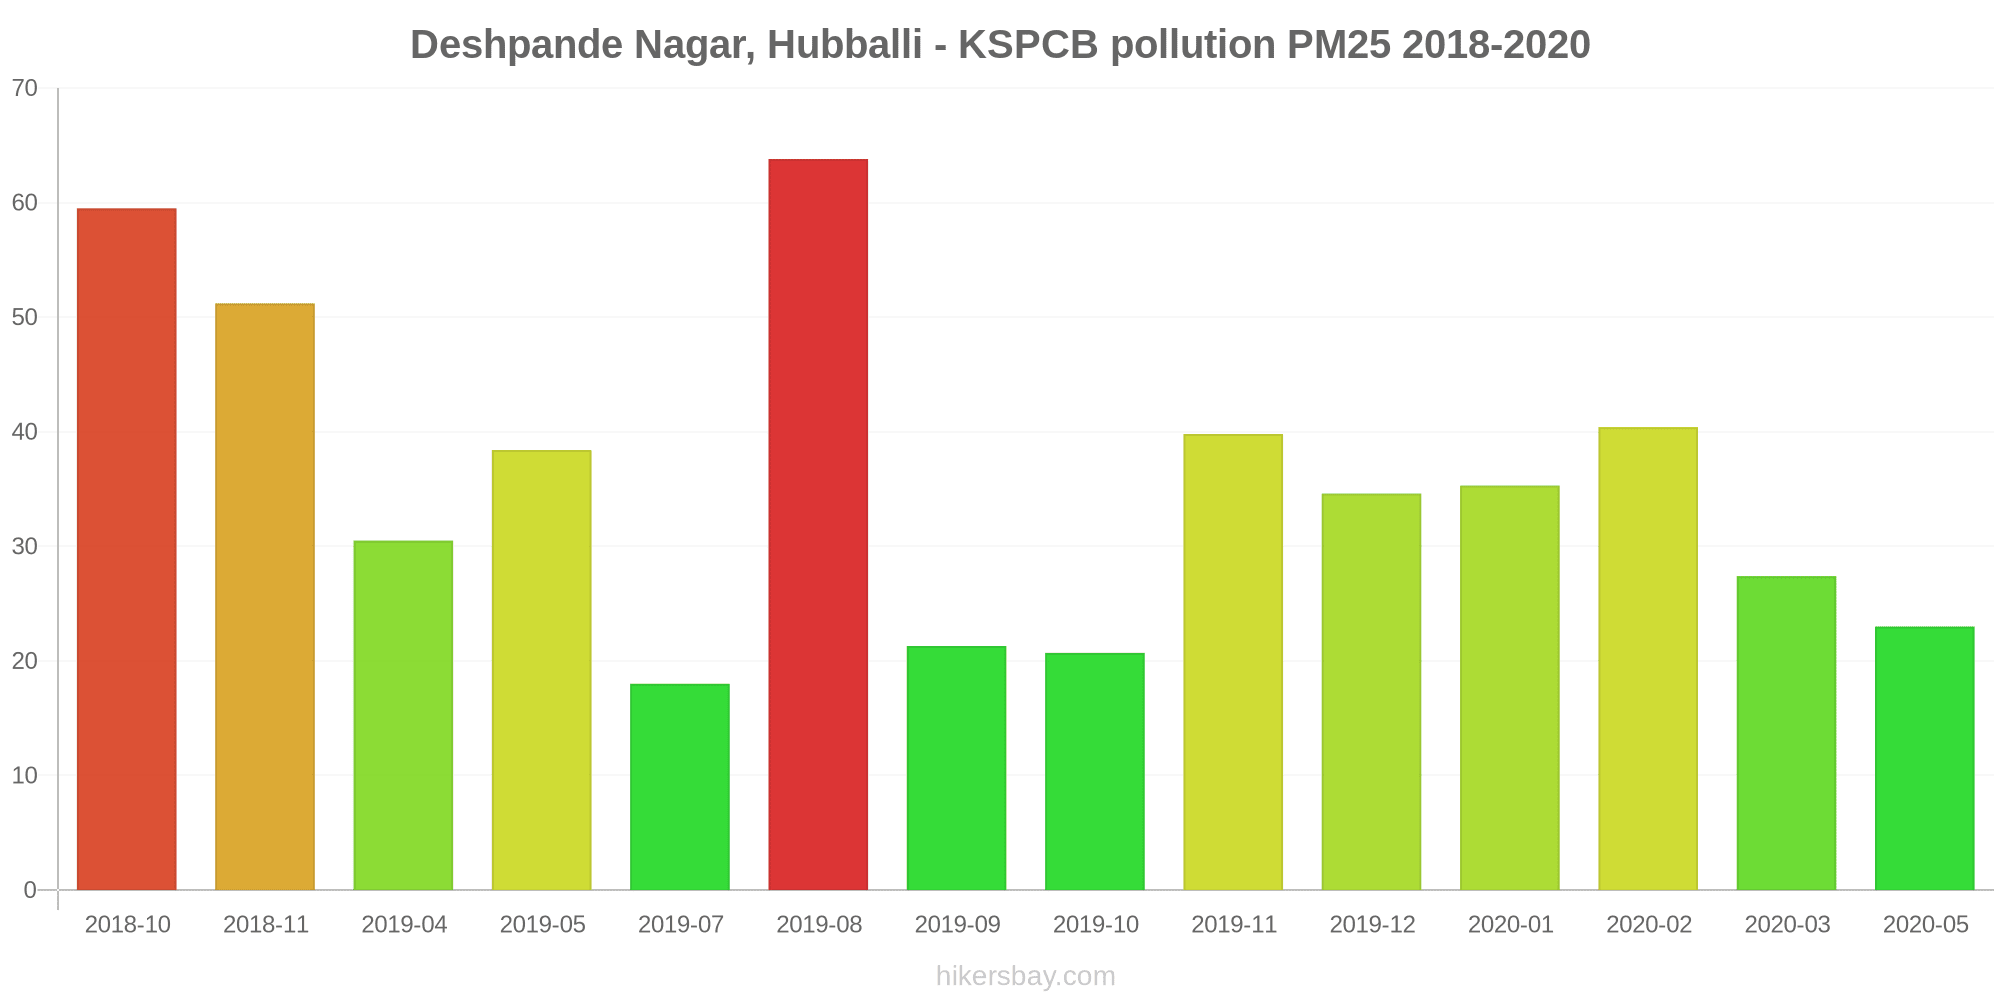
Deshpande Nagar, Hubballi - KSPCB
2018-10 2020-05

index
2020-05
2020-03
2020-02
2020-01
2019-12
2019-11
2019-10
2019-09
2019-08
2019-07
2019-05
2019-04
2018-11
2018-10
pm25
23
27
40
35
35
40
21
21
64
18
38
31
51
60
pm10
44
80
100
101
79
110
81
80
42
59
117
82
114
94
no2
12
28
37
35
29
24
22
12
15
15
11
17
35
28
so2
3
3.5
4.4
3
4.2
24
28
26
25
22
22
23
-
12
co
209
399
521
428
383
420
349
290
300
338
184
364
601
465
o3
1.3
1.3
41
0.89
0.95
0.92
3.9
12
12
11
20
40
40
41
* Pollution data source:
https://openaq.org
(caaqm)
The data is licensed under CC-By 4.0
PM10 77 (Unhealthy for Sensitive Groups)
PM2,5 43 (Unhealthy for Sensitive Groups)
NO2 7 (Good)
CO 1430 (Good)
O3 48 (Good)
SO2 97 (Moderate)
Data on air pollution from recent days in Dharwad
| index | 2022-10-27 | 2022-10-31 |
|---|---|---|
| so2 | 97 Moderate |
- Good |
| pm10 | - Good |
71 Unhealthy for Sensitive Groups |
| pm25 | - Good |
41 Unhealthy for Sensitive Groups |
| no2 | - Good |
6 Good |
| co | - Good |
1395 Good |
| o3 | - Good |
47 Good |

| index | 2020-05 | 2020-03 | 2020-02 | 2020-01 | 2019-12 | 2019-11 | 2019-10 | 2019-09 | 2019-08 | 2019-07 | 2019-05 | 2019-04 | 2018-11 | 2018-10 |
|---|---|---|---|---|---|---|---|---|---|---|---|---|---|---|
| pm25 | 23 (Moderate) | 27 (Moderate) | 40 (Unhealthy for Sensitive Groups) | 35 (Unhealthy for Sensitive Groups) | 35 (Moderate) | 40 (Unhealthy for Sensitive Groups) | 21 (Moderate) | 21 (Moderate) | 64 (Unhealthy) | 18 (Moderate) | 38 (Unhealthy for Sensitive Groups) | 31 (Moderate) | 51 (Unhealthy for Sensitive Groups) | 60 (Unhealthy) |
| pm10 | 44 (Moderate) | 80 (Unhealthy for Sensitive Groups) | 100 (Unhealthy) | 101 (Unhealthy) | 79 (Unhealthy for Sensitive Groups) | 110 (Very Unhealthy) | 81 (Unhealthy) | 80 (Unhealthy) | 42 (Moderate) | 59 (Unhealthy for Sensitive Groups) | 117 (Very Unhealthy) | 82 (Unhealthy) | 114 (Very Unhealthy) | 94 (Unhealthy) |
| no2 | 12 (Good) | 28 (Good) | 37 (Good) | 35 (Good) | 29 (Good) | 24 (Good) | 22 (Good) | 12 (Good) | 15 (Good) | 15 (Good) | 11 (Good) | 17 (Good) | 35 (Good) | 28 (Good) |
| so2 | 3 (Good) | 3.5 (Good) | 4.4 (Good) | 3 (Good) | 4.2 (Good) | 24 (Good) | 28 (Good) | 26 (Good) | 25 (Good) | 22 (Good) | 22 (Good) | 23 (Good) | - (Good) | 12 (Good) |
| co | 209 (Good) | 399 (Good) | 521 (Good) | 428 (Good) | 383 (Good) | 420 (Good) | 349 (Good) | 290 (Good) | 300 (Good) | 338 (Good) | 184 (Good) | 364 (Good) | 601 (Good) | 465 (Good) |
| o3 | 1.3 (Good) | 1.3 (Good) | 41 (Good) | 0.89 (Good) | 0.95 (Good) | 0.92 (Good) | 3.9 (Good) | 12 (Good) | 12 (Good) | 11 (Good) | 20 (Good) | 40 (Good) | 40 (Good) | 41 (Good) |
Green and Parks in the City
Dharwad 33%
Nepal: 32% Bangladesh: 33% Bhutan: 82% Sri Lanka: 59% Pakistan: 49%Pleasure of spending time in the city
Dharwad 39%
Nepal: 32% Bangladesh: 26% Bhutan: 61% Sri Lanka: 52% Pakistan: 43%Air Pollution
Dharwad 74%
Nepal: 76% Bangladesh: 78% Bhutan: 45% Sri Lanka: 53% Pakistan: 64%Garbage Disposal
Dharwad 29%
Nepal: 25% Bangladesh: 22% Bhutan: 47% Sri Lanka: 41% Pakistan: 34%Availability and quality of drinking water
Dharwad 39%
Nepal: 36% Bangladesh: 44% Bhutan: 64% Sri Lanka: 65% Pakistan: 44%Cleanliness and tidiness
Dharwad 28%
Nepal: 27% Bangladesh: 23% Bhutan: 57% Sri Lanka: 52% Pakistan: 40%Noise and Light pollution
Dharwad 72%
Nepal: 55% Bangladesh: 63% Bhutan: 55% Sri Lanka: 50% Pakistan: 59%Water Pollution
Dharwad 71%
Nepal: 76% Bangladesh: 74% Bhutan: 56% Sri Lanka: 57% Pakistan: 70%PM10 77 (Unhealthy for Sensitive Groups)
particulate matter (PM10) suspended dustPM2,5 43 (Unhealthy for Sensitive Groups)
particulate matter (PM2.5) dustNO2 6.8 (Good)
nitrogen dioxide (NO2)CO 1430 (Good)
carbon monoxide (CO)O3 48 (Good)
ozone (O3)SO2 97 (Moderate)
sulfur dioxide (SO2)Deshpande Nagar, Hubballi - KSPCB
| index | 2022-10-31 | 2022-10-27 |
|---|---|---|
| so2 | - | 97 |
| pm10 | 71 | - |
| pm25 | 41 | - |
| no2 | 5.9 | - |
| co | 1395 | - |
| o3 | 47 | - |
Deshpande Nagar, Hubballi - KSPCB
| index | 2020-05 | 2020-03 | 2020-02 | 2020-01 | 2019-12 | 2019-11 | 2019-10 | 2019-09 | 2019-08 | 2019-07 | 2019-05 | 2019-04 | 2018-11 | 2018-10 |
|---|---|---|---|---|---|---|---|---|---|---|---|---|---|---|
| pm25 | 23 | 27 | 40 | 35 | 35 | 40 | 21 | 21 | 64 | 18 | 38 | 31 | 51 | 60 |
| pm10 | 44 | 80 | 100 | 101 | 79 | 110 | 81 | 80 | 42 | 59 | 117 | 82 | 114 | 94 |
| no2 | 12 | 28 | 37 | 35 | 29 | 24 | 22 | 12 | 15 | 15 | 11 | 17 | 35 | 28 |
| so2 | 3 | 3.5 | 4.4 | 3 | 4.2 | 24 | 28 | 26 | 25 | 22 | 22 | 23 | - | 12 |
| co | 209 | 399 | 521 | 428 | 383 | 420 | 349 | 290 | 300 | 338 | 184 | 364 | 601 | 465 |
| o3 | 1.3 | 1.3 | 41 | 0.89 | 0.95 | 0.92 | 3.9 | 12 | 12 | 11 | 20 | 40 | 40 | 41 |