Air Pollution in East Godavari: Real-time Air Quality Index and smog alert.
Pollution and air quality forecast for East Godavari. Today is Wednesday, May 13, 2026. The following air pollution values have been recorded for East Godavari:- particulate matter (PM10) suspended dust - 86 (Unhealthy)
- sulfur dioxide (SO2) - 3 (Good)
- particulate matter (PM2.5) dust - 52 (Unhealthy for Sensitive Groups)
- carbon monoxide (CO) - 540 (Good)
- nitrogen dioxide (NO2) - 12 (Good)
- ozone (O3) - 4 (Good)

What is the air quality in East Godavari today? Is the air polluted in East Godavari?. Is there smog?
What is the level of PM10 today in East Godavari? (particulate matter (PM10) suspended dust)
The current level of particulate matter PM10 in East Godavari is:
86 (Unhealthy)
The highest PM10 values usually occur in month: 133 (February 2019).
The lowest value of particulate matter PM10 pollution in East Godavari is usually recorded in: September (29).
What is the level of SO2 pollution? (sulfur dioxide (SO2))
3 (Good)
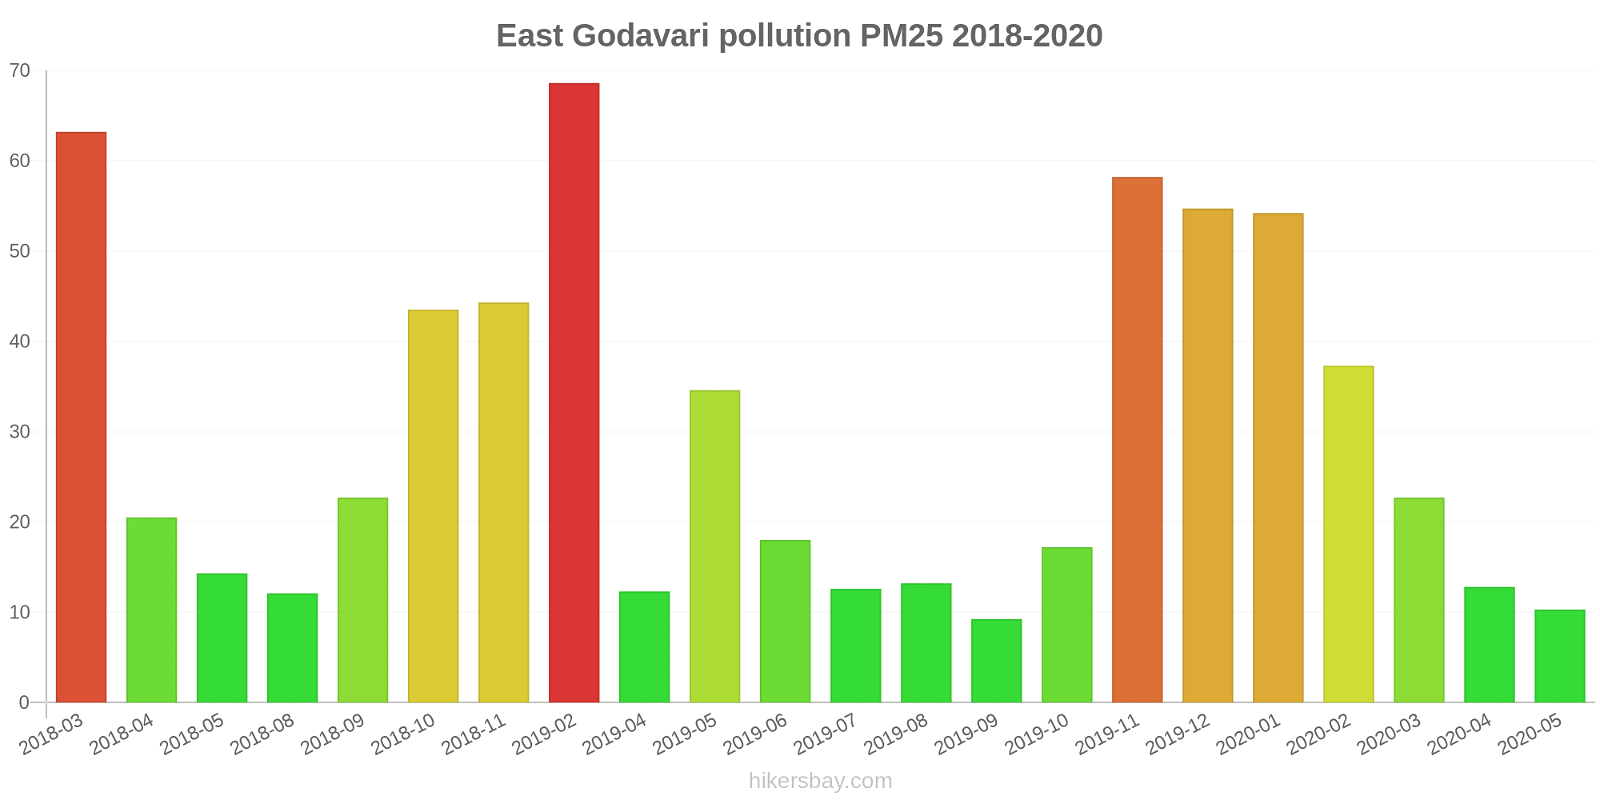
What is the current level of PM2.5 in East Godavari? (particulate matter (PM2.5) dust)
Today's PM2.5 level is:
52 (Unhealthy for Sensitive Groups)
For comparison, the highest level of PM2.5 in East Godavari in the last 7 days was: 50 (Monday, October 31, 2022) and the lowest: 50 (Monday, October 31, 2022).
The highest PM2.5 values were recorded: 69 (February 2019).
The lowest level of particulate matter PM2.5 pollution occurs in month: September (9.3).
How high is the CO level? (carbon monoxide (CO))
540 (Good)
How high is the level of NO2? (nitrogen dioxide (NO2))
12 (Good)
How is the O3 level today in East Godavari? (ozone (O3))
4 (Good)
Current data Monday, October 31, 2022, 2:00 AM
PM10 86 (Unhealthy)
SO2 3 (Good)
PM2,5 52 (Unhealthy for Sensitive Groups)
CO 540 (Good)
NO2 12 (Good)
O3 4 (Good)
Data on air pollution from recent days in East Godavari
index
2022-10-31
pm10
82
Unhealthy
so2
3
Good
pm25
50
Unhealthy for Sensitive Groups
co
280
Good
no2
11
Good
o3
4
Good
data source »
Air pollution in East Godavari from March 2018 to May 2020
index
2020-05
2020-04
2020-03
2020-02
2020-01
2019-12
2019-11
2019-10
2019-09
2019-08
2019-07
2019-06
2019-05
2019-04
2019-02
2018-11
2018-10
2018-09
2018-08
2018-05
2018-04
2018-03
pm25
10 (Good)
13 (Good)
23 (Moderate)
37 (Unhealthy for Sensitive Groups)
54 (Unhealthy for Sensitive Groups)
55 (Unhealthy for Sensitive Groups)
58 (Unhealthy)
17 (Moderate)
9.3 (Good)
13 (Moderate)
13 (Good)
18 (Moderate)
35 (Moderate)
12 (Good)
69 (Unhealthy)
44 (Unhealthy for Sensitive Groups)
44 (Unhealthy for Sensitive Groups)
23 (Moderate)
12 (Good)
14 (Moderate)
21 (Moderate)
63 (Unhealthy)
pm10
34 (Moderate)
31 (Moderate)
53 (Unhealthy for Sensitive Groups)
73 (Unhealthy for Sensitive Groups)
89 (Unhealthy)
98 (Unhealthy)
104 (Unhealthy)
38 (Moderate)
29 (Moderate)
42 (Moderate)
37 (Moderate)
45 (Moderate)
79 (Unhealthy for Sensitive Groups)
36 (Moderate)
133 (Very Unhealthy)
84 (Unhealthy)
92 (Unhealthy)
55 (Unhealthy for Sensitive Groups)
37 (Moderate)
38 (Moderate)
44 (Moderate)
73 (Unhealthy for Sensitive Groups)
no2
7.2 (Good)
7.6 (Good)
15 (Good)
20 (Good)
23 (Good)
23 (Good)
21 (Good)
17 (Good)
13 (Good)
9.4 (Good)
9.6 (Good)
15 (Good)
25 (Good)
4.9 (Good)
19 (Good)
20 (Good)
20 (Good)
18 (Good)
12 (Good)
16 (Good)
17 (Good)
24 (Good)
so2
6.7 (Good)
7.3 (Good)
14 (Good)
17 (Good)
15 (Good)
17 (Good)
17 (Good)
15 (Good)
11 (Good)
13 (Good)
12 (Good)
13 (Good)
8.8 (Good)
5.8 (Good)
19 (Good)
19 (Good)
18 (Good)
16 (Good)
15 (Good)
11 (Good)
13 (Good)
13 (Good)
co
562 (Good)
547 (Good)
540 (Good)
638 (Good)
746 (Good)
900 (Good)
952 (Good)
861 (Good)
754 (Good)
769 (Good)
761 (Good)
585 (Good)
1 (Good)
374 (Good)
1 (Good)
1 (Good)
1 (Good)
725 (Good)
976 (Good)
533 (Good)
14 (Good)
33 (Good)
o3
42 (Good)
39 (Good)
42 (Good)
61 (Good)
58 (Good)
64 (Good)
71 (Moderate)
35 (Good)
32 (Good)
41 (Good)
43 (Good)
51 (Good)
43 (Good)
36 (Good)
78 (Moderate)
48 (Good)
69 (Good)
45 (Good)
40 (Good)
57 (Good)
42 (Good)
41 (Good)
data source »
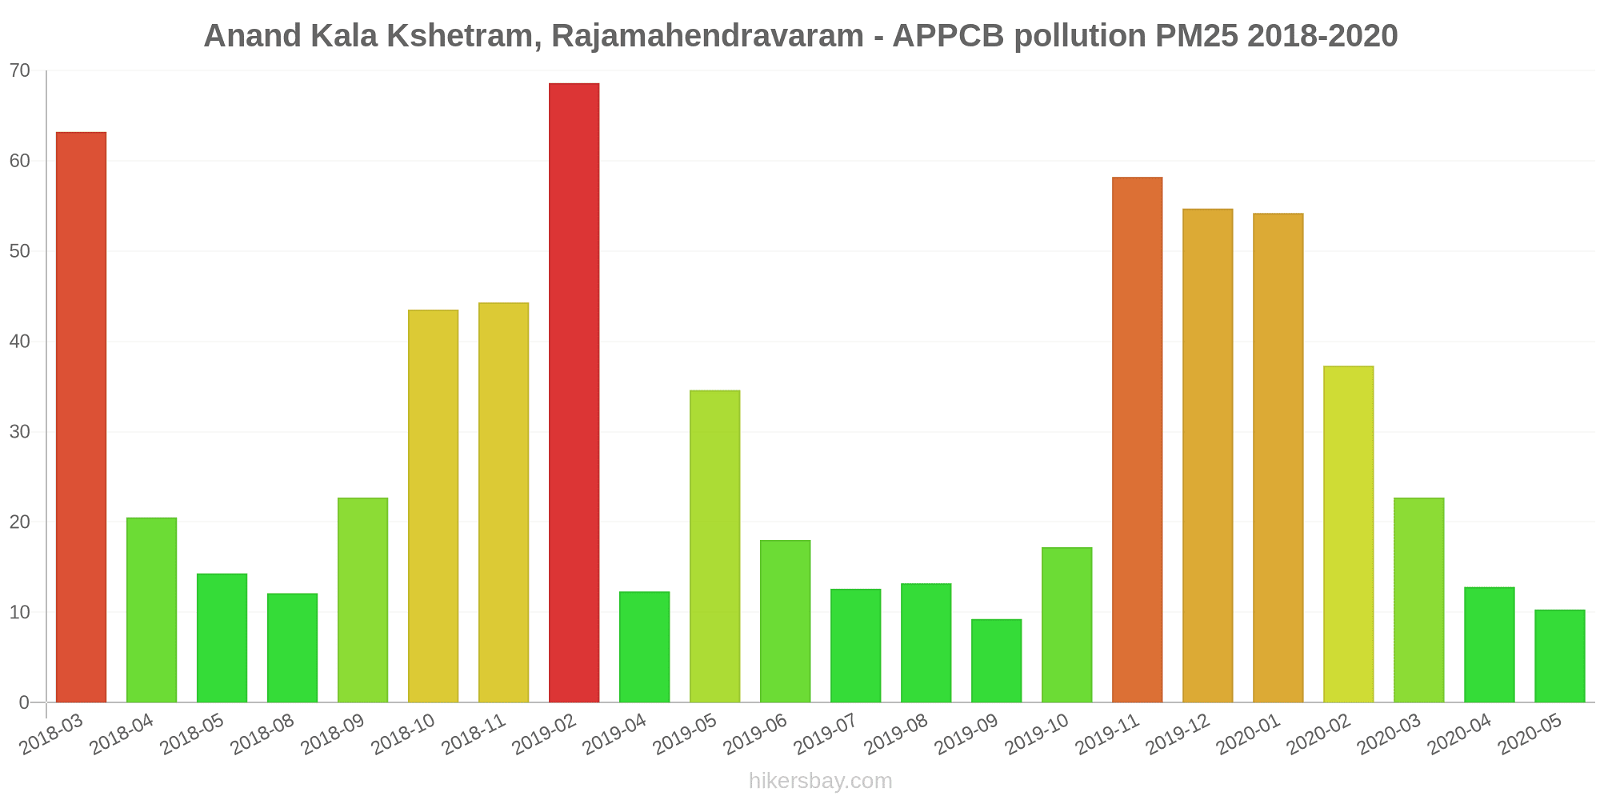
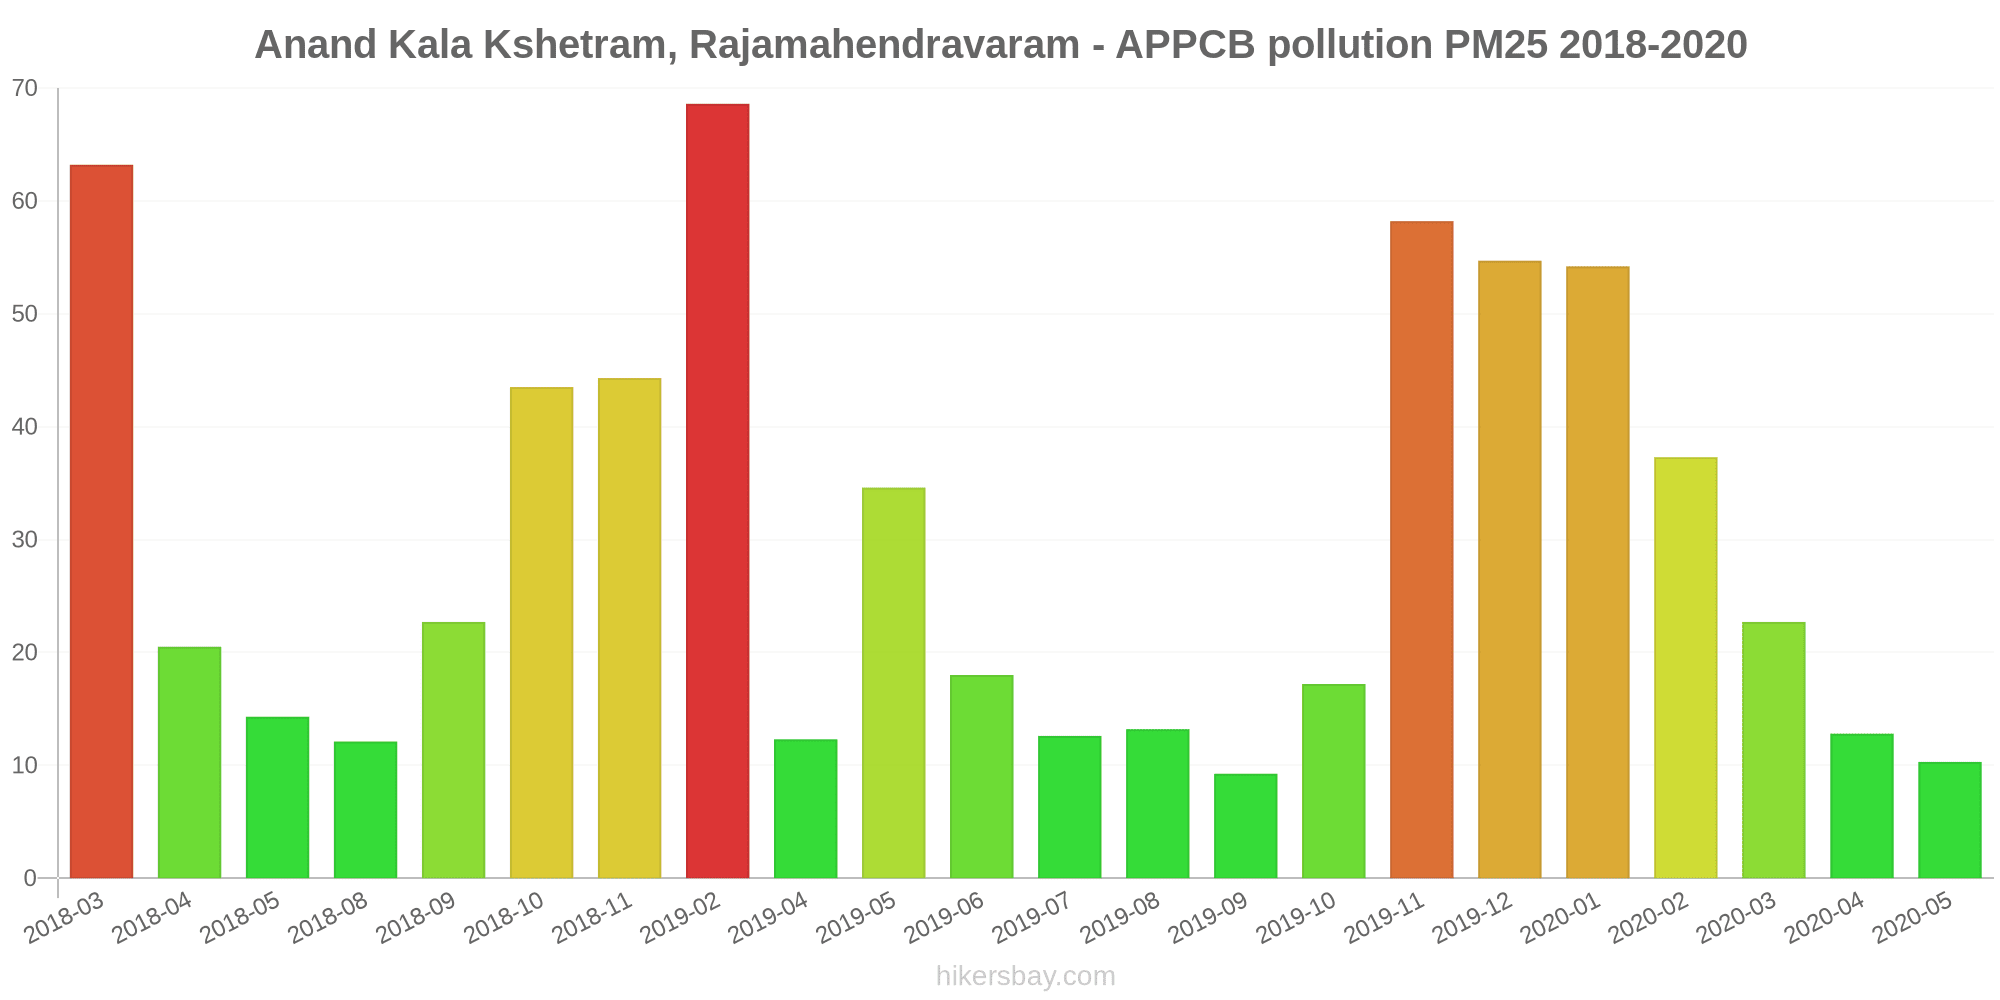
Anand Kala Kshetram, Rajamahendravaram - APPCB
Monday, October 31, 2022, 2:00 AM
PM10 86 (Unhealthy)
particulate matter (PM10) suspended dust
SO2 3.3 (Good)
sulfur dioxide (SO2)
PM2,5 52 (Unhealthy for Sensitive Groups)
particulate matter (PM2.5) dust
CO 540 (Good)
carbon monoxide (CO)
NO2 12 (Good)
nitrogen dioxide (NO2)
O3 3.8 (Good)
ozone (O3)
Anand Kala Kshetram, Rajamahendravaram - APPCB
index
2022-10-31
pm10
82
so2
3.3
pm25
50
co
280
no2
11
o3
3.9
Anand Kala Kshetram, Rajamahendravaram - APPCB
2018-03 2020-05
index
2020-05
2020-04
2020-03
2020-02
2020-01
2019-12
2019-11
2019-10
2019-09
2019-08
2019-07
2019-06
2019-05
2019-04
2019-02
2018-11
2018-10
2018-09
2018-08
2018-05
2018-04
2018-03
pm25
10
13
23
37
54
55
58
17
9.3
13
13
18
35
12
69
44
44
23
12
14
21
63
pm10
34
31
53
73
89
98
104
38
29
42
37
45
79
36
133
84
92
55
37
38
44
73
no2
7.2
7.6
15
20
23
23
21
17
13
9.4
9.6
15
25
4.9
19
20
20
18
12
16
17
24
so2
6.7
7.3
14
17
15
17
17
15
11
13
12
13
8.8
5.8
19
19
18
16
15
11
13
13
co
562
547
540
638
746
900
952
861
754
769
761
585
1
374
1
1
1
725
976
533
14
33
o3
42
39
42
61
58
64
71
35
32
41
43
51
43
36
78
48
69
45
40
57
42
41
* Pollution data source:
https://openaq.org
(caaqm)
The data is licensed under CC-By 4.0
PM10 86 (Unhealthy)
SO2 3 (Good)
PM2,5 52 (Unhealthy for Sensitive Groups)
CO 540 (Good)
NO2 12 (Good)
O3 4 (Good)
Data on air pollution from recent days in East Godavari
| index | 2022-10-31 |
|---|---|
| pm10 | 82 Unhealthy |
| so2 | 3 Good |
| pm25 | 50 Unhealthy for Sensitive Groups |
| co | 280 Good |
| no2 | 11 Good |
| o3 | 4 Good |

| index | 2020-05 | 2020-04 | 2020-03 | 2020-02 | 2020-01 | 2019-12 | 2019-11 | 2019-10 | 2019-09 | 2019-08 | 2019-07 | 2019-06 | 2019-05 | 2019-04 | 2019-02 | 2018-11 | 2018-10 | 2018-09 | 2018-08 | 2018-05 | 2018-04 | 2018-03 |
|---|---|---|---|---|---|---|---|---|---|---|---|---|---|---|---|---|---|---|---|---|---|---|
| pm25 | 10 (Good) | 13 (Good) | 23 (Moderate) | 37 (Unhealthy for Sensitive Groups) | 54 (Unhealthy for Sensitive Groups) | 55 (Unhealthy for Sensitive Groups) | 58 (Unhealthy) | 17 (Moderate) | 9.3 (Good) | 13 (Moderate) | 13 (Good) | 18 (Moderate) | 35 (Moderate) | 12 (Good) | 69 (Unhealthy) | 44 (Unhealthy for Sensitive Groups) | 44 (Unhealthy for Sensitive Groups) | 23 (Moderate) | 12 (Good) | 14 (Moderate) | 21 (Moderate) | 63 (Unhealthy) |
| pm10 | 34 (Moderate) | 31 (Moderate) | 53 (Unhealthy for Sensitive Groups) | 73 (Unhealthy for Sensitive Groups) | 89 (Unhealthy) | 98 (Unhealthy) | 104 (Unhealthy) | 38 (Moderate) | 29 (Moderate) | 42 (Moderate) | 37 (Moderate) | 45 (Moderate) | 79 (Unhealthy for Sensitive Groups) | 36 (Moderate) | 133 (Very Unhealthy) | 84 (Unhealthy) | 92 (Unhealthy) | 55 (Unhealthy for Sensitive Groups) | 37 (Moderate) | 38 (Moderate) | 44 (Moderate) | 73 (Unhealthy for Sensitive Groups) |
| no2 | 7.2 (Good) | 7.6 (Good) | 15 (Good) | 20 (Good) | 23 (Good) | 23 (Good) | 21 (Good) | 17 (Good) | 13 (Good) | 9.4 (Good) | 9.6 (Good) | 15 (Good) | 25 (Good) | 4.9 (Good) | 19 (Good) | 20 (Good) | 20 (Good) | 18 (Good) | 12 (Good) | 16 (Good) | 17 (Good) | 24 (Good) |
| so2 | 6.7 (Good) | 7.3 (Good) | 14 (Good) | 17 (Good) | 15 (Good) | 17 (Good) | 17 (Good) | 15 (Good) | 11 (Good) | 13 (Good) | 12 (Good) | 13 (Good) | 8.8 (Good) | 5.8 (Good) | 19 (Good) | 19 (Good) | 18 (Good) | 16 (Good) | 15 (Good) | 11 (Good) | 13 (Good) | 13 (Good) |
| co | 562 (Good) | 547 (Good) | 540 (Good) | 638 (Good) | 746 (Good) | 900 (Good) | 952 (Good) | 861 (Good) | 754 (Good) | 769 (Good) | 761 (Good) | 585 (Good) | 1 (Good) | 374 (Good) | 1 (Good) | 1 (Good) | 1 (Good) | 725 (Good) | 976 (Good) | 533 (Good) | 14 (Good) | 33 (Good) |
| o3 | 42 (Good) | 39 (Good) | 42 (Good) | 61 (Good) | 58 (Good) | 64 (Good) | 71 (Moderate) | 35 (Good) | 32 (Good) | 41 (Good) | 43 (Good) | 51 (Good) | 43 (Good) | 36 (Good) | 78 (Moderate) | 48 (Good) | 69 (Good) | 45 (Good) | 40 (Good) | 57 (Good) | 42 (Good) | 41 (Good) |
PM10 86 (Unhealthy)
particulate matter (PM10) suspended dustSO2 3.3 (Good)
sulfur dioxide (SO2)PM2,5 52 (Unhealthy for Sensitive Groups)
particulate matter (PM2.5) dustCO 540 (Good)
carbon monoxide (CO)NO2 12 (Good)
nitrogen dioxide (NO2)O3 3.8 (Good)
ozone (O3)Anand Kala Kshetram, Rajamahendravaram - APPCB
| index | 2022-10-31 |
|---|---|
| pm10 | 82 |
| so2 | 3.3 |
| pm25 | 50 |
| co | 280 |
| no2 | 11 |
| o3 | 3.9 |
Anand Kala Kshetram, Rajamahendravaram - APPCB
| index | 2020-05 | 2020-04 | 2020-03 | 2020-02 | 2020-01 | 2019-12 | 2019-11 | 2019-10 | 2019-09 | 2019-08 | 2019-07 | 2019-06 | 2019-05 | 2019-04 | 2019-02 | 2018-11 | 2018-10 | 2018-09 | 2018-08 | 2018-05 | 2018-04 | 2018-03 |
|---|---|---|---|---|---|---|---|---|---|---|---|---|---|---|---|---|---|---|---|---|---|---|
| pm25 | 10 | 13 | 23 | 37 | 54 | 55 | 58 | 17 | 9.3 | 13 | 13 | 18 | 35 | 12 | 69 | 44 | 44 | 23 | 12 | 14 | 21 | 63 |
| pm10 | 34 | 31 | 53 | 73 | 89 | 98 | 104 | 38 | 29 | 42 | 37 | 45 | 79 | 36 | 133 | 84 | 92 | 55 | 37 | 38 | 44 | 73 |
| no2 | 7.2 | 7.6 | 15 | 20 | 23 | 23 | 21 | 17 | 13 | 9.4 | 9.6 | 15 | 25 | 4.9 | 19 | 20 | 20 | 18 | 12 | 16 | 17 | 24 |
| so2 | 6.7 | 7.3 | 14 | 17 | 15 | 17 | 17 | 15 | 11 | 13 | 12 | 13 | 8.8 | 5.8 | 19 | 19 | 18 | 16 | 15 | 11 | 13 | 13 |
| co | 562 | 547 | 540 | 638 | 746 | 900 | 952 | 861 | 754 | 769 | 761 | 585 | 1 | 374 | 1 | 1 | 1 | 725 | 976 | 533 | 14 | 33 |
| o3 | 42 | 39 | 42 | 61 | 58 | 64 | 71 | 35 | 32 | 41 | 43 | 51 | 43 | 36 | 78 | 48 | 69 | 45 | 40 | 57 | 42 | 41 |