Air Pollution in Gandhinagar: Real-time Air Quality Index and smog alert.
Pollution and air quality forecast for Gandhinagar. Today is Wednesday, May 13, 2026. The following air pollution values have been recorded for Gandhinagar:- particulate matter (PM10) suspended dust - 99 (Unhealthy)
- sulfur dioxide (SO2) - 7 (Good)
- particulate matter (PM2.5) dust - 35 (Unhealthy for Sensitive Groups)
- carbon monoxide (CO) - 390 (Good)
- nitrogen dioxide (NO2) - 8 (Good)
- ozone (O3) - 2 (Good)

What is the air quality in Gandhinagar today? Is the air polluted in Gandhinagar?. Is there smog?
What is the level of PM10 today in Gandhinagar? (particulate matter (PM10) suspended dust)
The current level of particulate matter PM10 in Gandhinagar is:
99 (Unhealthy)
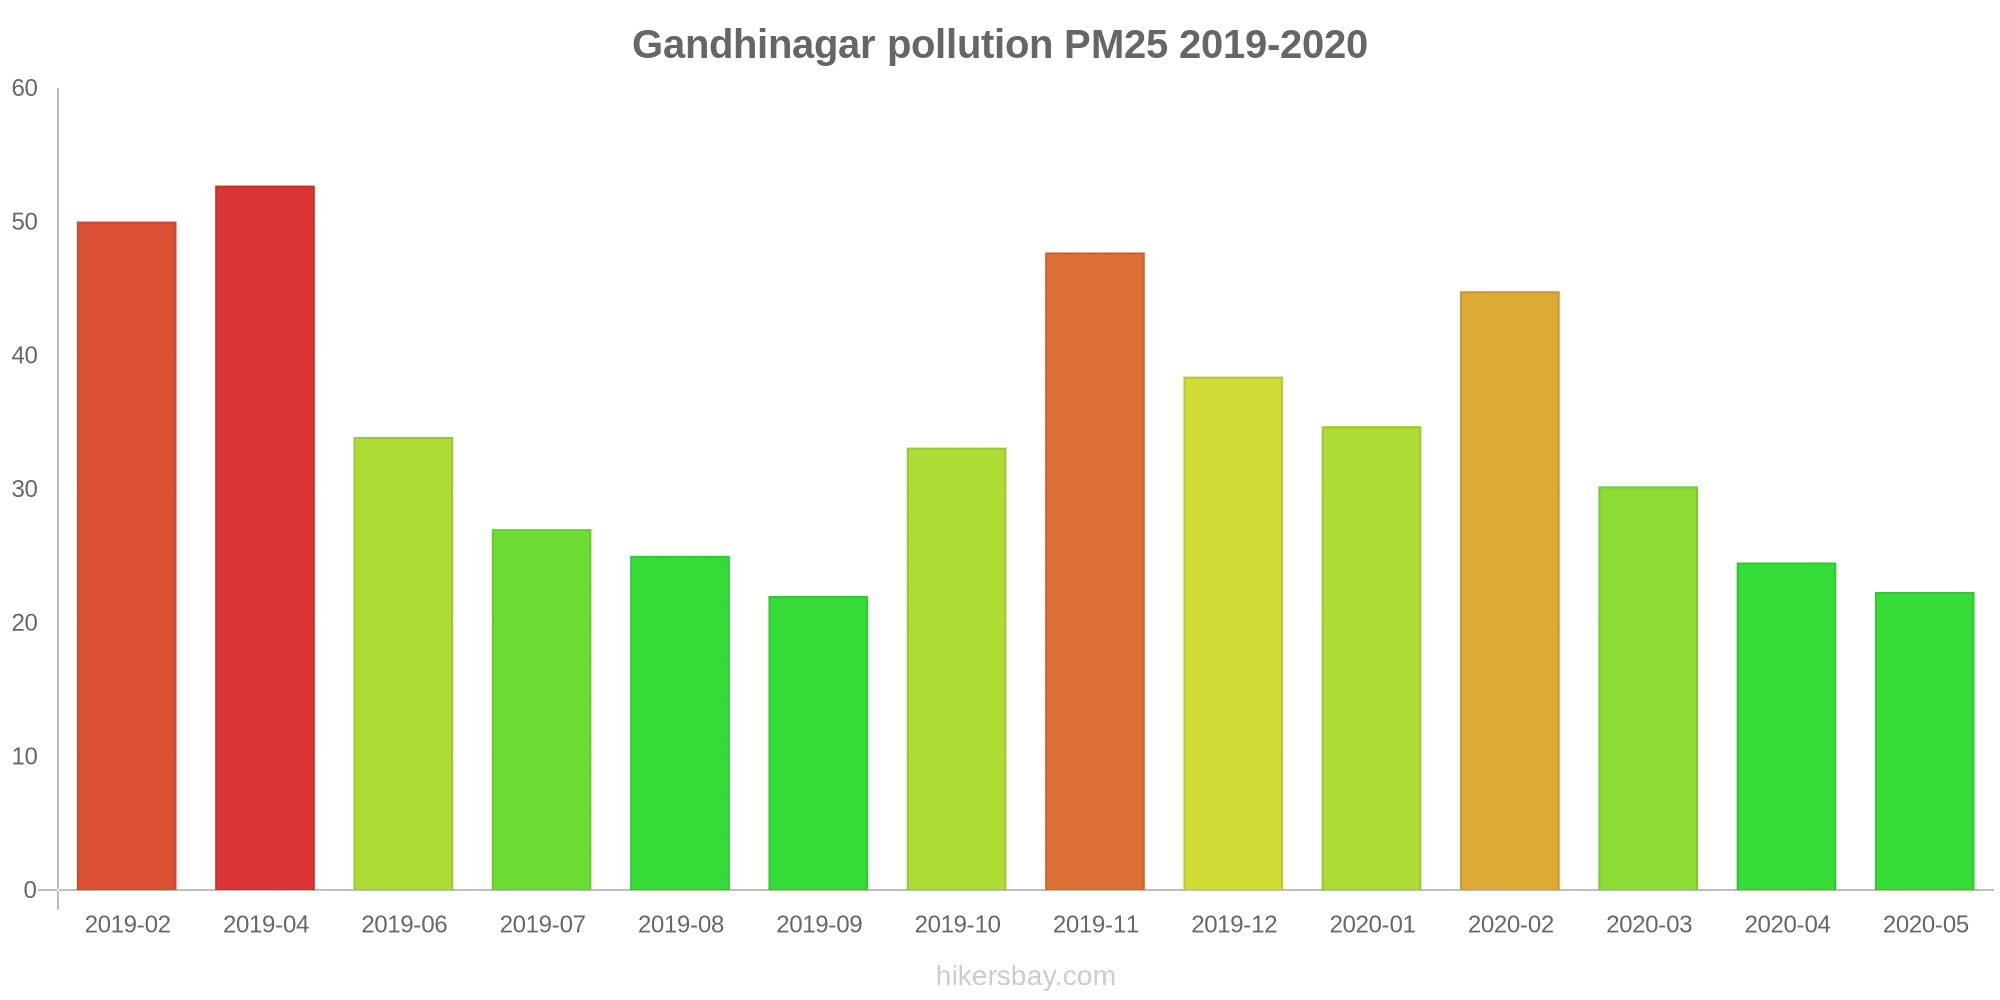
The highest PM10 values usually occur in month: 156 (April 2019).
The lowest value of particulate matter PM10 pollution in Gandhinagar is usually recorded in: September (42).
What is the level of SO2 pollution? (sulfur dioxide (SO2))
7 (Good)
What is the current level of PM2.5 in Gandhinagar? (particulate matter (PM2.5) dust)
Today's PM2.5 level is:
35 (Unhealthy for Sensitive Groups)
For comparison, the highest level of PM2.5 in Gandhinagar in the last 7 days was: 37 (Monday, October 31, 2022) and the lowest: 37 (Monday, October 31, 2022).
The highest PM2.5 values were recorded: 53 (April 2019).
The lowest level of particulate matter PM2.5 pollution occurs in month: September (22).
How high is the CO level? (carbon monoxide (CO))
390 (Good)
How high is the level of NO2? (nitrogen dioxide (NO2))
8 (Good)
How is the O3 level today in Gandhinagar? (ozone (O3))
2 (Good)
Current data Monday, October 31, 2022, 1:45 AM
PM10 99 (Unhealthy)
SO2 7 (Good)
PM2,5 35 (Unhealthy for Sensitive Groups)
CO 390 (Good)
NO2 8 (Good)
O3 2 (Good)
Data on air pollution from recent days in Gandhinagar
index
2022-10-31
pm10
96
Unhealthy
so2
7
Good
pm25
37
Unhealthy for Sensitive Groups
co
375
Good
no2
8
Good
o3
2
Good
data source »
Air pollution in Gandhinagar from February 2019 to May 2020

index
2020-05
2020-04
2020-03
2020-02
2020-01
2019-12
2019-11
2019-10
2019-09
2019-08
2019-07
2019-06
2019-04
2019-02
pm25
22 (Moderate)
25 (Moderate)
30 (Moderate)
45 (Unhealthy for Sensitive Groups)
35 (Moderate)
38 (Unhealthy for Sensitive Groups)
48 (Unhealthy for Sensitive Groups)
33 (Moderate)
22 (Moderate)
25 (Moderate)
27 (Moderate)
34 (Moderate)
53 (Unhealthy for Sensitive Groups)
50 (Unhealthy for Sensitive Groups)
pm10
67 (Unhealthy for Sensitive Groups)
67 (Unhealthy for Sensitive Groups)
75 (Unhealthy for Sensitive Groups)
102 (Unhealthy)
69 (Unhealthy for Sensitive Groups)
73 (Unhealthy for Sensitive Groups)
88 (Unhealthy)
91 (Unhealthy)
42 (Moderate)
58 (Unhealthy for Sensitive Groups)
67 (Unhealthy for Sensitive Groups)
79 (Unhealthy for Sensitive Groups)
156 (Very bad Hazardous)
121 (Very Unhealthy)
no2
2.5 (Good)
3.9 (Good)
8.9 (Good)
16 (Good)
13 (Good)
13 (Good)
40 (Moderate)
35 (Good)
14 (Good)
24 (Good)
6.4 (Good)
6.3 (Good)
10 (Good)
48 (Moderate)
so2
6.9 (Good)
6.5 (Good)
9.3 (Good)
8.2 (Good)
6.6 (Good)
6.4 (Good)
8.8 (Good)
5.1 (Good)
4.4 (Good)
3.3 (Good)
3 (Good)
3.4 (Good)
21 (Good)
3.6 (Good)
co
647 (Good)
787 (Good)
840 (Good)
1 (Good)
594 (Good)
739 (Good)
835 (Good)
1 (Good)
654 (Good)
467 (Good)
429 (Good)
223 (Good)
582 (Good)
1 (Good)
o3
29 (Good)
24 (Good)
23 (Good)
29 (Good)
28 (Good)
38 (Good)
25 (Good)
28 (Good)
24 (Good)
30 (Good)
34 (Good)
- (Good)
12 (Good)
30 (Good)
data source »
Quality of life in Gandhinagar
Green and Parks in the City
Gandhinagar
96%
Nepal: 32%
Bangladesh: 33%
Bhutan: 82%
Sri Lanka: 59%
Pakistan: 49%
Pleasure of spending time in the city
Gandhinagar
92%
Nepal: 32%
Bangladesh: 26%
Bhutan: 61%
Sri Lanka: 52%
Pakistan: 43%
Air Pollution
Gandhinagar
12%
Nepal: 76%
Bangladesh: 78%
Bhutan: 45%
Sri Lanka: 53%
Pakistan: 64%
Garbage Disposal
Gandhinagar
81%
Nepal: 25%
Bangladesh: 22%
Bhutan: 47%
Sri Lanka: 41%
Pakistan: 34%
Availability and quality of drinking water
Gandhinagar
77%
Nepal: 36%
Bangladesh: 44%
Bhutan: 64%
Sri Lanka: 65%
Pakistan: 44%
Cleanliness and tidiness
Gandhinagar
81%
Nepal: 27%
Bangladesh: 23%
Bhutan: 57%
Sri Lanka: 52%
Pakistan: 40%
Noise and Light pollution
Gandhinagar
40%
Nepal: 55%
Bangladesh: 63%
Bhutan: 55%
Sri Lanka: 50%
Pakistan: 59%
Water Pollution
Gandhinagar
50%
Nepal: 76%
Bangladesh: 74%
Bhutan: 56%
Sri Lanka: 57%
Pakistan: 70%
Source: Numbeo
Sector-10, Gandhinagar - GPCB
Monday, October 31, 2022, 1:45 AM
PM10 99 (Unhealthy)
particulate matter (PM10) suspended dust
SO2 7.2 (Good)
sulfur dioxide (SO2)
PM2,5 35 (Unhealthy for Sensitive Groups)
particulate matter (PM2.5) dust
CO 390 (Good)
carbon monoxide (CO)
NO2 7.7 (Good)
nitrogen dioxide (NO2)
O3 1.6 (Good)
ozone (O3)
Sector-10, Gandhinagar - GPCB
index
2022-10-31
pm10
96
so2
7.2
pm25
37
co
375
no2
7.7
o3
1.6
Sector-10, Gandhinagar - GPCB
2019-02 2020-05
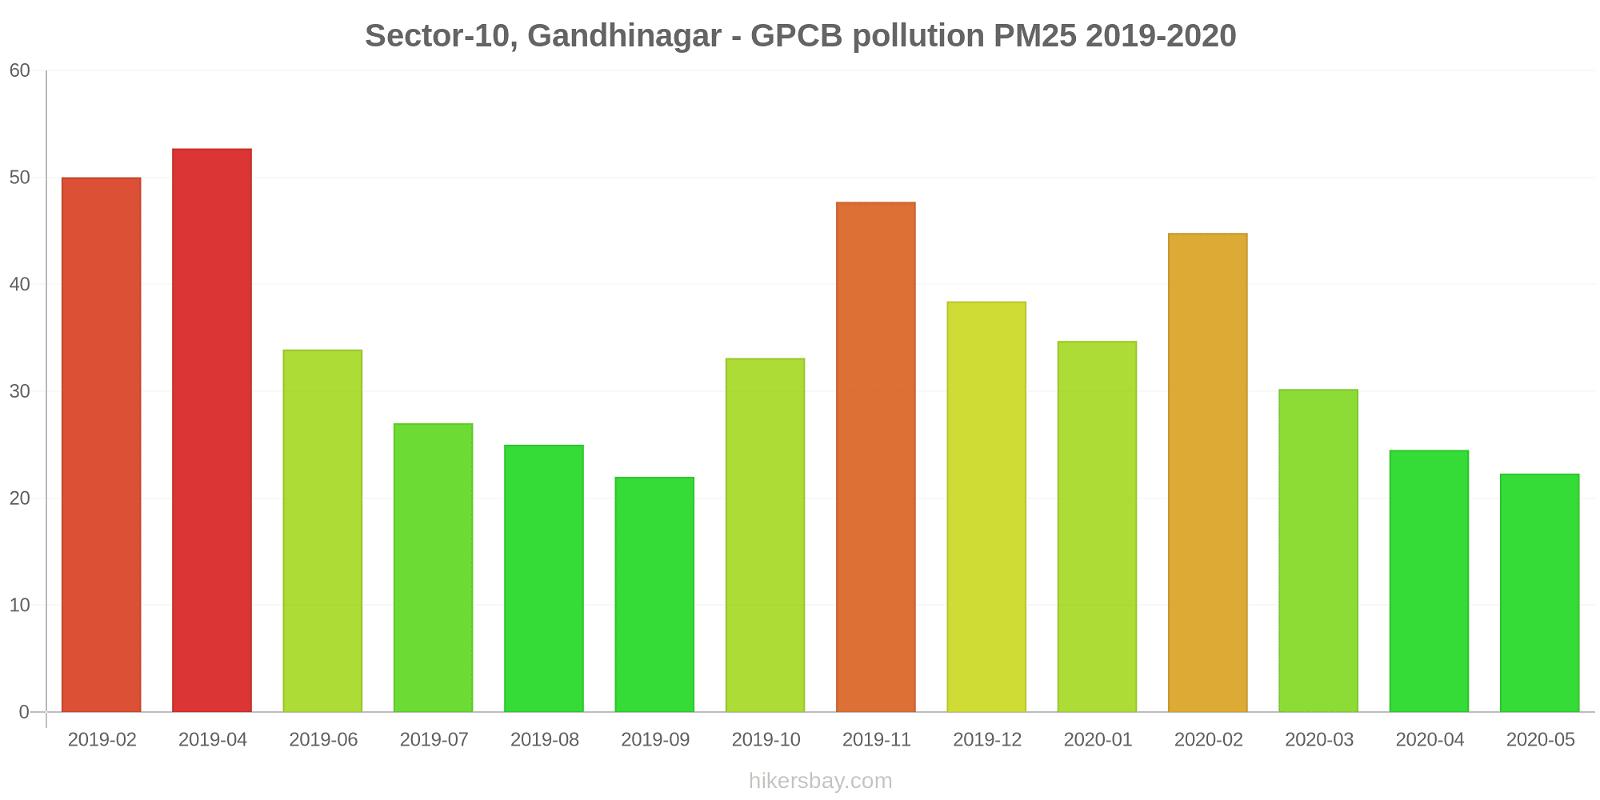
index
2020-05
2020-04
2020-03
2020-02
2020-01
2019-12
2019-11
2019-10
2019-09
2019-08
2019-07
2019-06
2019-04
2019-02
pm25
22
25
30
45
35
38
48
33
22
25
27
34
53
50
pm10
67
67
75
102
69
73
88
91
42
58
67
79
156
121
no2
2.5
3.9
8.9
16
13
13
40
35
14
24
6.4
6.3
10
48
so2
6.9
6.5
9.3
8.2
6.6
6.4
8.8
5.1
4.4
3.3
3
3.4
21
3.6
co
647
787
840
1
594
739
835
1
654
467
429
223
582
1
o3
29
24
23
29
28
38
25
28
24
30
34
-
12
30
* Pollution data source:
https://openaq.org
(caaqm)
The data is licensed under CC-By 4.0
PM10 99 (Unhealthy)
SO2 7 (Good)
PM2,5 35 (Unhealthy for Sensitive Groups)
CO 390 (Good)
NO2 8 (Good)
O3 2 (Good)
Data on air pollution from recent days in Gandhinagar
| index | 2022-10-31 |
|---|---|
| pm10 | 96 Unhealthy |
| so2 | 7 Good |
| pm25 | 37 Unhealthy for Sensitive Groups |
| co | 375 Good |
| no2 | 8 Good |
| o3 | 2 Good |
| index | 2020-05 | 2020-04 | 2020-03 | 2020-02 | 2020-01 | 2019-12 | 2019-11 | 2019-10 | 2019-09 | 2019-08 | 2019-07 | 2019-06 | 2019-04 | 2019-02 |
|---|---|---|---|---|---|---|---|---|---|---|---|---|---|---|
| pm25 | 22 (Moderate) | 25 (Moderate) | 30 (Moderate) | 45 (Unhealthy for Sensitive Groups) | 35 (Moderate) | 38 (Unhealthy for Sensitive Groups) | 48 (Unhealthy for Sensitive Groups) | 33 (Moderate) | 22 (Moderate) | 25 (Moderate) | 27 (Moderate) | 34 (Moderate) | 53 (Unhealthy for Sensitive Groups) | 50 (Unhealthy for Sensitive Groups) |
| pm10 | 67 (Unhealthy for Sensitive Groups) | 67 (Unhealthy for Sensitive Groups) | 75 (Unhealthy for Sensitive Groups) | 102 (Unhealthy) | 69 (Unhealthy for Sensitive Groups) | 73 (Unhealthy for Sensitive Groups) | 88 (Unhealthy) | 91 (Unhealthy) | 42 (Moderate) | 58 (Unhealthy for Sensitive Groups) | 67 (Unhealthy for Sensitive Groups) | 79 (Unhealthy for Sensitive Groups) | 156 (Very bad Hazardous) | 121 (Very Unhealthy) |
| no2 | 2.5 (Good) | 3.9 (Good) | 8.9 (Good) | 16 (Good) | 13 (Good) | 13 (Good) | 40 (Moderate) | 35 (Good) | 14 (Good) | 24 (Good) | 6.4 (Good) | 6.3 (Good) | 10 (Good) | 48 (Moderate) |
| so2 | 6.9 (Good) | 6.5 (Good) | 9.3 (Good) | 8.2 (Good) | 6.6 (Good) | 6.4 (Good) | 8.8 (Good) | 5.1 (Good) | 4.4 (Good) | 3.3 (Good) | 3 (Good) | 3.4 (Good) | 21 (Good) | 3.6 (Good) |
| co | 647 (Good) | 787 (Good) | 840 (Good) | 1 (Good) | 594 (Good) | 739 (Good) | 835 (Good) | 1 (Good) | 654 (Good) | 467 (Good) | 429 (Good) | 223 (Good) | 582 (Good) | 1 (Good) |
| o3 | 29 (Good) | 24 (Good) | 23 (Good) | 29 (Good) | 28 (Good) | 38 (Good) | 25 (Good) | 28 (Good) | 24 (Good) | 30 (Good) | 34 (Good) | - (Good) | 12 (Good) | 30 (Good) |
Green and Parks in the City
Gandhinagar 96%
Nepal: 32% Bangladesh: 33% Bhutan: 82% Sri Lanka: 59% Pakistan: 49%Pleasure of spending time in the city
Gandhinagar 92%
Nepal: 32% Bangladesh: 26% Bhutan: 61% Sri Lanka: 52% Pakistan: 43%Air Pollution
Gandhinagar 12%
Nepal: 76% Bangladesh: 78% Bhutan: 45% Sri Lanka: 53% Pakistan: 64%Garbage Disposal
Gandhinagar 81%
Nepal: 25% Bangladesh: 22% Bhutan: 47% Sri Lanka: 41% Pakistan: 34%Availability and quality of drinking water
Gandhinagar 77%
Nepal: 36% Bangladesh: 44% Bhutan: 64% Sri Lanka: 65% Pakistan: 44%Cleanliness and tidiness
Gandhinagar 81%
Nepal: 27% Bangladesh: 23% Bhutan: 57% Sri Lanka: 52% Pakistan: 40%Noise and Light pollution
Gandhinagar 40%
Nepal: 55% Bangladesh: 63% Bhutan: 55% Sri Lanka: 50% Pakistan: 59%Water Pollution
Gandhinagar 50%
Nepal: 76% Bangladesh: 74% Bhutan: 56% Sri Lanka: 57% Pakistan: 70%PM10 99 (Unhealthy)
particulate matter (PM10) suspended dustSO2 7.2 (Good)
sulfur dioxide (SO2)PM2,5 35 (Unhealthy for Sensitive Groups)
particulate matter (PM2.5) dustCO 390 (Good)
carbon monoxide (CO)NO2 7.7 (Good)
nitrogen dioxide (NO2)O3 1.6 (Good)
ozone (O3)Sector-10, Gandhinagar - GPCB
| index | 2022-10-31 |
|---|---|
| pm10 | 96 |
| so2 | 7.2 |
| pm25 | 37 |
| co | 375 |
| no2 | 7.7 |
| o3 | 1.6 |
Sector-10, Gandhinagar - GPCB

| index | 2020-05 | 2020-04 | 2020-03 | 2020-02 | 2020-01 | 2019-12 | 2019-11 | 2019-10 | 2019-09 | 2019-08 | 2019-07 | 2019-06 | 2019-04 | 2019-02 |
|---|---|---|---|---|---|---|---|---|---|---|---|---|---|---|
| pm25 | 22 | 25 | 30 | 45 | 35 | 38 | 48 | 33 | 22 | 25 | 27 | 34 | 53 | 50 |
| pm10 | 67 | 67 | 75 | 102 | 69 | 73 | 88 | 91 | 42 | 58 | 67 | 79 | 156 | 121 |
| no2 | 2.5 | 3.9 | 8.9 | 16 | 13 | 13 | 40 | 35 | 14 | 24 | 6.4 | 6.3 | 10 | 48 |
| so2 | 6.9 | 6.5 | 9.3 | 8.2 | 6.6 | 6.4 | 8.8 | 5.1 | 4.4 | 3.3 | 3 | 3.4 | 21 | 3.6 |
| co | 647 | 787 | 840 | 1 | 594 | 739 | 835 | 1 | 654 | 467 | 429 | 223 | 582 | 1 |
| o3 | 29 | 24 | 23 | 29 | 28 | 38 | 25 | 28 | 24 | 30 | 34 | - | 12 | 30 |