Air Pollution in Ghaziabad: Real-time Air Quality Index and smog alert.
Pollution and air quality forecast for Ghaziabad. Today is Thursday, April 2, 2026. The following air pollution values have been recorded for Ghaziabad:- ozone (O3) - 45 (Good)
- particulate matter (PM2.5) dust - 205 (Very bad Hazardous)
- particulate matter (PM10) suspended dust - 294 (Very bad Hazardous)
- nitrogen dioxide (NO2) - 62 (Moderate)
- sulfur dioxide (SO2) - 16 (Good)
- carbon monoxide (CO) - 2430 (Moderate)

What is the air quality in Ghaziabad today? Is the air polluted in Ghaziabad?. Is there smog?
How is the O3 level today in Ghaziabad? (ozone (O3))
45 (Good)
What is the current level of PM2.5 in Ghaziabad? (particulate matter (PM2.5) dust)
Today's PM2.5 level is:
205 (Very bad Hazardous)
For comparison, the highest level of PM2.5 in Ghaziabad in the last 7 days was: 207 (Monday, October 31, 2022) and the lowest: 207 (Monday, October 31, 2022).
The highest PM2.5 values were recorded: 252 (December 2018).
The lowest level of particulate matter PM2.5 pollution occurs in month: May (34).
What is the level of PM10 today in Ghaziabad? (particulate matter (PM10) suspended dust)
The current level of particulate matter PM10 in Ghaziabad is:
294 (Very bad Hazardous)
The highest PM10 values usually occur in month: 380 (April 2019).
The lowest value of particulate matter PM10 pollution in Ghaziabad is usually recorded in: August (88).
How high is the level of NO2? (nitrogen dioxide (NO2))
62 (Moderate)
What is the level of SO2 pollution? (sulfur dioxide (SO2))
16 (Good)
How high is the CO level? (carbon monoxide (CO))
2430 (Moderate)
Current data Monday, October 31, 2022, 2:00 AM
O3 45 (Good)
PM2,5 205 (Very bad Hazardous)
PM10 294 (Very bad Hazardous)
NO2 62 (Moderate)
SO2 16 (Good)
CO 2430 (Moderate)
Data on air pollution from recent days in Ghaziabad
index
2022-10-31
2022-10-26
o3
12
Good
112
Moderate
pm25
207
Very bad Hazardous
-
Good
pm10
296
Very bad Hazardous
-
Good
no2
61
Moderate
-
Good
so2
16
Good
-
Good
co
2430
Moderate
-
Good
data source »
Air pollution in Ghaziabad from July 2019 to May 2020

index
2020-05
2020-04
2020-03
2020-02
2020-01
2019-12
2019-11
2019-10
2019-09
2019-05
2019-04
2019-02
2018-12
2018-11
2018-10
2019-08
2019-07
pm25
42 (Unhealthy for Sensitive Groups)
51 (Unhealthy for Sensitive Groups)
60 (Unhealthy)
91 (Very Unhealthy)
107 (Very Unhealthy)
141 (Very bad Hazardous)
137 (Very bad Hazardous)
130 (Very bad Hazardous)
52 (Unhealthy for Sensitive Groups)
34 (Moderate)
76 (Very Unhealthy)
195 (Very bad Hazardous)
252 (Very bad Hazardous)
215 (Very bad Hazardous)
205 (Very bad Hazardous)
38 (Unhealthy for Sensitive Groups)
37 (Unhealthy for Sensitive Groups)
pm10
112 (Very Unhealthy)
142 (Very Unhealthy)
124 (Very Unhealthy)
163 (Very bad Hazardous)
184 (Very bad Hazardous)
274 (Very bad Hazardous)
264 (Very bad Hazardous)
247 (Very bad Hazardous)
148 (Very Unhealthy)
264 (Very bad Hazardous)
380 (Very bad Hazardous)
272 (Very bad Hazardous)
313 (Very bad Hazardous)
333 (Very bad Hazardous)
344 (Very bad Hazardous)
88 (Unhealthy)
95 (Unhealthy)
no2
42 (Moderate)
46 (Moderate)
52 (Moderate)
59 (Moderate)
60 (Moderate)
52 (Moderate)
74 (Moderate)
48 (Moderate)
31 (Good)
12 (Good)
46 (Moderate)
75 (Moderate)
55 (Moderate)
51 (Moderate)
51 (Moderate)
40 (Good)
47 (Moderate)
so2
11 (Good)
14 (Good)
11 (Good)
12 (Good)
10 (Good)
6.9 (Good)
9.8 (Good)
13 (Good)
12 (Good)
9.2 (Good)
34 (Good)
16 (Good)
14 (Good)
13 (Good)
18 (Good)
13 (Good)
11 (Good)
o3
24 (Good)
24 (Good)
17 (Good)
21 (Good)
11 (Good)
23 (Good)
42 (Good)
56 (Good)
61 (Good)
55 (Good)
55 (Good)
28 (Good)
27 (Good)
49 (Good)
49 (Good)
21 (Good)
35 (Good)
co
437 (Good)
1 (Good)
1 (Good)
486 (Good)
368 (Good)
249 (Good)
360 (Good)
1 (Good)
850 (Good)
653 (Good)
859 (Good)
1 (Good)
1 (Good)
1 (Good)
1 (Good)
1 (Good)
1 (Good)
data source »
Quality of life in Ghaziabad
Green and Parks in the City
Ghaziabad
34%
Nepal: 32%
Bangladesh: 33%
Bhutan: 82%
Sri Lanka: 59%
Pakistan: 49%
Pleasure of spending time in the city
Ghaziabad
20%
Nepal: 32%
Bangladesh: 26%
Bhutan: 61%
Sri Lanka: 52%
Pakistan: 43%
Air Pollution
Ghaziabad
87%
Nepal: 76%
Bangladesh: 78%
Bhutan: 45%
Sri Lanka: 53%
Pakistan: 64%
Garbage Disposal
Ghaziabad
22%
Nepal: 25%
Bangladesh: 22%
Bhutan: 47%
Sri Lanka: 41%
Pakistan: 34%
Availability and quality of drinking water
Ghaziabad
36%
Nepal: 36%
Bangladesh: 44%
Bhutan: 64%
Sri Lanka: 65%
Pakistan: 44%
Cleanliness and tidiness
Ghaziabad
26%
Nepal: 27%
Bangladesh: 23%
Bhutan: 57%
Sri Lanka: 52%
Pakistan: 40%
Noise and Light pollution
Ghaziabad
65%
Nepal: 55%
Bangladesh: 63%
Bhutan: 55%
Sri Lanka: 50%
Pakistan: 59%
Water Pollution
Ghaziabad
79%
Nepal: 76%
Bangladesh: 74%
Bhutan: 56%
Sri Lanka: 57%
Pakistan: 70%
Source: Numbeo
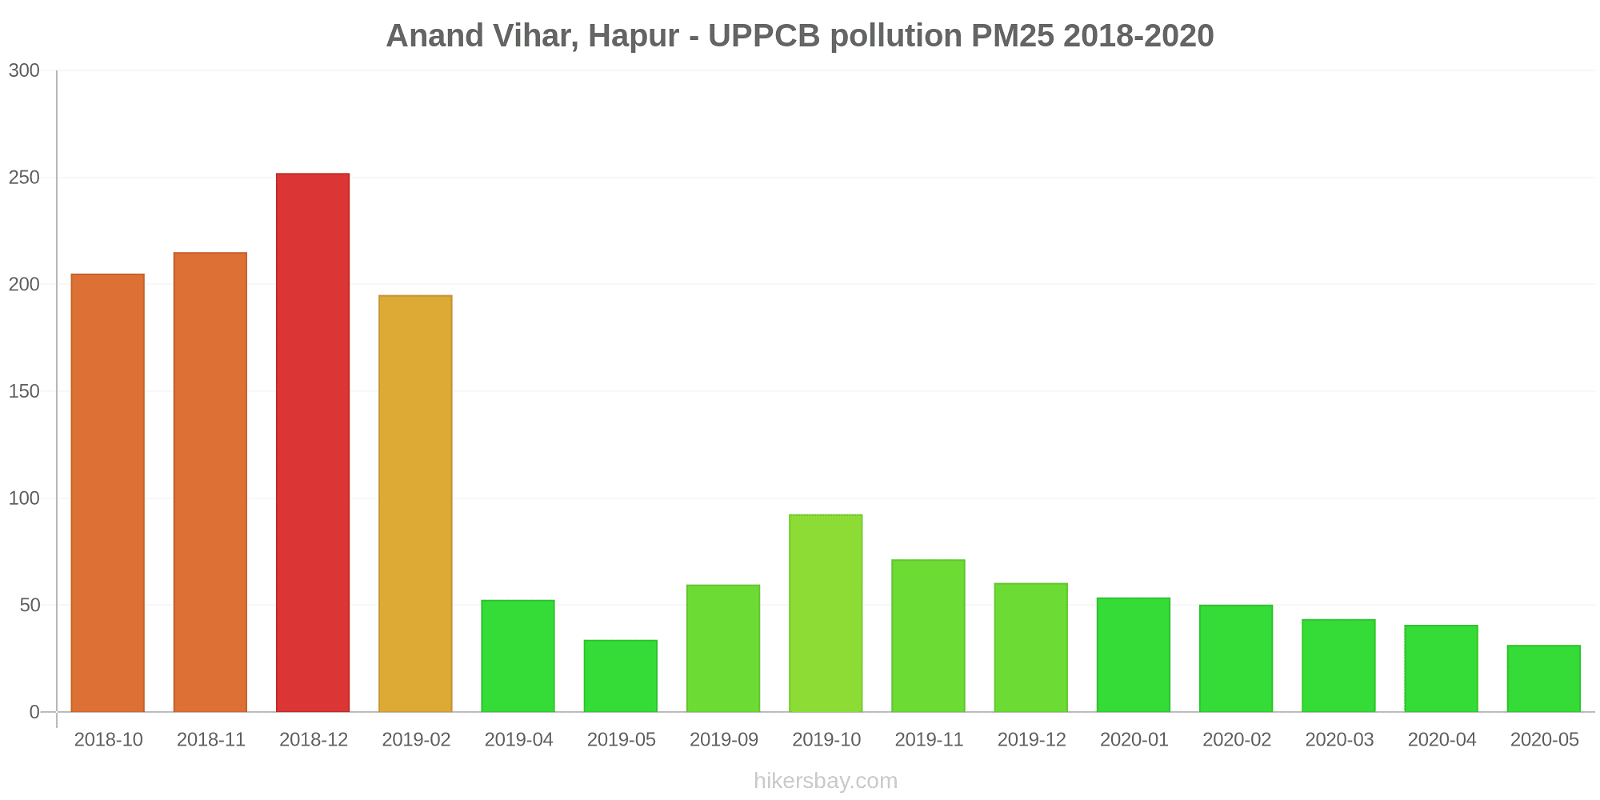
Anand Vihar, Hapur - UPPCB
Monday, October 31, 2022, 2:00 AM
O3 13 (Good)
ozone (O3)
PM2,5 166 (Very bad Hazardous)
particulate matter (PM2.5) dust
PM10 219 (Very bad Hazardous)
particulate matter (PM10) suspended dust
NO2 38 (Good)
nitrogen dioxide (NO2)
SO2 29 (Good)
sulfur dioxide (SO2)
Loni, Loni Dehat - UPPCB
Monday, October 31, 2022, 2:00 AM
PM2,5 224 (Very bad Hazardous)
particulate matter (PM2.5) dust
NO2 70 (Moderate)
nitrogen dioxide (NO2)
SO2 4.1 (Good)
sulfur dioxide (SO2)
CO 2220 (Moderate)
carbon monoxide (CO)
PM10 311 (Very bad Hazardous)
particulate matter (PM10) suspended dust
O3 112 (Moderate)
ozone (O3)
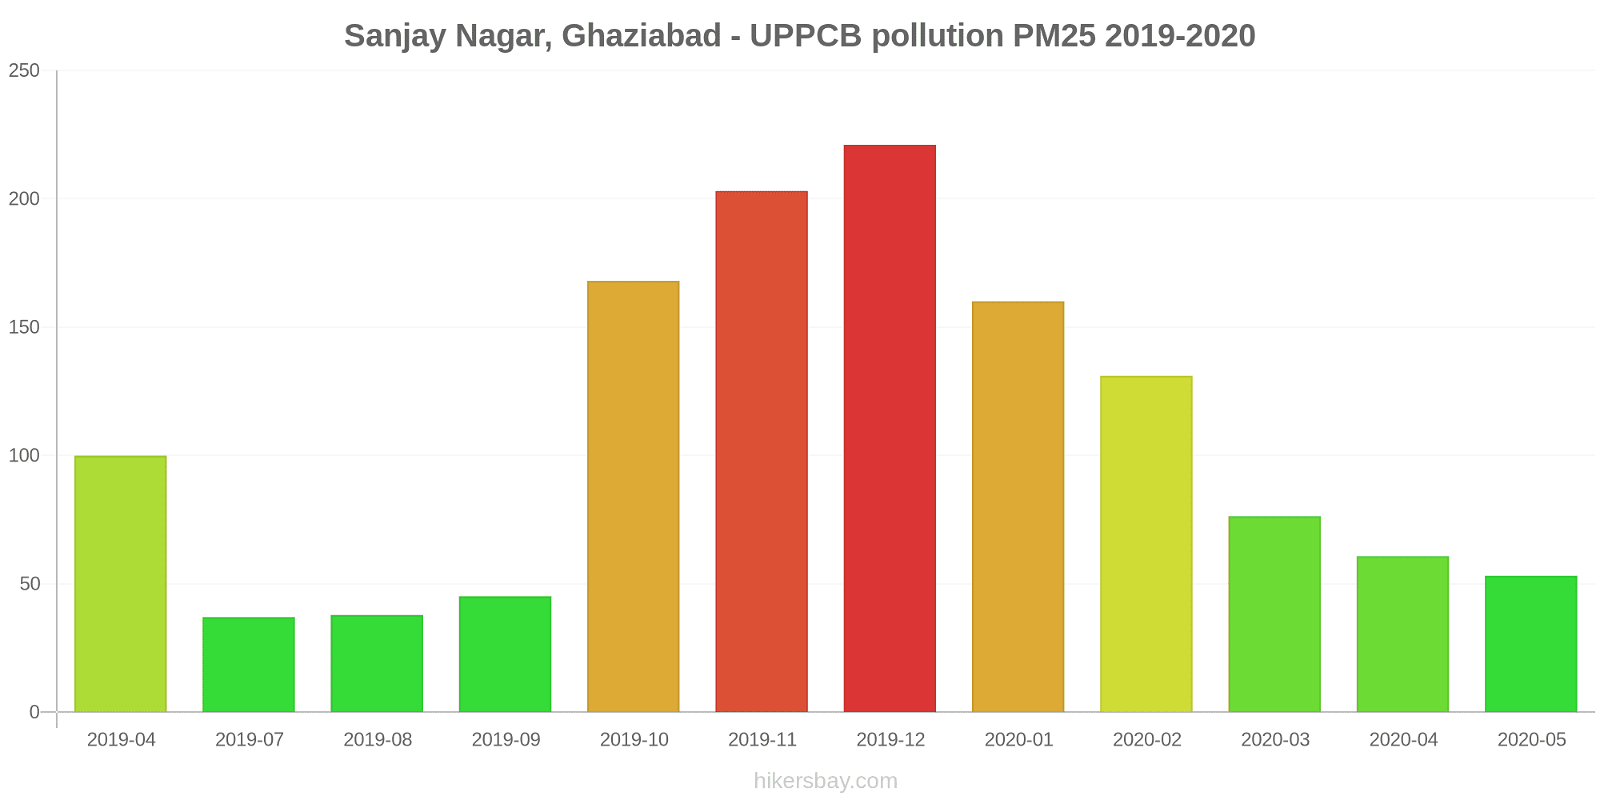
Sanjay Nagar, Ghaziabad - UPPCB
Monday, October 31, 2022, 2:00 AM
PM2,5 226 (Very bad Hazardous)
particulate matter (PM2.5) dust
PM10 351 (Very bad Hazardous)
particulate matter (PM10) suspended dust
NO2 78 (Moderate)
nitrogen dioxide (NO2)
SO2 14 (Good)
sulfur dioxide (SO2)
CO 2640 (Moderate)
carbon monoxide (CO)
O3 10 (Good)
ozone (O3)
Anand Vihar, Hapur - UPPCB
index
2022-10-31
o3
13
pm25
171
pm10
227
no2
35
so2
29
Loni, Loni Dehat - UPPCB
index
2022-10-31
2022-10-26
o3
-
112
pm25
224
-
no2
70
-
so2
4.1
-
co
2220
-
pm10
311
-
Sanjay Nagar, Ghaziabad - UPPCB
index
2022-10-31
pm25
226
pm10
351
no2
78
so2
14
co
2640
o3
10
Anand Vihar, Hapur - UPPCB
2018-10 2020-05
index
2020-05
2020-04
2020-03
2020-02
2020-01
2019-12
2019-11
2019-10
2019-09
2019-05
2019-04
2019-02
2018-12
2018-11
2018-10
pm25
31
41
44
50
54
60
71
93
60
34
53
195
252
215
205
pm10
110
153
108
116
142
257
253
224
200
264
366
272
313
333
344
so2
5.7
8.4
5.8
7.8
8.4
5.2
6.5
13
12
9.2
19
16
14
13
18
co
1
1
1
970
734
496
718
1
829
653
741
1
1
1
1
o3
1.9
1.8
1.8
1.8
2
37
64
80
107
55
46
28
27
49
49
no2
53
59
53
61
62
36
72
39
27
12
27
75
55
51
51
Sanjay Nagar, Ghaziabad - UPPCB
2019-04 2020-05
index
2020-05
2020-04
2020-03
2020-02
2020-01
2019-12
2019-11
2019-10
2019-09
2019-08
2019-07
2019-04
pm25
53
61
76
131
160
221
203
168
45
38
37
100
no2
31
34
51
58
58
67
76
56
34
40
47
65
so2
17
20
16
15
13
8.6
13
13
13
13
11
48
co
872
1
1
1
1
1
1
1
870
1
1
977
o3
47
47
32
40
20
8.5
19
32
15
21
35
64
pm10
114
130
140
209
226
290
274
269
97
88
95
394
* Pollution data source:
https://openaq.org
(caaqm)
The data is licensed under CC-By 4.0
O3 45 (Good)
PM2,5 205 (Very bad Hazardous)
PM10 294 (Very bad Hazardous)
NO2 62 (Moderate)
SO2 16 (Good)
CO 2430 (Moderate)
Data on air pollution from recent days in Ghaziabad
| index | 2022-10-31 | 2022-10-26 |
|---|---|---|
| o3 | 12 Good |
112 Moderate |
| pm25 | 207 Very bad Hazardous |
- Good |
| pm10 | 296 Very bad Hazardous |
- Good |
| no2 | 61 Moderate |
- Good |
| so2 | 16 Good |
- Good |
| co | 2430 Moderate |
- Good |
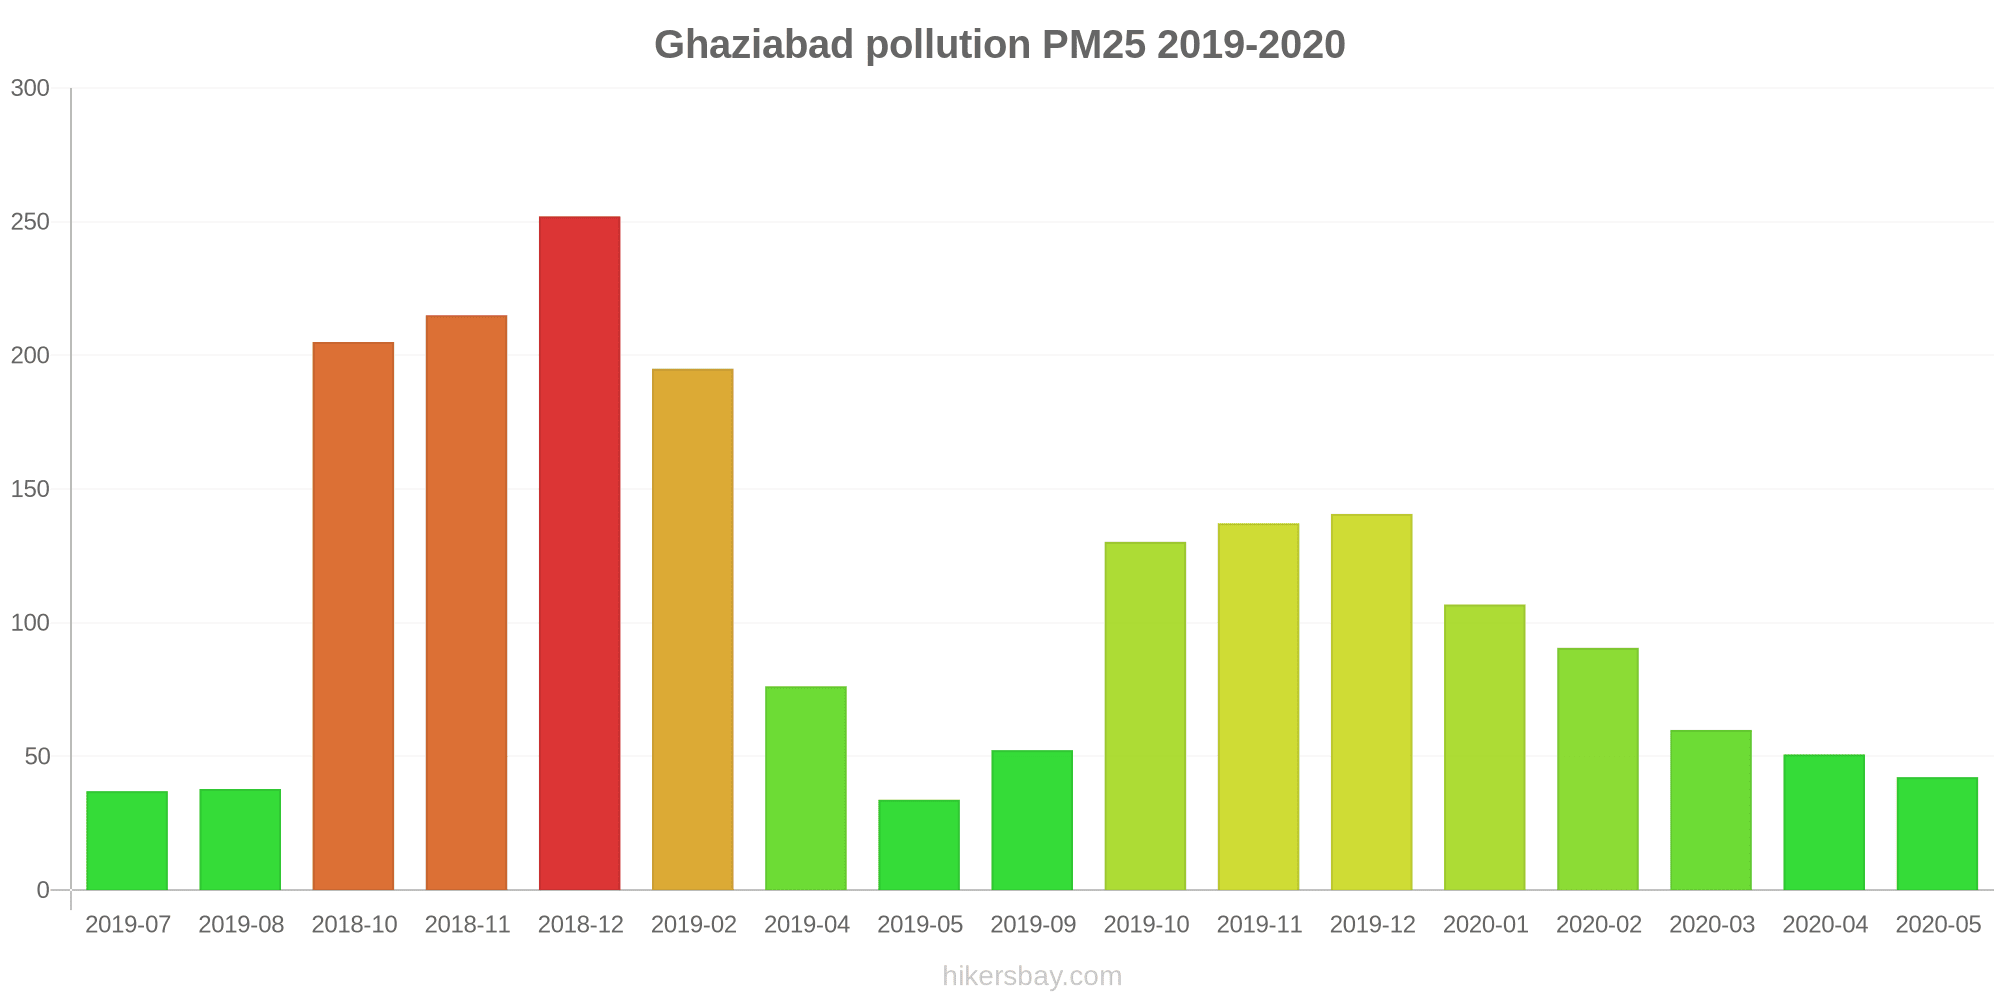
| index | 2020-05 | 2020-04 | 2020-03 | 2020-02 | 2020-01 | 2019-12 | 2019-11 | 2019-10 | 2019-09 | 2019-05 | 2019-04 | 2019-02 | 2018-12 | 2018-11 | 2018-10 | 2019-08 | 2019-07 |
|---|---|---|---|---|---|---|---|---|---|---|---|---|---|---|---|---|---|
| pm25 | 42 (Unhealthy for Sensitive Groups) | 51 (Unhealthy for Sensitive Groups) | 60 (Unhealthy) | 91 (Very Unhealthy) | 107 (Very Unhealthy) | 141 (Very bad Hazardous) | 137 (Very bad Hazardous) | 130 (Very bad Hazardous) | 52 (Unhealthy for Sensitive Groups) | 34 (Moderate) | 76 (Very Unhealthy) | 195 (Very bad Hazardous) | 252 (Very bad Hazardous) | 215 (Very bad Hazardous) | 205 (Very bad Hazardous) | 38 (Unhealthy for Sensitive Groups) | 37 (Unhealthy for Sensitive Groups) |
| pm10 | 112 (Very Unhealthy) | 142 (Very Unhealthy) | 124 (Very Unhealthy) | 163 (Very bad Hazardous) | 184 (Very bad Hazardous) | 274 (Very bad Hazardous) | 264 (Very bad Hazardous) | 247 (Very bad Hazardous) | 148 (Very Unhealthy) | 264 (Very bad Hazardous) | 380 (Very bad Hazardous) | 272 (Very bad Hazardous) | 313 (Very bad Hazardous) | 333 (Very bad Hazardous) | 344 (Very bad Hazardous) | 88 (Unhealthy) | 95 (Unhealthy) |
| no2 | 42 (Moderate) | 46 (Moderate) | 52 (Moderate) | 59 (Moderate) | 60 (Moderate) | 52 (Moderate) | 74 (Moderate) | 48 (Moderate) | 31 (Good) | 12 (Good) | 46 (Moderate) | 75 (Moderate) | 55 (Moderate) | 51 (Moderate) | 51 (Moderate) | 40 (Good) | 47 (Moderate) |
| so2 | 11 (Good) | 14 (Good) | 11 (Good) | 12 (Good) | 10 (Good) | 6.9 (Good) | 9.8 (Good) | 13 (Good) | 12 (Good) | 9.2 (Good) | 34 (Good) | 16 (Good) | 14 (Good) | 13 (Good) | 18 (Good) | 13 (Good) | 11 (Good) |
| o3 | 24 (Good) | 24 (Good) | 17 (Good) | 21 (Good) | 11 (Good) | 23 (Good) | 42 (Good) | 56 (Good) | 61 (Good) | 55 (Good) | 55 (Good) | 28 (Good) | 27 (Good) | 49 (Good) | 49 (Good) | 21 (Good) | 35 (Good) |
| co | 437 (Good) | 1 (Good) | 1 (Good) | 486 (Good) | 368 (Good) | 249 (Good) | 360 (Good) | 1 (Good) | 850 (Good) | 653 (Good) | 859 (Good) | 1 (Good) | 1 (Good) | 1 (Good) | 1 (Good) | 1 (Good) | 1 (Good) |
Green and Parks in the City
Ghaziabad 34%
Nepal: 32% Bangladesh: 33% Bhutan: 82% Sri Lanka: 59% Pakistan: 49%Pleasure of spending time in the city
Ghaziabad 20%
Nepal: 32% Bangladesh: 26% Bhutan: 61% Sri Lanka: 52% Pakistan: 43%Air Pollution
Ghaziabad 87%
Nepal: 76% Bangladesh: 78% Bhutan: 45% Sri Lanka: 53% Pakistan: 64%Garbage Disposal
Ghaziabad 22%
Nepal: 25% Bangladesh: 22% Bhutan: 47% Sri Lanka: 41% Pakistan: 34%Availability and quality of drinking water
Ghaziabad 36%
Nepal: 36% Bangladesh: 44% Bhutan: 64% Sri Lanka: 65% Pakistan: 44%Cleanliness and tidiness
Ghaziabad 26%
Nepal: 27% Bangladesh: 23% Bhutan: 57% Sri Lanka: 52% Pakistan: 40%Noise and Light pollution
Ghaziabad 65%
Nepal: 55% Bangladesh: 63% Bhutan: 55% Sri Lanka: 50% Pakistan: 59%Water Pollution
Ghaziabad 79%
Nepal: 76% Bangladesh: 74% Bhutan: 56% Sri Lanka: 57% Pakistan: 70%O3 13 (Good)
ozone (O3)PM2,5 166 (Very bad Hazardous)
particulate matter (PM2.5) dustPM10 219 (Very bad Hazardous)
particulate matter (PM10) suspended dustNO2 38 (Good)
nitrogen dioxide (NO2)SO2 29 (Good)
sulfur dioxide (SO2)PM2,5 224 (Very bad Hazardous)
particulate matter (PM2.5) dustNO2 70 (Moderate)
nitrogen dioxide (NO2)SO2 4.1 (Good)
sulfur dioxide (SO2)CO 2220 (Moderate)
carbon monoxide (CO)PM10 311 (Very bad Hazardous)
particulate matter (PM10) suspended dustO3 112 (Moderate)
ozone (O3)PM2,5 226 (Very bad Hazardous)
particulate matter (PM2.5) dustPM10 351 (Very bad Hazardous)
particulate matter (PM10) suspended dustNO2 78 (Moderate)
nitrogen dioxide (NO2)SO2 14 (Good)
sulfur dioxide (SO2)CO 2640 (Moderate)
carbon monoxide (CO)O3 10 (Good)
ozone (O3)Anand Vihar, Hapur - UPPCB
| index | 2022-10-31 |
|---|---|
| o3 | 13 |
| pm25 | 171 |
| pm10 | 227 |
| no2 | 35 |
| so2 | 29 |
Loni, Loni Dehat - UPPCB
| index | 2022-10-31 | 2022-10-26 |
|---|---|---|
| o3 | - | 112 |
| pm25 | 224 | - |
| no2 | 70 | - |
| so2 | 4.1 | - |
| co | 2220 | - |
| pm10 | 311 | - |
Sanjay Nagar, Ghaziabad - UPPCB
| index | 2022-10-31 |
|---|---|
| pm25 | 226 |
| pm10 | 351 |
| no2 | 78 |
| so2 | 14 |
| co | 2640 |
| o3 | 10 |
Anand Vihar, Hapur - UPPCB

| index | 2020-05 | 2020-04 | 2020-03 | 2020-02 | 2020-01 | 2019-12 | 2019-11 | 2019-10 | 2019-09 | 2019-05 | 2019-04 | 2019-02 | 2018-12 | 2018-11 | 2018-10 |
|---|---|---|---|---|---|---|---|---|---|---|---|---|---|---|---|
| pm25 | 31 | 41 | 44 | 50 | 54 | 60 | 71 | 93 | 60 | 34 | 53 | 195 | 252 | 215 | 205 |
| pm10 | 110 | 153 | 108 | 116 | 142 | 257 | 253 | 224 | 200 | 264 | 366 | 272 | 313 | 333 | 344 |
| so2 | 5.7 | 8.4 | 5.8 | 7.8 | 8.4 | 5.2 | 6.5 | 13 | 12 | 9.2 | 19 | 16 | 14 | 13 | 18 |
| co | 1 | 1 | 1 | 970 | 734 | 496 | 718 | 1 | 829 | 653 | 741 | 1 | 1 | 1 | 1 |
| o3 | 1.9 | 1.8 | 1.8 | 1.8 | 2 | 37 | 64 | 80 | 107 | 55 | 46 | 28 | 27 | 49 | 49 |
| no2 | 53 | 59 | 53 | 61 | 62 | 36 | 72 | 39 | 27 | 12 | 27 | 75 | 55 | 51 | 51 |
Sanjay Nagar, Ghaziabad - UPPCB

| index | 2020-05 | 2020-04 | 2020-03 | 2020-02 | 2020-01 | 2019-12 | 2019-11 | 2019-10 | 2019-09 | 2019-08 | 2019-07 | 2019-04 |
|---|---|---|---|---|---|---|---|---|---|---|---|---|
| pm25 | 53 | 61 | 76 | 131 | 160 | 221 | 203 | 168 | 45 | 38 | 37 | 100 |
| no2 | 31 | 34 | 51 | 58 | 58 | 67 | 76 | 56 | 34 | 40 | 47 | 65 |
| so2 | 17 | 20 | 16 | 15 | 13 | 8.6 | 13 | 13 | 13 | 13 | 11 | 48 |
| co | 872 | 1 | 1 | 1 | 1 | 1 | 1 | 1 | 870 | 1 | 1 | 977 |
| o3 | 47 | 47 | 32 | 40 | 20 | 8.5 | 19 | 32 | 15 | 21 | 35 | 64 |
| pm10 | 114 | 130 | 140 | 209 | 226 | 290 | 274 | 269 | 97 | 88 | 95 | 394 |