Air Pollution in Guntur: Real-time Air Quality Index and smog alert.
Pollution and air quality forecast for Guntur. Today is Wednesday, May 13, 2026. The following air pollution values have been recorded for Guntur:- particulate matter (PM10) suspended dust - 91 (Unhealthy)
- sulfur dioxide (SO2) - 6 (Good)
- particulate matter (PM2.5) dust - 57 (Unhealthy)
- carbon monoxide (CO) - 690 (Good)
- nitrogen dioxide (NO2) - 10 (Good)
- ozone (O3) - 12 (Good)

What is the air quality in Guntur today? Is the air polluted in Guntur?. Is there smog?
What is the level of PM10 today in Guntur? (particulate matter (PM10) suspended dust)
The current level of particulate matter PM10 in Guntur is:
91 (Unhealthy)
The highest PM10 values usually occur in month: 147 (May 2019).
The lowest value of particulate matter PM10 pollution in Guntur is usually recorded in: July (29).
What is the level of SO2 pollution? (sulfur dioxide (SO2))
6 (Good)
What is the current level of PM2.5 in Guntur? (particulate matter (PM2.5) dust)
Today's PM2.5 level is:
57 (Unhealthy)
For comparison, the highest level of PM2.5 in Guntur in the last 7 days was: 59 (Monday, October 31, 2022) and the lowest: 59 (Monday, October 31, 2022).
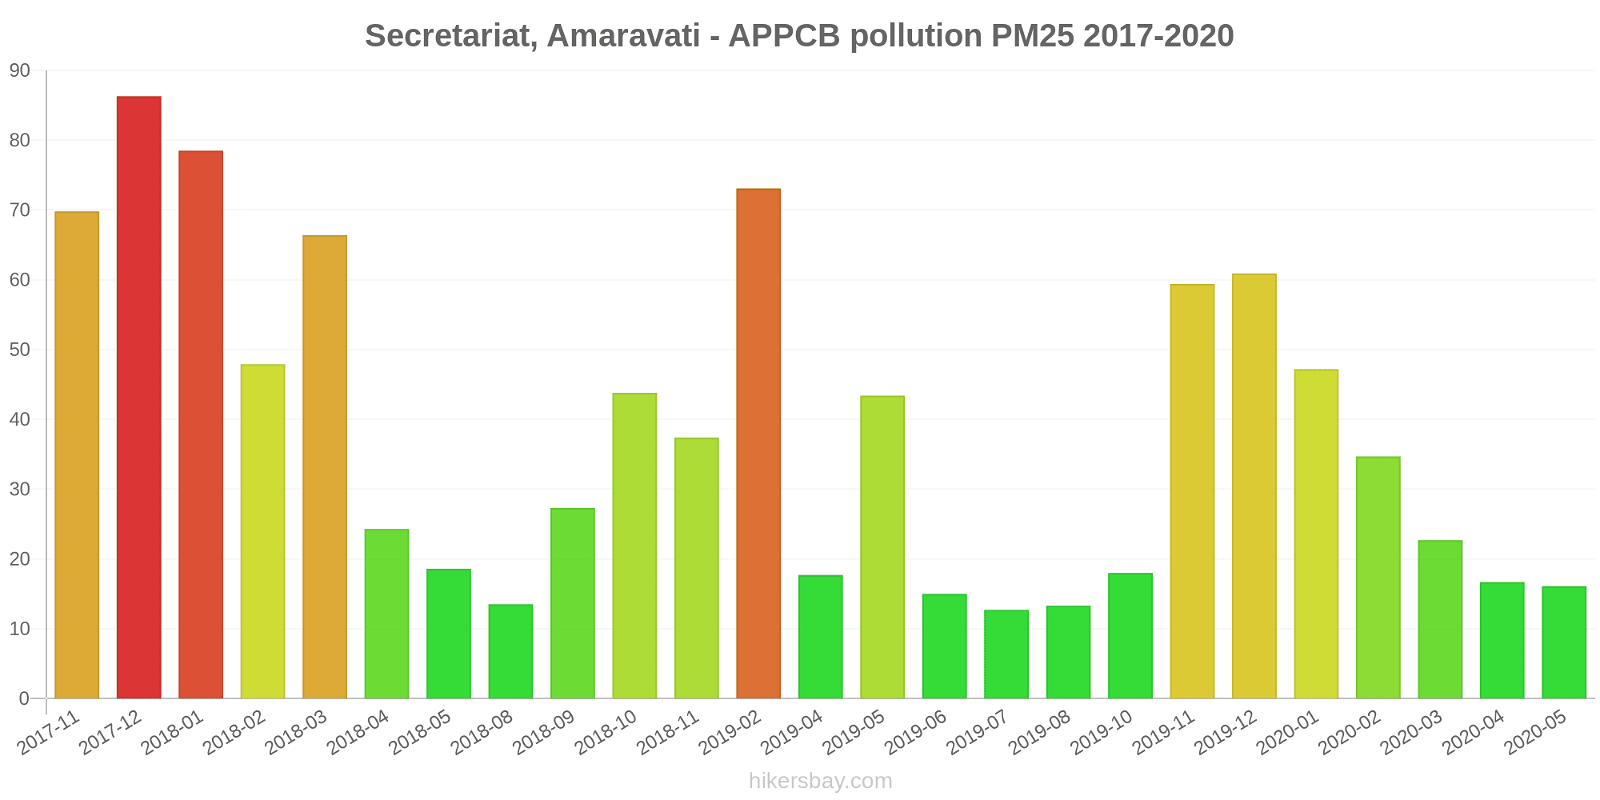
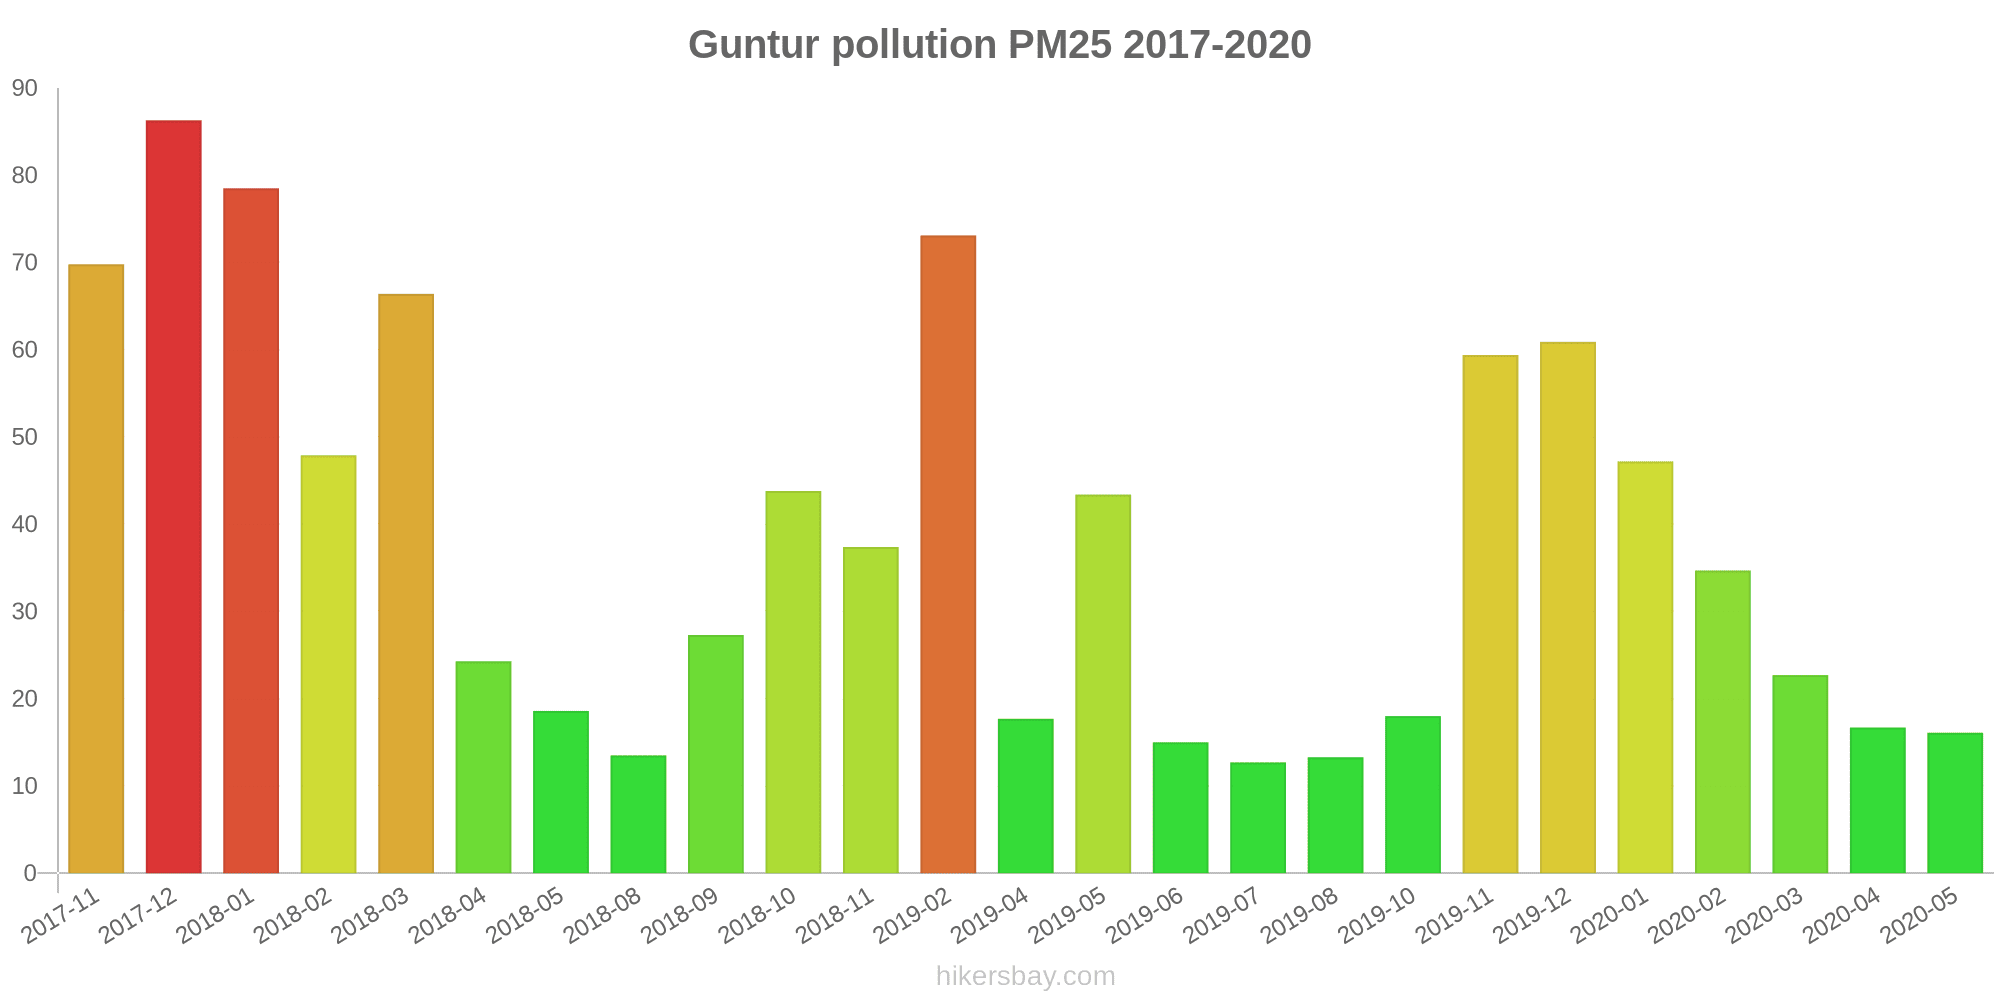
The highest PM2.5 values were recorded: 86 (December 2017).
The lowest level of particulate matter PM2.5 pollution occurs in month: July (13).
How high is the CO level? (carbon monoxide (CO))
690 (Good)
How high is the level of NO2? (nitrogen dioxide (NO2))
10 (Good)
How is the O3 level today in Guntur? (ozone (O3))
12 (Good)
Current data Monday, October 31, 2022, 2:00 AM
PM10 91 (Unhealthy)
SO2 6 (Good)
PM2,5 57 (Unhealthy)
CO 690 (Good)
NO2 10 (Good)
O3 12 (Good)
Data on air pollution from recent days in Guntur
index
2022-10-31
pm10
101
Unhealthy
so2
5
Good
pm25
59
Unhealthy
co
655
Good
no2
10
Good
o3
13
Good
data source »
Air pollution in Guntur from November 2017 to May 2020

index
2020-05
2020-04
2020-03
2020-02
2020-01
2019-12
2019-11
2019-10
2019-08
2019-07
2019-06
2019-05
2019-04
2019-02
2018-11
2018-10
2018-09
2018-08
2018-05
2018-04
2018-03
2018-02
2018-01
2017-12
2017-11
pm25
16 (Moderate)
17 (Moderate)
23 (Moderate)
35 (Moderate)
47 (Unhealthy for Sensitive Groups)
61 (Unhealthy)
59 (Unhealthy)
18 (Moderate)
13 (Moderate)
13 (Good)
15 (Moderate)
43 (Unhealthy for Sensitive Groups)
18 (Moderate)
73 (Unhealthy)
37 (Unhealthy for Sensitive Groups)
44 (Unhealthy for Sensitive Groups)
27 (Moderate)
14 (Moderate)
19 (Moderate)
24 (Moderate)
66 (Unhealthy)
48 (Unhealthy for Sensitive Groups)
79 (Very Unhealthy)
86 (Very Unhealthy)
70 (Unhealthy)
pm10
42 (Moderate)
37 (Moderate)
41 (Moderate)
61 (Unhealthy for Sensitive Groups)
73 (Unhealthy for Sensitive Groups)
94 (Unhealthy)
95 (Unhealthy)
35 (Moderate)
30 (Moderate)
29 (Moderate)
35 (Moderate)
147 (Very Unhealthy)
52 (Unhealthy for Sensitive Groups)
131 (Very Unhealthy)
85 (Unhealthy)
107 (Unhealthy)
66 (Unhealthy for Sensitive Groups)
35 (Moderate)
45 (Moderate)
48 (Moderate)
77 (Unhealthy for Sensitive Groups)
106 (Unhealthy)
139 (Very Unhealthy)
144 (Very Unhealthy)
113 (Very Unhealthy)
no2
4.8 (Good)
4.7 (Good)
6.9 (Good)
14 (Good)
14 (Good)
17 (Good)
16 (Good)
11 (Good)
8.3 (Good)
15 (Good)
26 (Good)
30 (Good)
17 (Good)
31 (Good)
50 (Moderate)
27 (Good)
22 (Good)
12 (Good)
11 (Good)
8.7 (Good)
18 (Good)
23 (Good)
41 (Moderate)
39 (Good)
23 (Good)
so2
12 (Good)
17 (Good)
26 (Good)
24 (Good)
23 (Good)
20 (Good)
21 (Good)
22 (Good)
23 (Good)
24 (Good)
22 (Good)
28 (Good)
13 (Good)
10 (Good)
24 (Good)
25 (Good)
19 (Good)
18 (Good)
90 (Moderate)
17 (Good)
14 (Good)
17 (Good)
20 (Good)
18 (Good)
35 (Good)
o3
28 (Good)
29 (Good)
35 (Good)
43 (Good)
44 (Good)
49 (Good)
52 (Good)
32 (Good)
28 (Good)
30 (Good)
39 (Good)
37 (Good)
27 (Good)
41 (Good)
30 (Good)
40 (Good)
34 (Good)
23 (Good)
46 (Good)
18 (Good)
15 (Good)
32 (Good)
68 (Good)
78 (Moderate)
129 (Unhealthy for Sensitive Groups)
co
- (Good)
- (Good)
490 (Good)
552 (Good)
655 (Good)
728 (Good)
809 (Good)
578 (Good)
417 (Good)
421 (Good)
461 (Good)
900 (Good)
417 (Good)
866 (Good)
894 (Good)
971 (Good)
1 (Good)
988 (Good)
559 (Good)
16 (Good)
36 (Good)
1 (Good)
1 (Good)
959 (Good)
565 (Good)
data source »
Quality of life in Guntur
Green and Parks in the City
Guntur
41%
Nepal: 32%
Bangladesh: 33%
Bhutan: 82%
Sri Lanka: 59%
Pakistan: 49%
particulate matter PM2.5
Guntur
40 (Unhealthy for Sensitive Groups)
Pleasure of spending time in the city
Guntur
53%
Nepal: 32%
Bangladesh: 26%
Bhutan: 61%
Sri Lanka: 52%
Pakistan: 43%
particulate matter PM10
Guntur
75 (Unhealthy for Sensitive Groups)
Air Pollution
Guntur
46%
Nepal: 76%
Bangladesh: 78%
Bhutan: 45%
Sri Lanka: 53%
Pakistan: 64%
Garbage Disposal
Guntur
49%
Nepal: 25%
Bangladesh: 22%
Bhutan: 47%
Sri Lanka: 41%
Pakistan: 34%
Availability and quality of drinking water
Guntur
60%
Nepal: 36%
Bangladesh: 44%
Bhutan: 64%
Sri Lanka: 65%
Pakistan: 44%
Cleanliness and tidiness
Guntur
39%
Nepal: 27%
Bangladesh: 23%
Bhutan: 57%
Sri Lanka: 52%
Pakistan: 40%
Noise and Light pollution
Guntur
53%
Nepal: 55%
Bangladesh: 63%
Bhutan: 55%
Sri Lanka: 50%
Pakistan: 59%
Water Pollution
Guntur
60%
Nepal: 76%
Bangladesh: 74%
Bhutan: 56%
Sri Lanka: 57%
Pakistan: 70%
Source: Numbeo
Secretariat, Amaravati - APPCB
Monday, October 31, 2022, 2:00 AM
PM10 91 (Unhealthy)
particulate matter (PM10) suspended dust
SO2 6.1 (Good)
sulfur dioxide (SO2)
PM2,5 57 (Unhealthy)
particulate matter (PM2.5) dust
CO 690 (Good)
carbon monoxide (CO)
NO2 9.7 (Good)
nitrogen dioxide (NO2)
O3 12 (Good)
ozone (O3)
Secretariat, Amaravati - APPCB
index
2022-10-31
pm10
101
so2
5
pm25
59
co
655
no2
10
o3
13
Secretariat, Amaravati - APPCB
2017-11 2020-05
index
2020-05
2020-04
2020-03
2020-02
2020-01
2019-12
2019-11
2019-10
2019-08
2019-07
2019-06
2019-05
2019-04
2019-02
2018-11
2018-10
2018-09
2018-08
2018-05
2018-04
2018-03
2018-02
2018-01
2017-12
2017-11
no2
4.8
4.7
6.9
14
14
17
16
11
8.3
15
26
30
17
31
50
27
22
12
11
8.7
18
23
41
39
23
so2
12
17
26
24
23
20
21
22
23
24
22
28
13
10
24
25
19
18
90
17
14
17
20
18
35
co
-
-
490
552
655
728
809
578
417
421
461
900
417
866
894
971
1
988
559
16
36
1
1
959
565
o3
28
29
35
43
44
49
52
32
28
30
39
37
27
41
30
40
34
23
46
18
15
32
68
78
129
pm25
16
17
23
35
47
61
59
18
13
13
15
43
18
73
37
44
27
14
19
24
66
48
79
86
70
pm10
42
37
41
61
73
94
95
35
30
29
35
147
52
131
85
107
66
35
45
48
77
106
139
144
113
* Pollution data source:
https://openaq.org
(caaqm)
The data is licensed under CC-By 4.0
PM10 91 (Unhealthy)
SO2 6 (Good)
PM2,5 57 (Unhealthy)
CO 690 (Good)
NO2 10 (Good)
O3 12 (Good)
Data on air pollution from recent days in Guntur
| index | 2022-10-31 |
|---|---|
| pm10 | 101 Unhealthy |
| so2 | 5 Good |
| pm25 | 59 Unhealthy |
| co | 655 Good |
| no2 | 10 Good |
| o3 | 13 Good |
| index | 2020-05 | 2020-04 | 2020-03 | 2020-02 | 2020-01 | 2019-12 | 2019-11 | 2019-10 | 2019-08 | 2019-07 | 2019-06 | 2019-05 | 2019-04 | 2019-02 | 2018-11 | 2018-10 | 2018-09 | 2018-08 | 2018-05 | 2018-04 | 2018-03 | 2018-02 | 2018-01 | 2017-12 | 2017-11 |
|---|---|---|---|---|---|---|---|---|---|---|---|---|---|---|---|---|---|---|---|---|---|---|---|---|---|
| pm25 | 16 (Moderate) | 17 (Moderate) | 23 (Moderate) | 35 (Moderate) | 47 (Unhealthy for Sensitive Groups) | 61 (Unhealthy) | 59 (Unhealthy) | 18 (Moderate) | 13 (Moderate) | 13 (Good) | 15 (Moderate) | 43 (Unhealthy for Sensitive Groups) | 18 (Moderate) | 73 (Unhealthy) | 37 (Unhealthy for Sensitive Groups) | 44 (Unhealthy for Sensitive Groups) | 27 (Moderate) | 14 (Moderate) | 19 (Moderate) | 24 (Moderate) | 66 (Unhealthy) | 48 (Unhealthy for Sensitive Groups) | 79 (Very Unhealthy) | 86 (Very Unhealthy) | 70 (Unhealthy) |
| pm10 | 42 (Moderate) | 37 (Moderate) | 41 (Moderate) | 61 (Unhealthy for Sensitive Groups) | 73 (Unhealthy for Sensitive Groups) | 94 (Unhealthy) | 95 (Unhealthy) | 35 (Moderate) | 30 (Moderate) | 29 (Moderate) | 35 (Moderate) | 147 (Very Unhealthy) | 52 (Unhealthy for Sensitive Groups) | 131 (Very Unhealthy) | 85 (Unhealthy) | 107 (Unhealthy) | 66 (Unhealthy for Sensitive Groups) | 35 (Moderate) | 45 (Moderate) | 48 (Moderate) | 77 (Unhealthy for Sensitive Groups) | 106 (Unhealthy) | 139 (Very Unhealthy) | 144 (Very Unhealthy) | 113 (Very Unhealthy) |
| no2 | 4.8 (Good) | 4.7 (Good) | 6.9 (Good) | 14 (Good) | 14 (Good) | 17 (Good) | 16 (Good) | 11 (Good) | 8.3 (Good) | 15 (Good) | 26 (Good) | 30 (Good) | 17 (Good) | 31 (Good) | 50 (Moderate) | 27 (Good) | 22 (Good) | 12 (Good) | 11 (Good) | 8.7 (Good) | 18 (Good) | 23 (Good) | 41 (Moderate) | 39 (Good) | 23 (Good) |
| so2 | 12 (Good) | 17 (Good) | 26 (Good) | 24 (Good) | 23 (Good) | 20 (Good) | 21 (Good) | 22 (Good) | 23 (Good) | 24 (Good) | 22 (Good) | 28 (Good) | 13 (Good) | 10 (Good) | 24 (Good) | 25 (Good) | 19 (Good) | 18 (Good) | 90 (Moderate) | 17 (Good) | 14 (Good) | 17 (Good) | 20 (Good) | 18 (Good) | 35 (Good) |
| o3 | 28 (Good) | 29 (Good) | 35 (Good) | 43 (Good) | 44 (Good) | 49 (Good) | 52 (Good) | 32 (Good) | 28 (Good) | 30 (Good) | 39 (Good) | 37 (Good) | 27 (Good) | 41 (Good) | 30 (Good) | 40 (Good) | 34 (Good) | 23 (Good) | 46 (Good) | 18 (Good) | 15 (Good) | 32 (Good) | 68 (Good) | 78 (Moderate) | 129 (Unhealthy for Sensitive Groups) |
| co | - (Good) | - (Good) | 490 (Good) | 552 (Good) | 655 (Good) | 728 (Good) | 809 (Good) | 578 (Good) | 417 (Good) | 421 (Good) | 461 (Good) | 900 (Good) | 417 (Good) | 866 (Good) | 894 (Good) | 971 (Good) | 1 (Good) | 988 (Good) | 559 (Good) | 16 (Good) | 36 (Good) | 1 (Good) | 1 (Good) | 959 (Good) | 565 (Good) |
Green and Parks in the City
Guntur 41%
Nepal: 32% Bangladesh: 33% Bhutan: 82% Sri Lanka: 59% Pakistan: 49%particulate matter PM2.5
Guntur 40 (Unhealthy for Sensitive Groups)
Pleasure of spending time in the city
Guntur 53%
Nepal: 32% Bangladesh: 26% Bhutan: 61% Sri Lanka: 52% Pakistan: 43%particulate matter PM10
Guntur 75 (Unhealthy for Sensitive Groups)
Air Pollution
Guntur 46%
Nepal: 76% Bangladesh: 78% Bhutan: 45% Sri Lanka: 53% Pakistan: 64%Garbage Disposal
Guntur 49%
Nepal: 25% Bangladesh: 22% Bhutan: 47% Sri Lanka: 41% Pakistan: 34%Availability and quality of drinking water
Guntur 60%
Nepal: 36% Bangladesh: 44% Bhutan: 64% Sri Lanka: 65% Pakistan: 44%Cleanliness and tidiness
Guntur 39%
Nepal: 27% Bangladesh: 23% Bhutan: 57% Sri Lanka: 52% Pakistan: 40%Noise and Light pollution
Guntur 53%
Nepal: 55% Bangladesh: 63% Bhutan: 55% Sri Lanka: 50% Pakistan: 59%Water Pollution
Guntur 60%
Nepal: 76% Bangladesh: 74% Bhutan: 56% Sri Lanka: 57% Pakistan: 70%PM10 91 (Unhealthy)
particulate matter (PM10) suspended dustSO2 6.1 (Good)
sulfur dioxide (SO2)PM2,5 57 (Unhealthy)
particulate matter (PM2.5) dustCO 690 (Good)
carbon monoxide (CO)NO2 9.7 (Good)
nitrogen dioxide (NO2)O3 12 (Good)
ozone (O3)Secretariat, Amaravati - APPCB
| index | 2022-10-31 |
|---|---|
| pm10 | 101 |
| so2 | 5 |
| pm25 | 59 |
| co | 655 |
| no2 | 10 |
| o3 | 13 |
Secretariat, Amaravati - APPCB

| index | 2020-05 | 2020-04 | 2020-03 | 2020-02 | 2020-01 | 2019-12 | 2019-11 | 2019-10 | 2019-08 | 2019-07 | 2019-06 | 2019-05 | 2019-04 | 2019-02 | 2018-11 | 2018-10 | 2018-09 | 2018-08 | 2018-05 | 2018-04 | 2018-03 | 2018-02 | 2018-01 | 2017-12 | 2017-11 |
|---|---|---|---|---|---|---|---|---|---|---|---|---|---|---|---|---|---|---|---|---|---|---|---|---|---|
| no2 | 4.8 | 4.7 | 6.9 | 14 | 14 | 17 | 16 | 11 | 8.3 | 15 | 26 | 30 | 17 | 31 | 50 | 27 | 22 | 12 | 11 | 8.7 | 18 | 23 | 41 | 39 | 23 |
| so2 | 12 | 17 | 26 | 24 | 23 | 20 | 21 | 22 | 23 | 24 | 22 | 28 | 13 | 10 | 24 | 25 | 19 | 18 | 90 | 17 | 14 | 17 | 20 | 18 | 35 |
| co | - | - | 490 | 552 | 655 | 728 | 809 | 578 | 417 | 421 | 461 | 900 | 417 | 866 | 894 | 971 | 1 | 988 | 559 | 16 | 36 | 1 | 1 | 959 | 565 |
| o3 | 28 | 29 | 35 | 43 | 44 | 49 | 52 | 32 | 28 | 30 | 39 | 37 | 27 | 41 | 30 | 40 | 34 | 23 | 46 | 18 | 15 | 32 | 68 | 78 | 129 |
| pm25 | 16 | 17 | 23 | 35 | 47 | 61 | 59 | 18 | 13 | 13 | 15 | 43 | 18 | 73 | 37 | 44 | 27 | 14 | 19 | 24 | 66 | 48 | 79 | 86 | 70 |
| pm10 | 42 | 37 | 41 | 61 | 73 | 94 | 95 | 35 | 30 | 29 | 35 | 147 | 52 | 131 | 85 | 107 | 66 | 35 | 45 | 48 | 77 | 106 | 139 | 144 | 113 |