Air Pollution in Hastings: Real-time Air Quality Index and smog alert.
Pollution and air quality forecast for Hastings. Today is Wednesday, May 13, 2026. The following air pollution values have been recorded for Hastings:- particulate matter (PM2.5) dust - 52 (Unhealthy for Sensitive Groups)
- particulate matter (PM10) suspended dust - 115 (Very Unhealthy)
- nitrogen dioxide (NO2) - 26 (Good)
- sulfur dioxide (SO2) - 10 (Good)
- carbon monoxide (CO) - 575 (Good)
- ozone (O3) - 16 (Good)

What is the air quality in Hastings today? Is the air polluted in Hastings?. Is there smog?
What is the current level of PM2.5 in Hastings? (particulate matter (PM2.5) dust)
Today's PM2.5 level is:
52 (Unhealthy for Sensitive Groups)
For comparison, the highest level of PM2.5 in Hastings in the last 7 days was: 54 (Monday, October 31, 2022) and the lowest: 54 (Monday, October 31, 2022).
The highest PM2.5 values were recorded: 142 (February 2019).
The lowest level of particulate matter PM2.5 pollution occurs in month: May (13).
What is the level of PM10 today in Hastings? (particulate matter (PM10) suspended dust)
The current level of particulate matter PM10 in Hastings is:
115 (Very Unhealthy)
The highest PM10 values usually occur in month: 245 (February 2019).
The lowest value of particulate matter PM10 pollution in Hastings is usually recorded in: May (25).
How high is the level of NO2? (nitrogen dioxide (NO2))
26 (Good)
What is the level of SO2 pollution? (sulfur dioxide (SO2))
10 (Good)
How high is the CO level? (carbon monoxide (CO))
575 (Good)
How is the O3 level today in Hastings? (ozone (O3))
16 (Good)
Current data Monday, October 31, 2022, 1:45 AM
PM2,5 52 (Unhealthy for Sensitive Groups)
PM10 115 (Very Unhealthy)
NO2 26 (Good)
SO2 10 (Good)
CO 575 (Good)
O3 16 (Good)
Data on air pollution from recent days in Hastings
index
2022-10-31
pm25
54
Unhealthy for Sensitive Groups
pm10
116
Very Unhealthy
no2
25
Good
so2
10
Good
co
513
Good
o3
13
Good
data source »
Air pollution in Hastings from April 2018 to May 2020

index
2020-05
2020-04
2020-03
2020-02
2020-01
2019-12
2019-11
2019-10
2019-09
2019-08
2019-07
2019-06
2019-05
2019-04
2019-02
2018-11
2018-10
2018-09
2018-08
2018-05
2018-04
pm25
19 (Moderate)
26 (Moderate)
50 (Unhealthy for Sensitive Groups)
80 (Very Unhealthy)
110 (Very Unhealthy)
100 (Very Unhealthy)
104 (Very Unhealthy)
64 (Unhealthy)
21 (Moderate)
25 (Moderate)
26 (Moderate)
31 (Moderate)
13 (Moderate)
24 (Moderate)
142 (Very bad Hazardous)
112 (Very bad Hazardous)
68 (Unhealthy)
38 (Unhealthy for Sensitive Groups)
17 (Moderate)
19 (Moderate)
24 (Moderate)
pm10
39 (Moderate)
43 (Moderate)
91 (Unhealthy)
158 (Very bad Hazardous)
206 (Very bad Hazardous)
189 (Very bad Hazardous)
200 (Very bad Hazardous)
95 (Unhealthy)
41 (Moderate)
43 (Moderate)
49 (Moderate)
60 (Unhealthy for Sensitive Groups)
25 (Moderate)
48 (Moderate)
245 (Very bad Hazardous)
165 (Very bad Hazardous)
113 (Very Unhealthy)
65 (Unhealthy for Sensitive Groups)
36 (Moderate)
50 (Unhealthy for Sensitive Groups)
54 (Unhealthy for Sensitive Groups)
no2
12 (Good)
11 (Good)
43 (Moderate)
75 (Moderate)
71 (Moderate)
53 (Moderate)
77 (Moderate)
40 (Good)
24 (Good)
23 (Good)
17 (Good)
16 (Good)
19 (Good)
19 (Good)
123 (Unhealthy for Sensitive Groups)
68 (Moderate)
48 (Moderate)
36 (Good)
29 (Good)
30 (Good)
32 (Good)
so2
6.1 (Good)
8 (Good)
12 (Good)
15 (Good)
10 (Good)
11 (Good)
7.2 (Good)
4.9 (Good)
5.2 (Good)
4.1 (Good)
6.7 (Good)
2.5 (Good)
2.1 (Good)
5.8 (Good)
30 (Good)
12 (Good)
7.7 (Good)
4.3 (Good)
1.6 (Good)
5.5 (Good)
8.4 (Good)
co
477 (Good)
539 (Good)
307 (Good)
719 (Good)
1 (Good)
494 (Good)
1.5 (Good)
319 (Good)
201 (Good)
202 (Good)
162 (Good)
296 (Good)
568 (Good)
597 (Good)
1 (Good)
1 (Good)
1 (Good)
1 (Good)
1 (Good)
1 (Good)
1 (Good)
o3
35 (Good)
48 (Good)
58 (Good)
48 (Good)
35 (Good)
38 (Good)
33 (Good)
28 (Good)
23 (Good)
23 (Good)
34 (Good)
29 (Good)
18 (Good)
17 (Good)
31 (Good)
32 (Good)
32 (Good)
19 (Good)
8.8 (Good)
34 (Good)
45 (Good)
data source »
Fort William, Kolkata - WBPCB
Monday, October 31, 2022, 1:45 AM
PM2,5 36 (Unhealthy for Sensitive Groups)
particulate matter (PM2.5) dust
PM10 104 (Unhealthy)
particulate matter (PM10) suspended dust
NO2 31 (Good)
nitrogen dioxide (NO2)
SO2 8.9 (Good)
sulfur dioxide (SO2)
CO 540 (Good)
carbon monoxide (CO)
O3 12 (Good)
ozone (O3)
Victoria, Kolkata - WBPCB
Monday, October 31, 2022, 1:45 AM
PM10 126 (Very Unhealthy)
particulate matter (PM10) suspended dust
SO2 10 (Good)
sulfur dioxide (SO2)
PM2,5 68 (Unhealthy)
particulate matter (PM2.5) dust
CO 610 (Good)
carbon monoxide (CO)
NO2 21 (Good)
nitrogen dioxide (NO2)
O3 20 (Good)
ozone (O3)
Fort William, Kolkata - WBPCB
index
2022-10-31
pm25
36
pm10
104
no2
31
so2
8.9
co
540
o3
12
Victoria, Kolkata - WBPCB
index
2022-10-31
pm10
129
so2
10
pm25
72
co
485
no2
19
o3
15
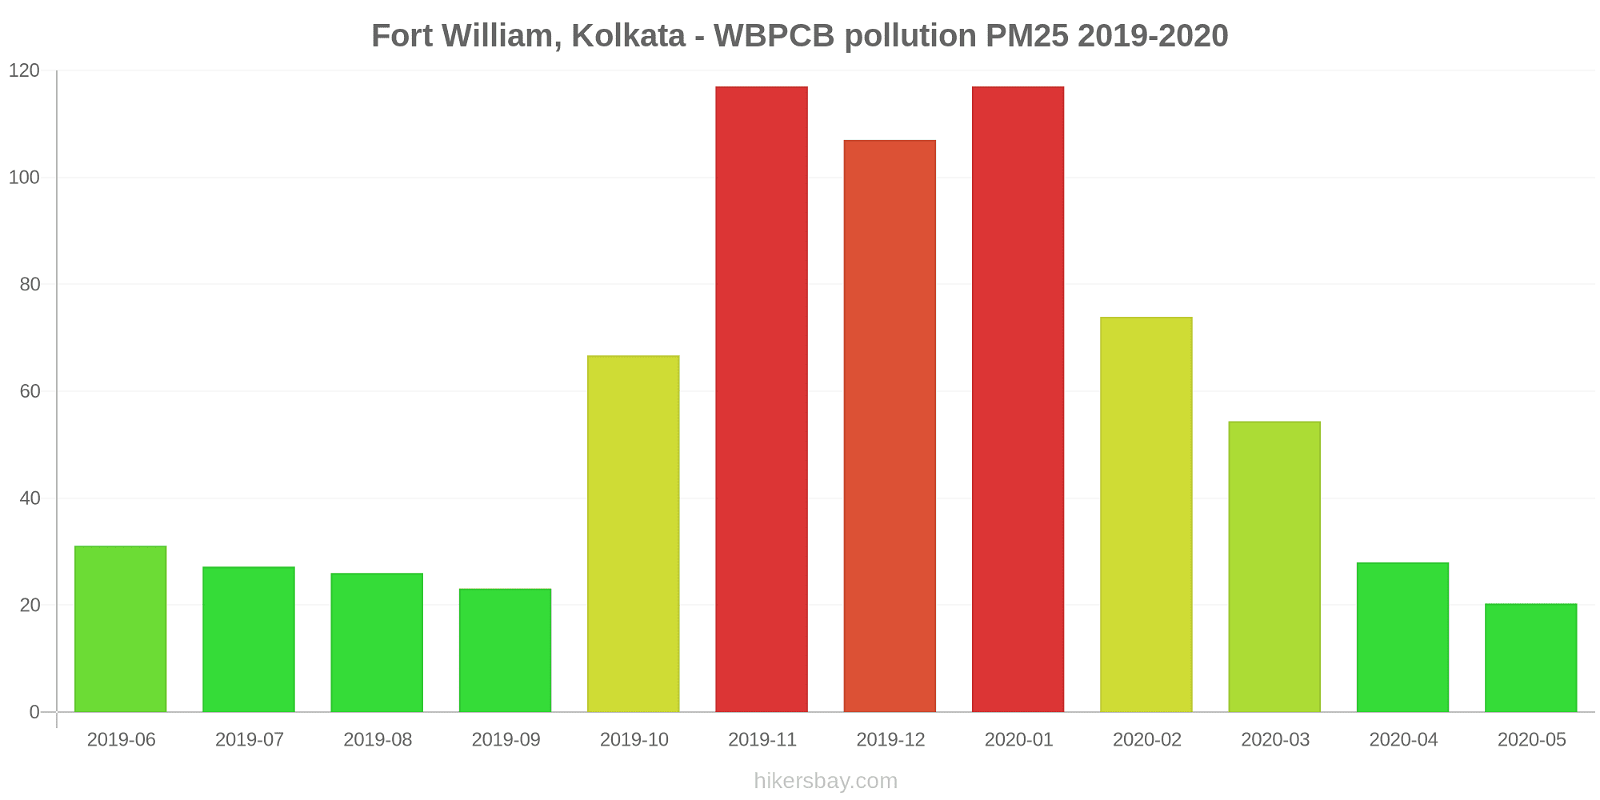
Fort William, Kolkata - WBPCB
2019-06 2020-05
index
2020-05
2020-04
2020-03
2020-02
2020-01
2019-12
2019-11
2019-10
2019-09
2019-08
2019-07
2019-06
pm25
20
28
54
74
117
107
117
67
23
26
27
31
pm10
44
46
89
146
217
196
218
102
41
46
54
60
no2
11
11
41
75
71
57
64
30
21
22
12
16
so2
5.8
6.3
9.7
13
11
11
7
5.3
5.4
4.5
7.3
2.5
co
337
368
613
974
1
985
1
637
401
402
323
296
o3
39
48
43
40
34
34
29
29
21
18
30
29
Victoria, Kolkata - WBPCB
2018-04 2020-05

index
2020-05
2020-04
2020-03
2020-02
2020-01
2019-12
2019-11
2019-10
2019-09
2019-08
2019-07
2019-05
2019-04
2019-02
2018-11
2018-10
2018-09
2018-08
2018-05
2018-04
pm25
18
23
46
85
102
94
91
61
19
23
25
13
24
142
112
68
38
17
19
24
pm10
34
41
93
169
195
181
182
89
41
40
44
25
48
245
165
113
65
36
50
54
no2
13
11
45
76
71
50
90
49
28
23
21
19
19
123
68
48
36
29
30
32
so2
6.4
9.6
14
16
9.8
11
7.4
4.5
4.9
3.8
6.2
2.1
5.8
30
12
7.7
4.3
1.6
5.5
8.4
co
617
710
1
464
1
2
2
1
1
1
1
568
597
1
1
1
1
1
1
1
o3
31
47
73
55
37
41
37
27
25
27
37
18
17
31
32
32
19
8.8
34
45
* Pollution data source:
https://openaq.org
(caaqm)
The data is licensed under CC-By 4.0
PM2,5 52 (Unhealthy for Sensitive Groups)
PM10 115 (Very Unhealthy)
NO2 26 (Good)
SO2 10 (Good)
CO 575 (Good)
O3 16 (Good)
Data on air pollution from recent days in Hastings
| index | 2022-10-31 |
|---|---|
| pm25 | 54 Unhealthy for Sensitive Groups |
| pm10 | 116 Very Unhealthy |
| no2 | 25 Good |
| so2 | 10 Good |
| co | 513 Good |
| o3 | 13 Good |
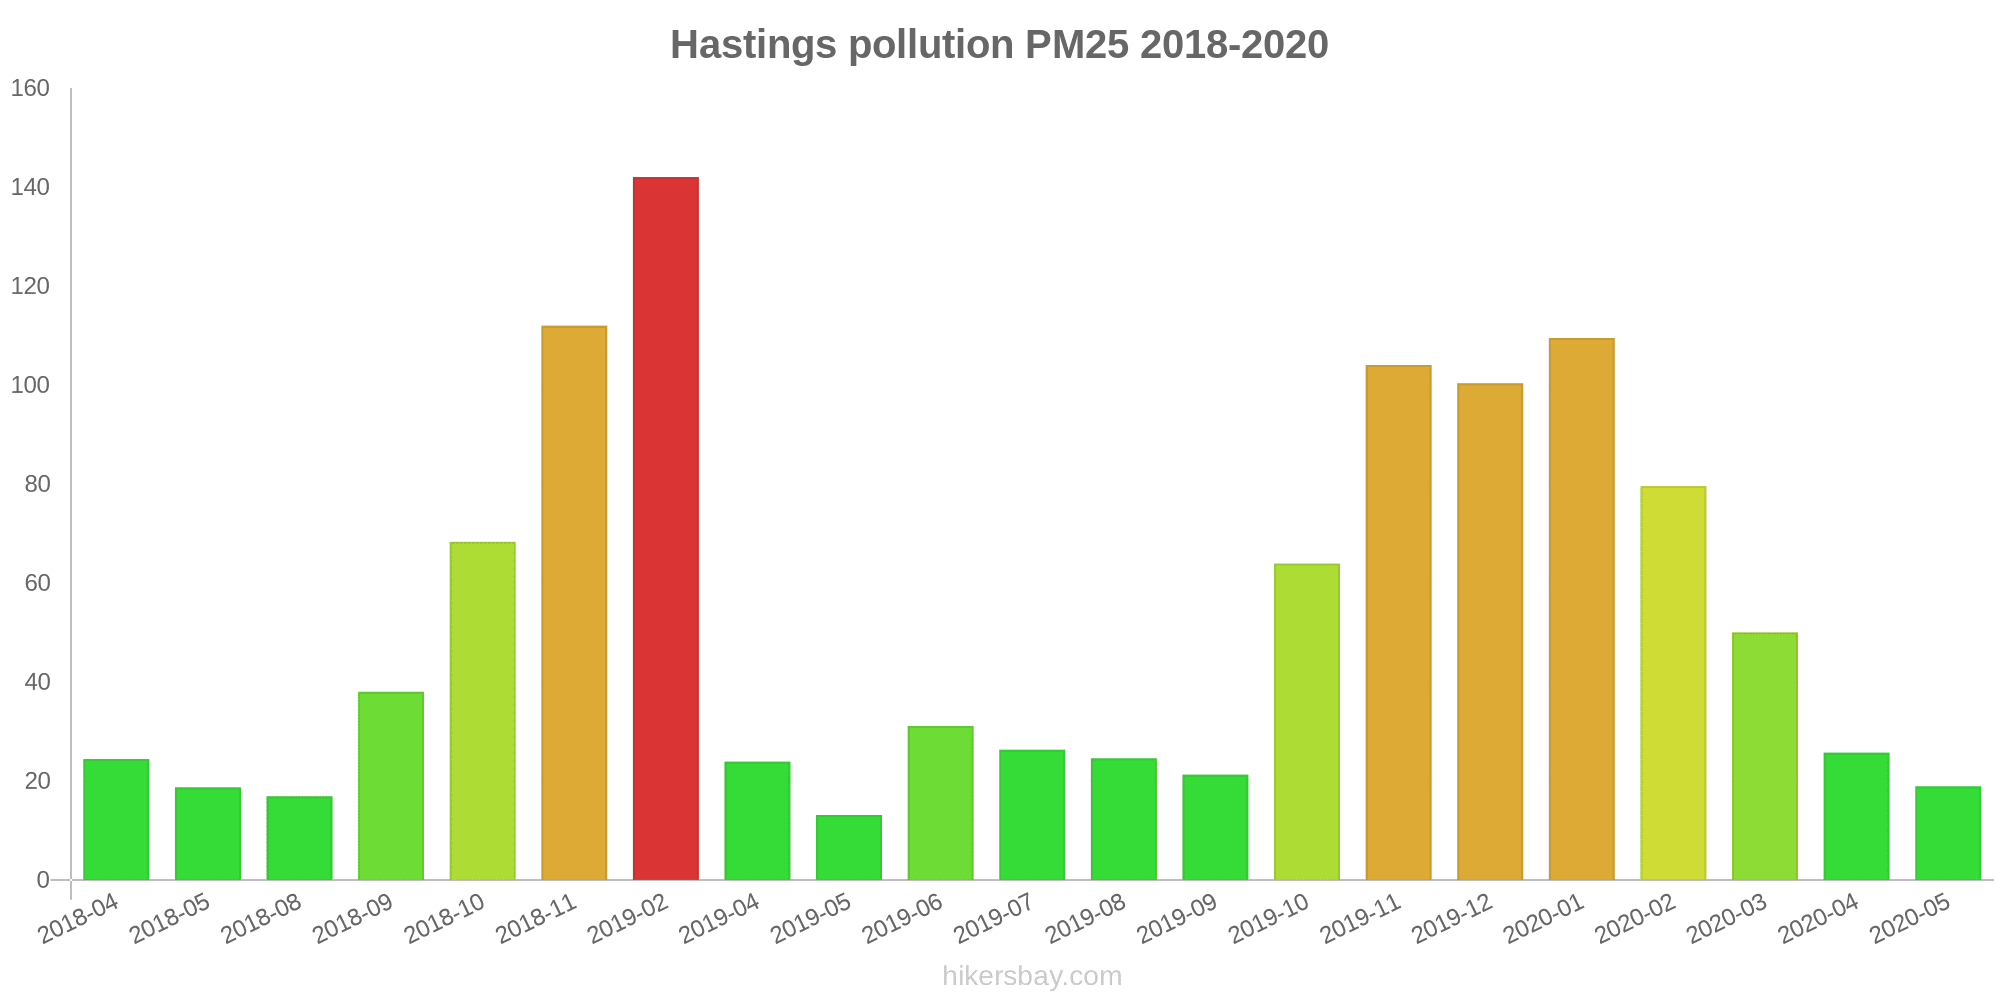
| index | 2020-05 | 2020-04 | 2020-03 | 2020-02 | 2020-01 | 2019-12 | 2019-11 | 2019-10 | 2019-09 | 2019-08 | 2019-07 | 2019-06 | 2019-05 | 2019-04 | 2019-02 | 2018-11 | 2018-10 | 2018-09 | 2018-08 | 2018-05 | 2018-04 |
|---|---|---|---|---|---|---|---|---|---|---|---|---|---|---|---|---|---|---|---|---|---|
| pm25 | 19 (Moderate) | 26 (Moderate) | 50 (Unhealthy for Sensitive Groups) | 80 (Very Unhealthy) | 110 (Very Unhealthy) | 100 (Very Unhealthy) | 104 (Very Unhealthy) | 64 (Unhealthy) | 21 (Moderate) | 25 (Moderate) | 26 (Moderate) | 31 (Moderate) | 13 (Moderate) | 24 (Moderate) | 142 (Very bad Hazardous) | 112 (Very bad Hazardous) | 68 (Unhealthy) | 38 (Unhealthy for Sensitive Groups) | 17 (Moderate) | 19 (Moderate) | 24 (Moderate) |
| pm10 | 39 (Moderate) | 43 (Moderate) | 91 (Unhealthy) | 158 (Very bad Hazardous) | 206 (Very bad Hazardous) | 189 (Very bad Hazardous) | 200 (Very bad Hazardous) | 95 (Unhealthy) | 41 (Moderate) | 43 (Moderate) | 49 (Moderate) | 60 (Unhealthy for Sensitive Groups) | 25 (Moderate) | 48 (Moderate) | 245 (Very bad Hazardous) | 165 (Very bad Hazardous) | 113 (Very Unhealthy) | 65 (Unhealthy for Sensitive Groups) | 36 (Moderate) | 50 (Unhealthy for Sensitive Groups) | 54 (Unhealthy for Sensitive Groups) |
| no2 | 12 (Good) | 11 (Good) | 43 (Moderate) | 75 (Moderate) | 71 (Moderate) | 53 (Moderate) | 77 (Moderate) | 40 (Good) | 24 (Good) | 23 (Good) | 17 (Good) | 16 (Good) | 19 (Good) | 19 (Good) | 123 (Unhealthy for Sensitive Groups) | 68 (Moderate) | 48 (Moderate) | 36 (Good) | 29 (Good) | 30 (Good) | 32 (Good) |
| so2 | 6.1 (Good) | 8 (Good) | 12 (Good) | 15 (Good) | 10 (Good) | 11 (Good) | 7.2 (Good) | 4.9 (Good) | 5.2 (Good) | 4.1 (Good) | 6.7 (Good) | 2.5 (Good) | 2.1 (Good) | 5.8 (Good) | 30 (Good) | 12 (Good) | 7.7 (Good) | 4.3 (Good) | 1.6 (Good) | 5.5 (Good) | 8.4 (Good) |
| co | 477 (Good) | 539 (Good) | 307 (Good) | 719 (Good) | 1 (Good) | 494 (Good) | 1.5 (Good) | 319 (Good) | 201 (Good) | 202 (Good) | 162 (Good) | 296 (Good) | 568 (Good) | 597 (Good) | 1 (Good) | 1 (Good) | 1 (Good) | 1 (Good) | 1 (Good) | 1 (Good) | 1 (Good) |
| o3 | 35 (Good) | 48 (Good) | 58 (Good) | 48 (Good) | 35 (Good) | 38 (Good) | 33 (Good) | 28 (Good) | 23 (Good) | 23 (Good) | 34 (Good) | 29 (Good) | 18 (Good) | 17 (Good) | 31 (Good) | 32 (Good) | 32 (Good) | 19 (Good) | 8.8 (Good) | 34 (Good) | 45 (Good) |
PM2,5 36 (Unhealthy for Sensitive Groups)
particulate matter (PM2.5) dustPM10 104 (Unhealthy)
particulate matter (PM10) suspended dustNO2 31 (Good)
nitrogen dioxide (NO2)SO2 8.9 (Good)
sulfur dioxide (SO2)CO 540 (Good)
carbon monoxide (CO)O3 12 (Good)
ozone (O3)PM10 126 (Very Unhealthy)
particulate matter (PM10) suspended dustSO2 10 (Good)
sulfur dioxide (SO2)PM2,5 68 (Unhealthy)
particulate matter (PM2.5) dustCO 610 (Good)
carbon monoxide (CO)NO2 21 (Good)
nitrogen dioxide (NO2)O3 20 (Good)
ozone (O3)Fort William, Kolkata - WBPCB
| index | 2022-10-31 |
|---|---|
| pm25 | 36 |
| pm10 | 104 |
| no2 | 31 |
| so2 | 8.9 |
| co | 540 |
| o3 | 12 |
Victoria, Kolkata - WBPCB
| index | 2022-10-31 |
|---|---|
| pm10 | 129 |
| so2 | 10 |
| pm25 | 72 |
| co | 485 |
| no2 | 19 |
| o3 | 15 |
Fort William, Kolkata - WBPCB
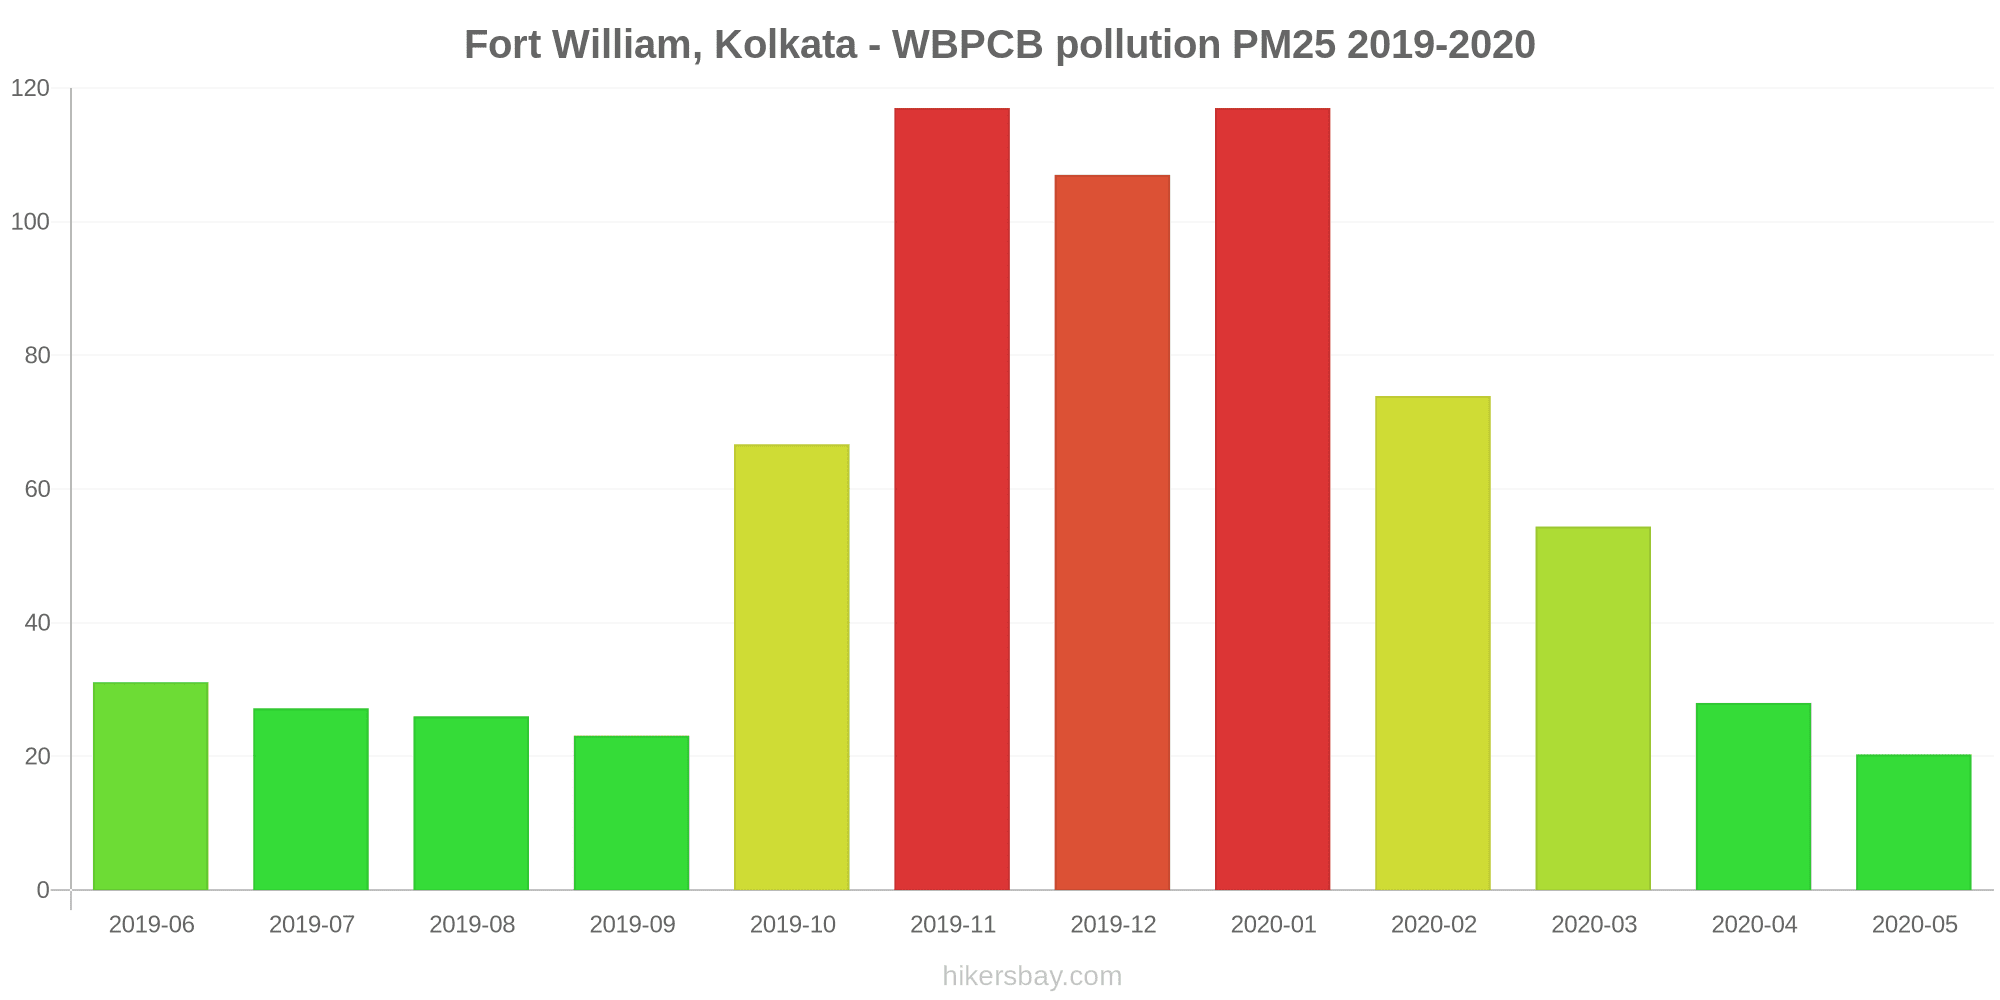
| index | 2020-05 | 2020-04 | 2020-03 | 2020-02 | 2020-01 | 2019-12 | 2019-11 | 2019-10 | 2019-09 | 2019-08 | 2019-07 | 2019-06 |
|---|---|---|---|---|---|---|---|---|---|---|---|---|
| pm25 | 20 | 28 | 54 | 74 | 117 | 107 | 117 | 67 | 23 | 26 | 27 | 31 |
| pm10 | 44 | 46 | 89 | 146 | 217 | 196 | 218 | 102 | 41 | 46 | 54 | 60 |
| no2 | 11 | 11 | 41 | 75 | 71 | 57 | 64 | 30 | 21 | 22 | 12 | 16 |
| so2 | 5.8 | 6.3 | 9.7 | 13 | 11 | 11 | 7 | 5.3 | 5.4 | 4.5 | 7.3 | 2.5 |
| co | 337 | 368 | 613 | 974 | 1 | 985 | 1 | 637 | 401 | 402 | 323 | 296 |
| o3 | 39 | 48 | 43 | 40 | 34 | 34 | 29 | 29 | 21 | 18 | 30 | 29 |
Victoria, Kolkata - WBPCB
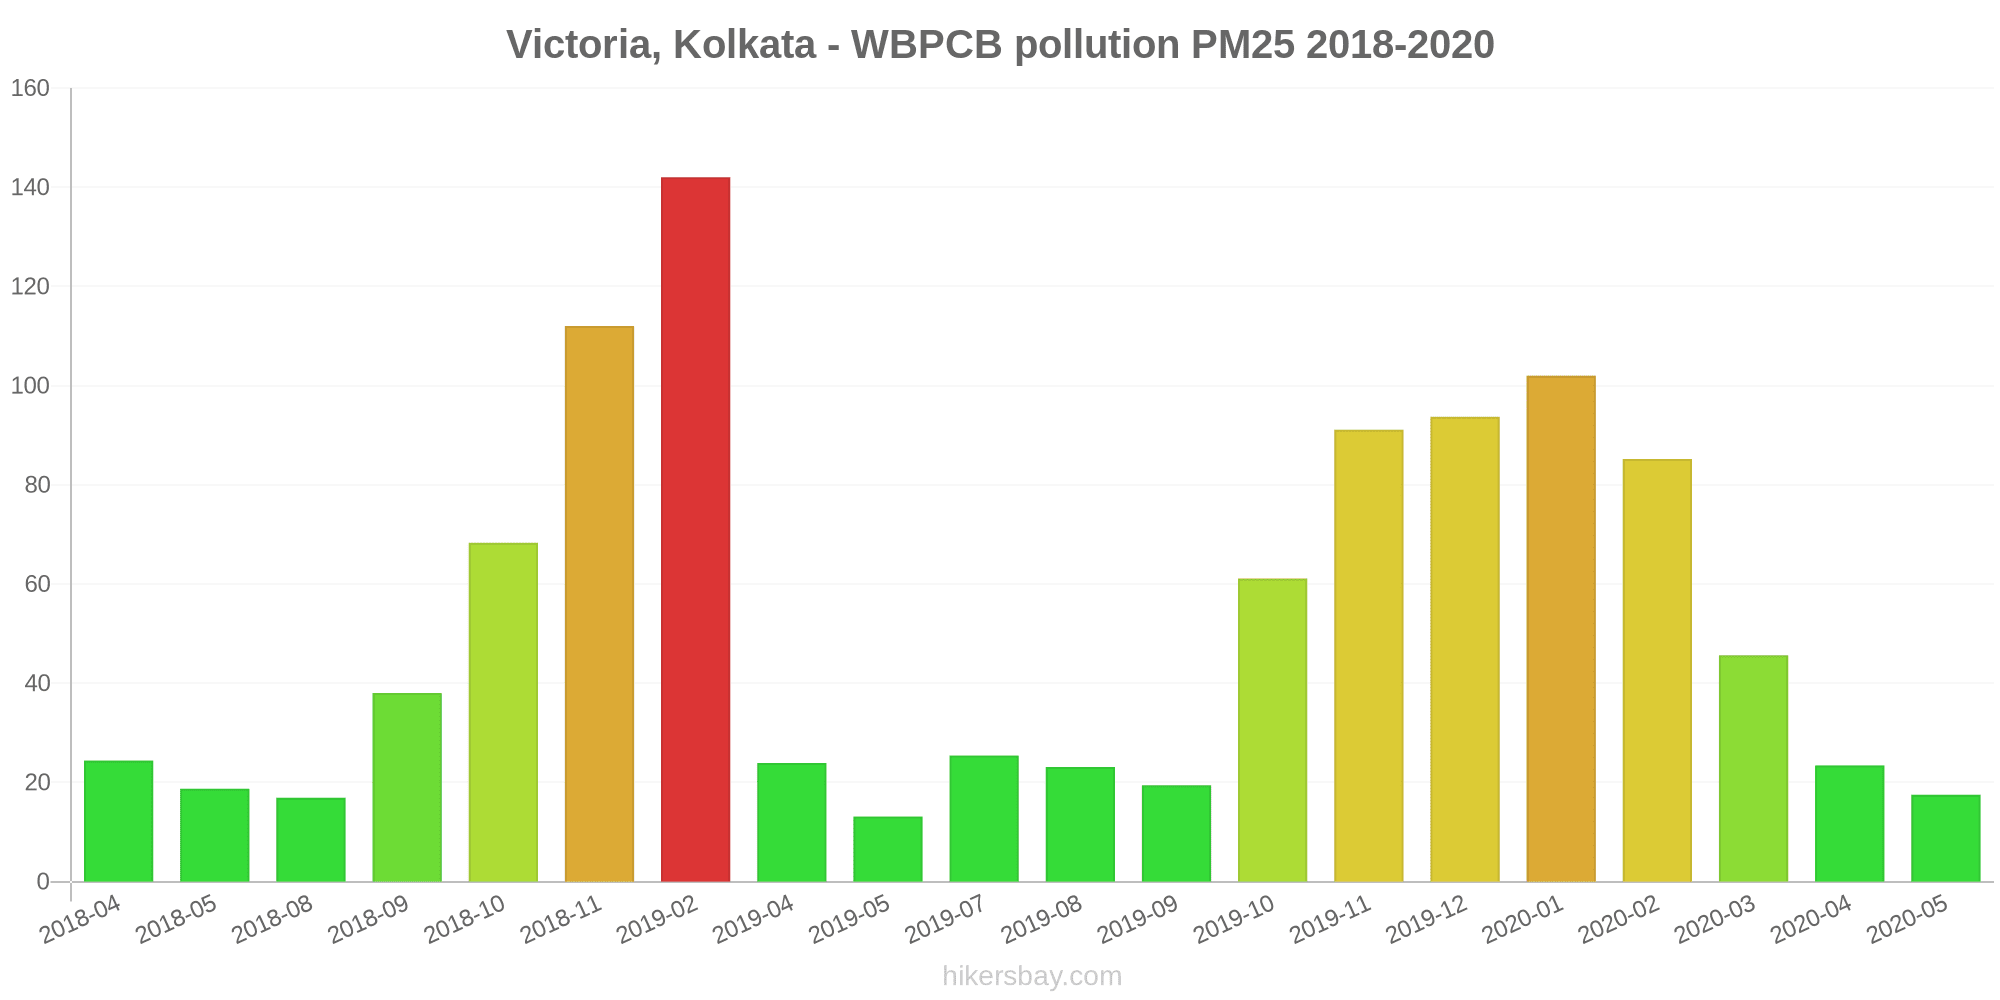
| index | 2020-05 | 2020-04 | 2020-03 | 2020-02 | 2020-01 | 2019-12 | 2019-11 | 2019-10 | 2019-09 | 2019-08 | 2019-07 | 2019-05 | 2019-04 | 2019-02 | 2018-11 | 2018-10 | 2018-09 | 2018-08 | 2018-05 | 2018-04 |
|---|---|---|---|---|---|---|---|---|---|---|---|---|---|---|---|---|---|---|---|---|
| pm25 | 18 | 23 | 46 | 85 | 102 | 94 | 91 | 61 | 19 | 23 | 25 | 13 | 24 | 142 | 112 | 68 | 38 | 17 | 19 | 24 |
| pm10 | 34 | 41 | 93 | 169 | 195 | 181 | 182 | 89 | 41 | 40 | 44 | 25 | 48 | 245 | 165 | 113 | 65 | 36 | 50 | 54 |
| no2 | 13 | 11 | 45 | 76 | 71 | 50 | 90 | 49 | 28 | 23 | 21 | 19 | 19 | 123 | 68 | 48 | 36 | 29 | 30 | 32 |
| so2 | 6.4 | 9.6 | 14 | 16 | 9.8 | 11 | 7.4 | 4.5 | 4.9 | 3.8 | 6.2 | 2.1 | 5.8 | 30 | 12 | 7.7 | 4.3 | 1.6 | 5.5 | 8.4 |
| co | 617 | 710 | 1 | 464 | 1 | 2 | 2 | 1 | 1 | 1 | 1 | 568 | 597 | 1 | 1 | 1 | 1 | 1 | 1 | 1 |
| o3 | 31 | 47 | 73 | 55 | 37 | 41 | 37 | 27 | 25 | 27 | 37 | 18 | 17 | 31 | 32 | 32 | 19 | 8.8 | 34 | 45 |