Air Pollution in Hisar: Real-time Air Quality Index and smog alert.
Pollution and air quality forecast for Hisar. Today is Wednesday, May 13, 2026. The following air pollution values have been recorded for Hisar:- particulate matter (PM10) suspended dust - 114 (Very Unhealthy)
- sulfur dioxide (SO2) - 32 (Good)
- particulate matter (PM2.5) dust - 110 (Very bad Hazardous)
- carbon monoxide (CO) - 1100 (Good)
- nitrogen dioxide (NO2) - 37 (Good)
- ozone (O3) - 83 (Moderate)

What is the air quality in Hisar today? Is the air polluted in Hisar?. Is there smog?
What is the level of PM10 today in Hisar? (particulate matter (PM10) suspended dust)
The current level of particulate matter PM10 in Hisar is:
114 (Very Unhealthy)
The highest PM10 values usually occur in month: 248 (April 2019).
The lowest value of particulate matter PM10 pollution in Hisar is usually recorded in: August (68).
What is the level of SO2 pollution? (sulfur dioxide (SO2))
32 (Good)
What is the current level of PM2.5 in Hisar? (particulate matter (PM2.5) dust)
Today's PM2.5 level is:
110 (Very bad Hazardous)
For comparison, the highest level of PM2.5 in Hisar in the last 7 days was: 110 (Monday, October 31, 2022) and the lowest: 110 (Monday, October 31, 2022).
The highest PM2.5 values were recorded: 178 (November 2019).
The lowest level of particulate matter PM2.5 pollution occurs in month: August (39).
How high is the CO level? (carbon monoxide (CO))
1100 (Good)
How high is the level of NO2? (nitrogen dioxide (NO2))
37 (Good)
How is the O3 level today in Hisar? (ozone (O3))
83 (Moderate)
Current data Monday, October 31, 2022, 1:45 AM
PM10 114 (Very Unhealthy)
SO2 32 (Good)
PM2,5 110 (Very bad Hazardous)
CO 1100 (Good)
NO2 37 (Good)
O3 83 (Moderate)
Data on air pollution from recent days in Hisar
index
2022-10-31
pm10
112
Very Unhealthy
so2
31
Good
pm25
110
Very bad Hazardous
co
1135
Good
no2
40
Moderate
o3
79
Moderate
data source »
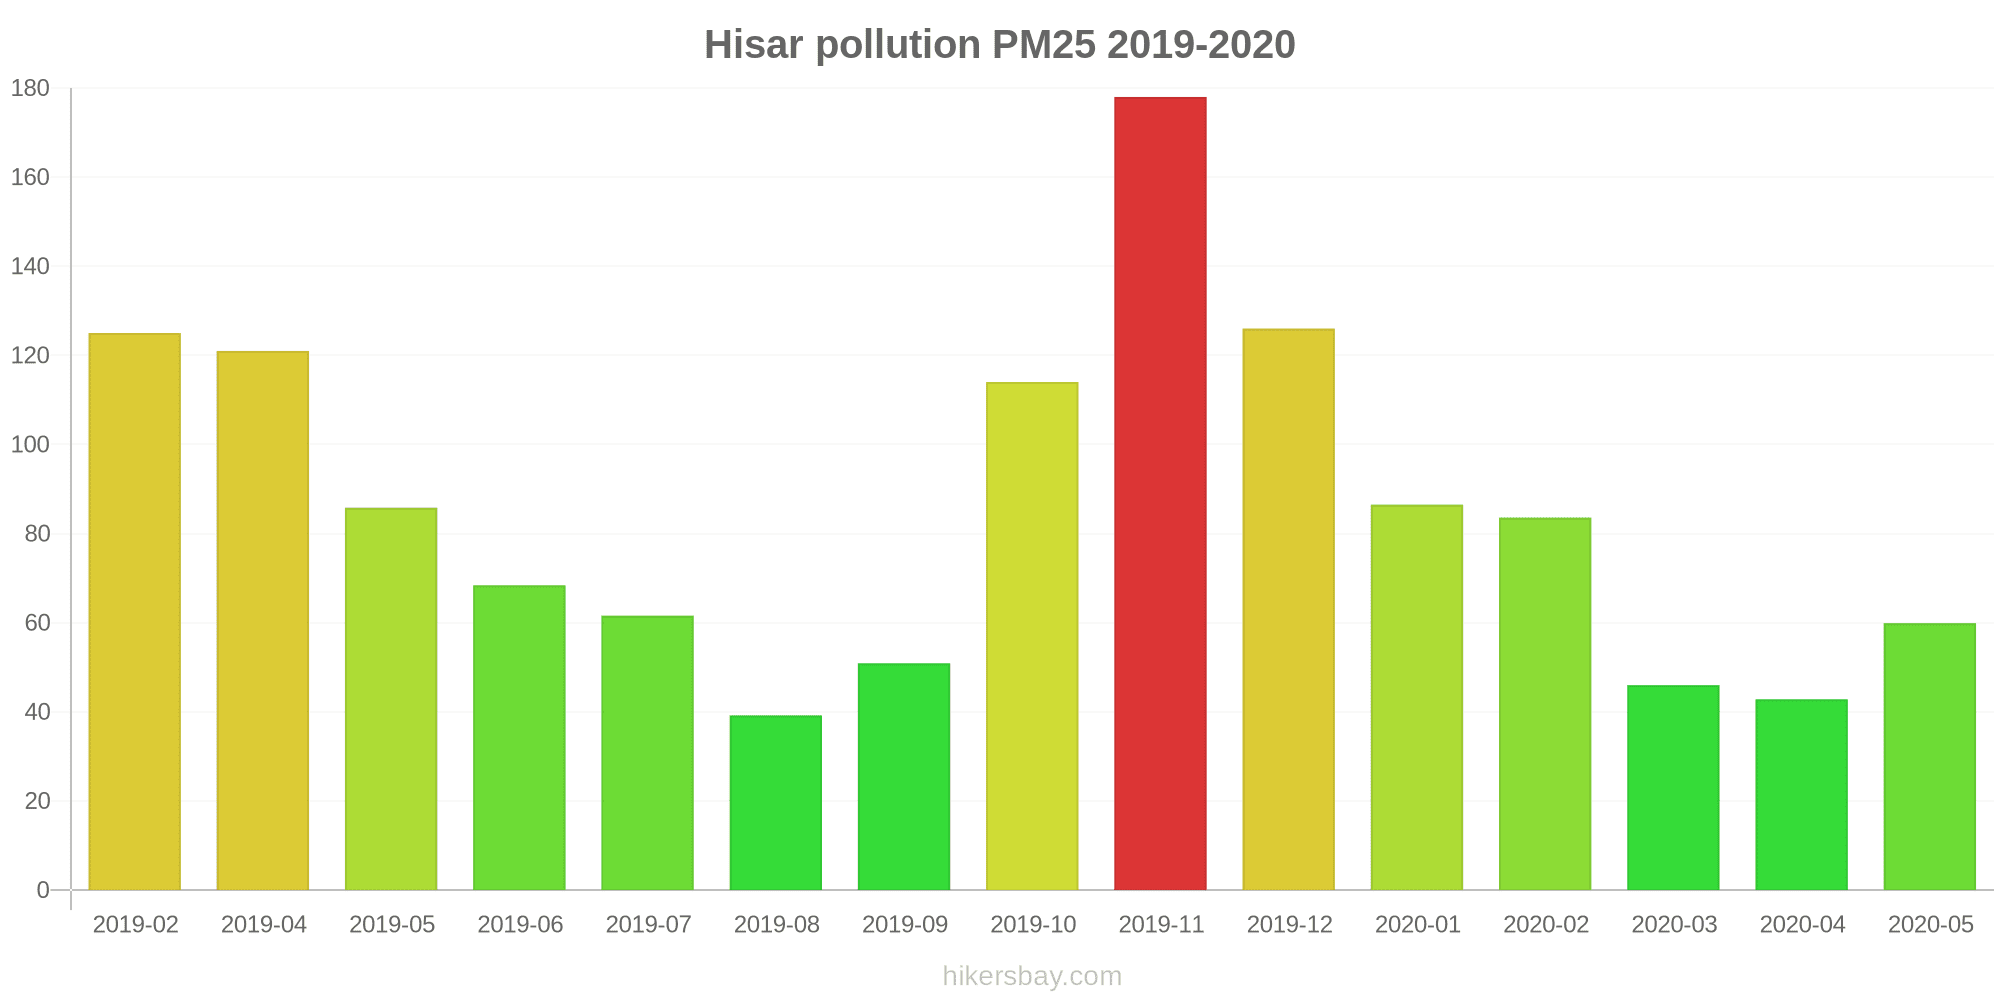
Air pollution in Hisar from February 2019 to May 2020
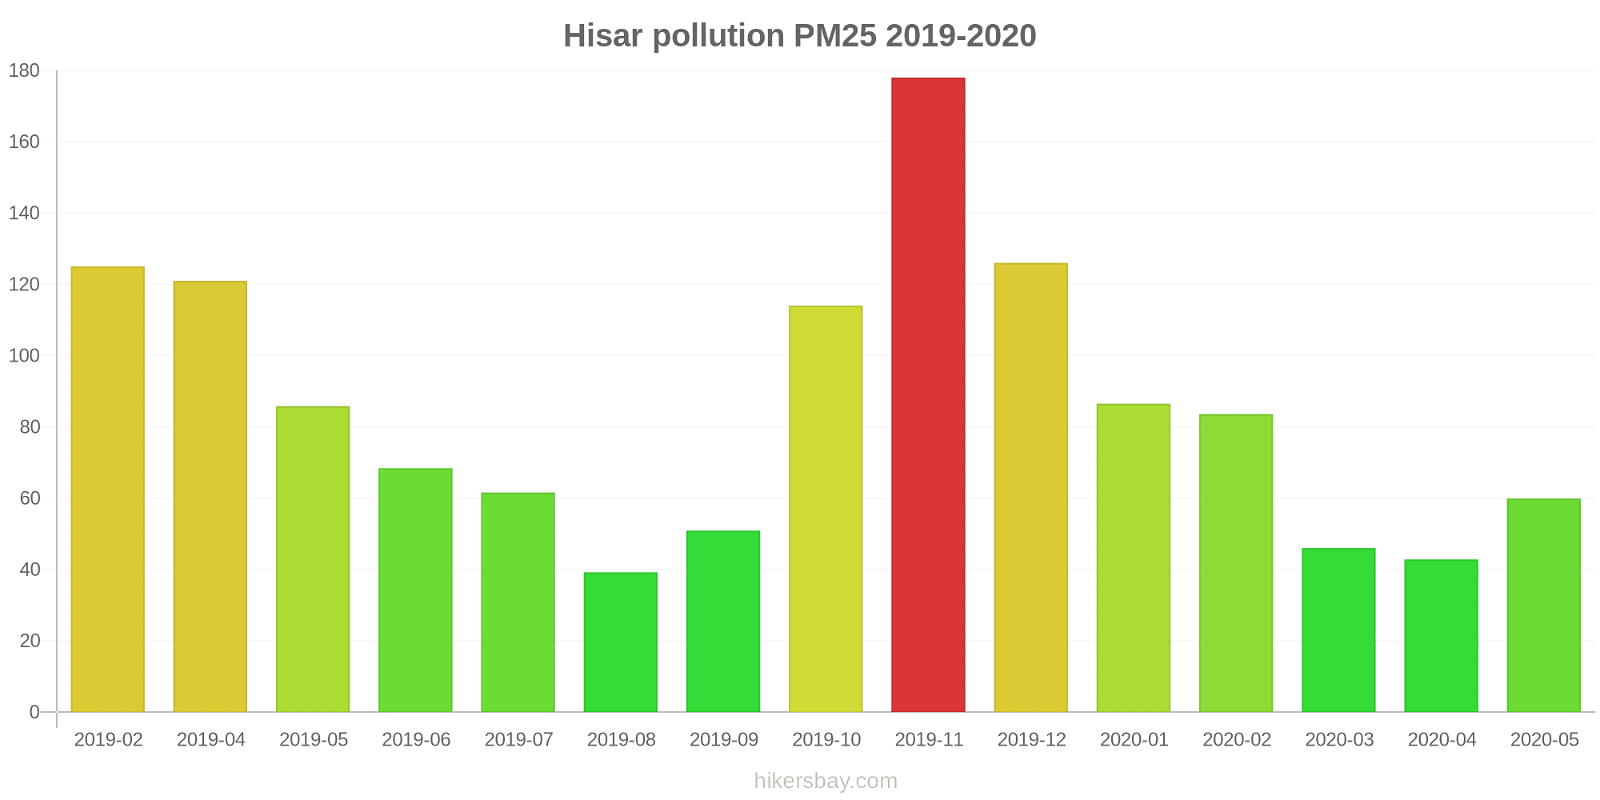
index
2020-05
2020-04
2020-03
2020-02
2020-01
2019-12
2019-11
2019-10
2019-09
2019-08
2019-07
2019-06
2019-05
2019-04
2019-02
pm25
60 (Unhealthy)
43 (Unhealthy for Sensitive Groups)
46 (Unhealthy for Sensitive Groups)
84 (Very Unhealthy)
87 (Very Unhealthy)
126 (Very bad Hazardous)
178 (Very bad Hazardous)
114 (Very bad Hazardous)
51 (Unhealthy for Sensitive Groups)
39 (Unhealthy for Sensitive Groups)
62 (Unhealthy)
68 (Unhealthy)
86 (Very Unhealthy)
121 (Very bad Hazardous)
125 (Very bad Hazardous)
pm10
154 (Very bad Hazardous)
108 (Unhealthy)
87 (Unhealthy)
133 (Very Unhealthy)
116 (Very Unhealthy)
166 (Very bad Hazardous)
218 (Very bad Hazardous)
188 (Very bad Hazardous)
94 (Unhealthy)
68 (Unhealthy for Sensitive Groups)
184 (Very bad Hazardous)
182 (Very bad Hazardous)
165 (Very bad Hazardous)
248 (Very bad Hazardous)
216 (Very bad Hazardous)
no2
22 (Good)
20 (Good)
27 (Good)
35 (Good)
41 (Moderate)
52 (Moderate)
27 (Good)
25 (Good)
15 (Good)
18 (Good)
21 (Good)
30 (Good)
14 (Good)
19 (Good)
53 (Moderate)
so2
29 (Good)
38 (Good)
29 (Good)
27 (Good)
15 (Good)
18 (Good)
18 (Good)
36 (Good)
26 (Good)
31 (Good)
28 (Good)
24 (Good)
24 (Good)
42 (Good)
25 (Good)
co
545 (Good)
732 (Good)
465 (Good)
1 (Good)
1 (Good)
1 (Good)
1 (Good)
799 (Good)
491 (Good)
351 (Good)
384 (Good)
474 (Good)
556 (Good)
571 (Good)
876 (Good)
o3
38 (Good)
21 (Good)
18 (Good)
23 (Good)
12 (Good)
16 (Good)
30 (Good)
55 (Good)
44 (Good)
39 (Good)
44 (Good)
74 (Moderate)
50 (Good)
54 (Good)
37 (Good)
data source »
Quality of life in Hisar
Green and Parks in the City
Hisar
56%
Nepal: 32%
Bangladesh: 33%
Bhutan: 82%
Sri Lanka: 59%
Pakistan: 49%
particulate matter PM2.5
Hisar
32 (Moderate)
Pleasure of spending time in the city
Hisar
39%
Nepal: 32%
Bangladesh: 26%
Bhutan: 61%
Sri Lanka: 52%
Pakistan: 43%
particulate matter PM10
Hisar
72 (Unhealthy for Sensitive Groups)
Air Pollution
Hisar
71%
Nepal: 76%
Bangladesh: 78%
Bhutan: 45%
Sri Lanka: 53%
Pakistan: 64%
Garbage Disposal
Hisar
38%
Nepal: 25%
Bangladesh: 22%
Bhutan: 47%
Sri Lanka: 41%
Pakistan: 34%
Availability and quality of drinking water
Hisar
54%
Nepal: 36%
Bangladesh: 44%
Bhutan: 64%
Sri Lanka: 65%
Pakistan: 44%
Cleanliness and tidiness
Hisar
34%
Nepal: 27%
Bangladesh: 23%
Bhutan: 57%
Sri Lanka: 52%
Pakistan: 40%
Noise and Light pollution
Hisar
37%
Nepal: 55%
Bangladesh: 63%
Bhutan: 55%
Sri Lanka: 50%
Pakistan: 59%
Water Pollution
Hisar
46%
Nepal: 76%
Bangladesh: 74%
Bhutan: 56%
Sri Lanka: 57%
Pakistan: 70%
Source: Numbeo
Urban Estate-II, Hisar - HSPCB
Monday, October 31, 2022, 1:45 AM
PM10 114 (Very Unhealthy)
particulate matter (PM10) suspended dust
SO2 32 (Good)
sulfur dioxide (SO2)
PM2,5 110 (Very Unhealthy)
particulate matter (PM2.5) dust
CO 1100 (Good)
carbon monoxide (CO)
NO2 37 (Good)
nitrogen dioxide (NO2)
O3 83 (Moderate)
ozone (O3)
Urban Estate-II, Hisar - HSPCB
index
2022-10-31
pm10
112
so2
31
pm25
110
co
1135
no2
40
o3
79
Urban Estate-II, Hisar - HSPCB
2019-02 2020-05

index
2020-05
2020-04
2020-03
2020-02
2020-01
2019-12
2019-11
2019-10
2019-09
2019-08
2019-07
2019-06
2019-05
2019-04
2019-02
pm25
60
43
46
84
87
126
178
114
51
39
62
68
86
121
125
pm10
154
108
87
133
116
166
218
188
94
68
184
182
165
248
216
no2
22
20
27
35
41
52
27
25
15
18
21
30
14
19
53
so2
29
38
29
27
15
18
18
36
26
31
28
24
24
42
25
co
545
732
465
1
1
1
1
799
491
351
384
474
556
571
876
o3
38
21
18
23
12
16
30
55
44
39
44
74
50
54
37
* Pollution data source:
https://openaq.org
(caaqm)
The data is licensed under CC-By 4.0
PM10 114 (Very Unhealthy)
SO2 32 (Good)
PM2,5 110 (Very bad Hazardous)
CO 1100 (Good)
NO2 37 (Good)
O3 83 (Moderate)
Data on air pollution from recent days in Hisar
| index | 2022-10-31 |
|---|---|
| pm10 | 112 Very Unhealthy |
| so2 | 31 Good |
| pm25 | 110 Very bad Hazardous |
| co | 1135 Good |
| no2 | 40 Moderate |
| o3 | 79 Moderate |
| index | 2020-05 | 2020-04 | 2020-03 | 2020-02 | 2020-01 | 2019-12 | 2019-11 | 2019-10 | 2019-09 | 2019-08 | 2019-07 | 2019-06 | 2019-05 | 2019-04 | 2019-02 |
|---|---|---|---|---|---|---|---|---|---|---|---|---|---|---|---|
| pm25 | 60 (Unhealthy) | 43 (Unhealthy for Sensitive Groups) | 46 (Unhealthy for Sensitive Groups) | 84 (Very Unhealthy) | 87 (Very Unhealthy) | 126 (Very bad Hazardous) | 178 (Very bad Hazardous) | 114 (Very bad Hazardous) | 51 (Unhealthy for Sensitive Groups) | 39 (Unhealthy for Sensitive Groups) | 62 (Unhealthy) | 68 (Unhealthy) | 86 (Very Unhealthy) | 121 (Very bad Hazardous) | 125 (Very bad Hazardous) |
| pm10 | 154 (Very bad Hazardous) | 108 (Unhealthy) | 87 (Unhealthy) | 133 (Very Unhealthy) | 116 (Very Unhealthy) | 166 (Very bad Hazardous) | 218 (Very bad Hazardous) | 188 (Very bad Hazardous) | 94 (Unhealthy) | 68 (Unhealthy for Sensitive Groups) | 184 (Very bad Hazardous) | 182 (Very bad Hazardous) | 165 (Very bad Hazardous) | 248 (Very bad Hazardous) | 216 (Very bad Hazardous) |
| no2 | 22 (Good) | 20 (Good) | 27 (Good) | 35 (Good) | 41 (Moderate) | 52 (Moderate) | 27 (Good) | 25 (Good) | 15 (Good) | 18 (Good) | 21 (Good) | 30 (Good) | 14 (Good) | 19 (Good) | 53 (Moderate) |
| so2 | 29 (Good) | 38 (Good) | 29 (Good) | 27 (Good) | 15 (Good) | 18 (Good) | 18 (Good) | 36 (Good) | 26 (Good) | 31 (Good) | 28 (Good) | 24 (Good) | 24 (Good) | 42 (Good) | 25 (Good) |
| co | 545 (Good) | 732 (Good) | 465 (Good) | 1 (Good) | 1 (Good) | 1 (Good) | 1 (Good) | 799 (Good) | 491 (Good) | 351 (Good) | 384 (Good) | 474 (Good) | 556 (Good) | 571 (Good) | 876 (Good) |
| o3 | 38 (Good) | 21 (Good) | 18 (Good) | 23 (Good) | 12 (Good) | 16 (Good) | 30 (Good) | 55 (Good) | 44 (Good) | 39 (Good) | 44 (Good) | 74 (Moderate) | 50 (Good) | 54 (Good) | 37 (Good) |
Green and Parks in the City
Hisar 56%
Nepal: 32% Bangladesh: 33% Bhutan: 82% Sri Lanka: 59% Pakistan: 49%particulate matter PM2.5
Hisar 32 (Moderate)
Pleasure of spending time in the city
Hisar 39%
Nepal: 32% Bangladesh: 26% Bhutan: 61% Sri Lanka: 52% Pakistan: 43%particulate matter PM10
Hisar 72 (Unhealthy for Sensitive Groups)
Air Pollution
Hisar 71%
Nepal: 76% Bangladesh: 78% Bhutan: 45% Sri Lanka: 53% Pakistan: 64%Garbage Disposal
Hisar 38%
Nepal: 25% Bangladesh: 22% Bhutan: 47% Sri Lanka: 41% Pakistan: 34%Availability and quality of drinking water
Hisar 54%
Nepal: 36% Bangladesh: 44% Bhutan: 64% Sri Lanka: 65% Pakistan: 44%Cleanliness and tidiness
Hisar 34%
Nepal: 27% Bangladesh: 23% Bhutan: 57% Sri Lanka: 52% Pakistan: 40%Noise and Light pollution
Hisar 37%
Nepal: 55% Bangladesh: 63% Bhutan: 55% Sri Lanka: 50% Pakistan: 59%Water Pollution
Hisar 46%
Nepal: 76% Bangladesh: 74% Bhutan: 56% Sri Lanka: 57% Pakistan: 70%PM10 114 (Very Unhealthy)
particulate matter (PM10) suspended dustSO2 32 (Good)
sulfur dioxide (SO2)PM2,5 110 (Very Unhealthy)
particulate matter (PM2.5) dustCO 1100 (Good)
carbon monoxide (CO)NO2 37 (Good)
nitrogen dioxide (NO2)O3 83 (Moderate)
ozone (O3)Urban Estate-II, Hisar - HSPCB
| index | 2022-10-31 |
|---|---|
| pm10 | 112 |
| so2 | 31 |
| pm25 | 110 |
| co | 1135 |
| no2 | 40 |
| o3 | 79 |
Urban Estate-II, Hisar - HSPCB
| index | 2020-05 | 2020-04 | 2020-03 | 2020-02 | 2020-01 | 2019-12 | 2019-11 | 2019-10 | 2019-09 | 2019-08 | 2019-07 | 2019-06 | 2019-05 | 2019-04 | 2019-02 |
|---|---|---|---|---|---|---|---|---|---|---|---|---|---|---|---|
| pm25 | 60 | 43 | 46 | 84 | 87 | 126 | 178 | 114 | 51 | 39 | 62 | 68 | 86 | 121 | 125 |
| pm10 | 154 | 108 | 87 | 133 | 116 | 166 | 218 | 188 | 94 | 68 | 184 | 182 | 165 | 248 | 216 |
| no2 | 22 | 20 | 27 | 35 | 41 | 52 | 27 | 25 | 15 | 18 | 21 | 30 | 14 | 19 | 53 |
| so2 | 29 | 38 | 29 | 27 | 15 | 18 | 18 | 36 | 26 | 31 | 28 | 24 | 24 | 42 | 25 |
| co | 545 | 732 | 465 | 1 | 1 | 1 | 1 | 799 | 491 | 351 | 384 | 474 | 556 | 571 | 876 |
| o3 | 38 | 21 | 18 | 23 | 12 | 16 | 30 | 55 | 44 | 39 | 44 | 74 | 50 | 54 | 37 |