Air Pollution in Jaipur: Real-time Air Quality Index and smog alert.
Pollution and air quality forecast for Jaipur. Today is Wednesday, May 13, 2026. The following air pollution values have been recorded for Jaipur:- particulate matter (PM10) suspended dust - 178 (Very bad Hazardous)
- sulfur dioxide (SO2) - 17 (Good)
- particulate matter (PM2.5) dust - 105 (Very Unhealthy)
- carbon monoxide (CO) - 1120 (Good)
- nitrogen dioxide (NO2) - 114 (Unhealthy for Sensitive Groups)
- ozone (O3) - 17 (Good)

What is the air quality in Jaipur today? Is the air polluted in Jaipur?. Is there smog?
What is the level of PM10 today in Jaipur? (particulate matter (PM10) suspended dust)
The current level of particulate matter PM10 in Jaipur is:
178 (Very bad Hazardous)
The highest PM10 values usually occur in month: 257 (May 2016).
The lowest value of particulate matter PM10 pollution in Jaipur is usually recorded in: August (57).
What is the level of SO2 pollution? (sulfur dioxide (SO2))
17 (Good)
What is the current level of PM2.5 in Jaipur? (particulate matter (PM2.5) dust)
Today's PM2.5 level is:
105 (Very Unhealthy)
For comparison, the highest level of PM2.5 in Jaipur in the last 7 days was: 95 (Monday, October 31, 2022) and the lowest: 95 (Monday, October 31, 2022).
The highest PM2.5 values were recorded: 130 (December 2016).
The lowest level of particulate matter PM2.5 pollution occurs in month: August (27).
How high is the CO level? (carbon monoxide (CO))
1120 (Good)
How high is the level of NO2? (nitrogen dioxide (NO2))
114 (Unhealthy for Sensitive Groups)
How is the O3 level today in Jaipur? (ozone (O3))
17 (Good)
Current data Monday, October 31, 2022, 1:45 AM
PM10 178 (Very bad Hazardous)
SO2 17 (Good)
PM2,5 105 (Very Unhealthy)
CO 1120 (Good)
NO2 114 (Unhealthy for Sensitive Groups)
O3 17 (Good)
Data on air pollution from recent days in Jaipur
index
2022-10-31
pm10
166
Very bad Hazardous
so2
16
Good
pm25
95
Very Unhealthy
co
930
Good
no2
111
Unhealthy for Sensitive Groups
o3
19
Good
data source »
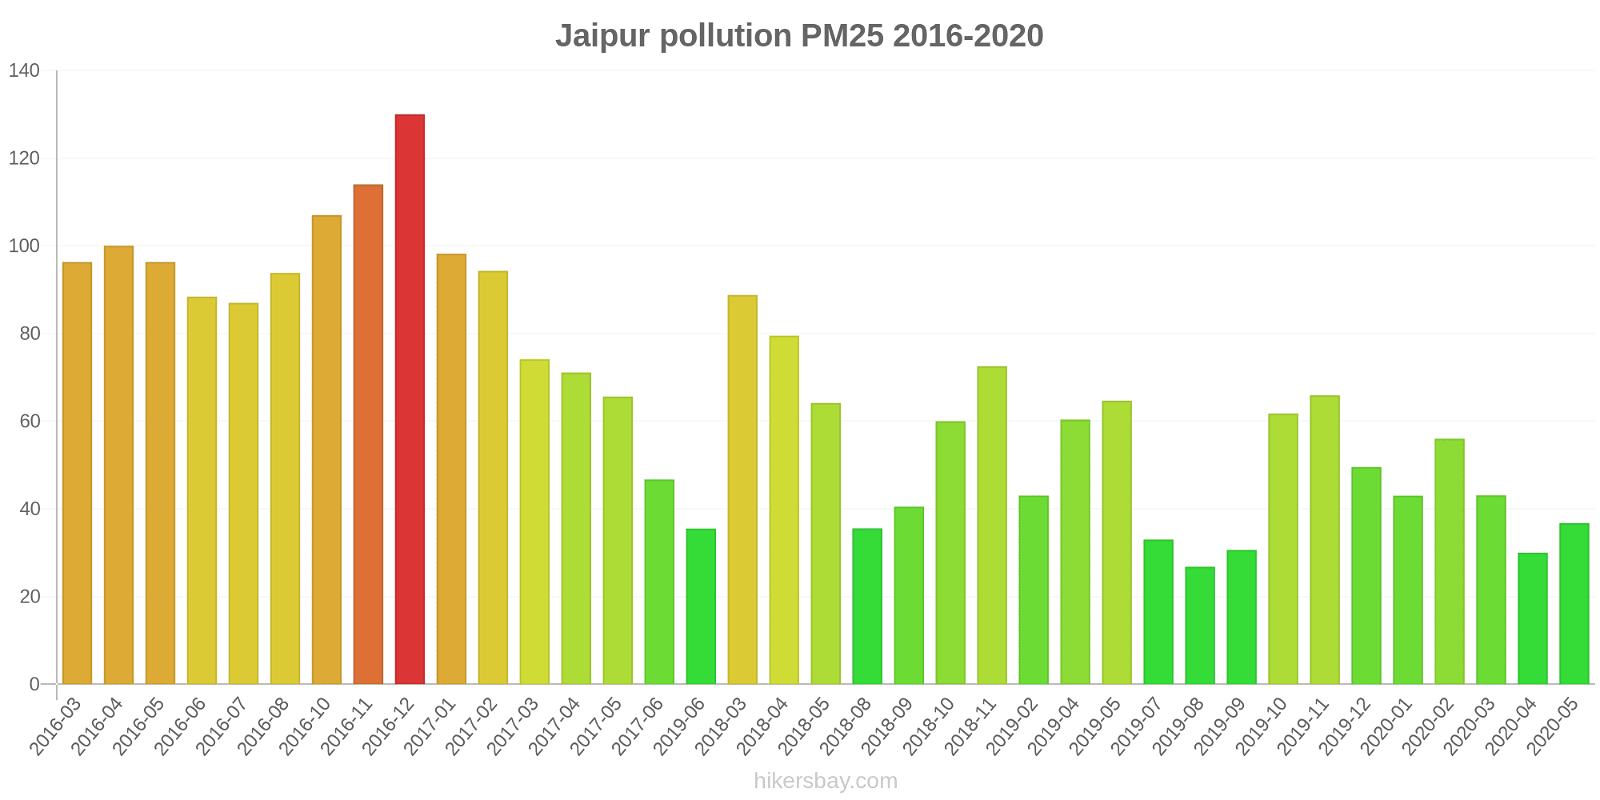
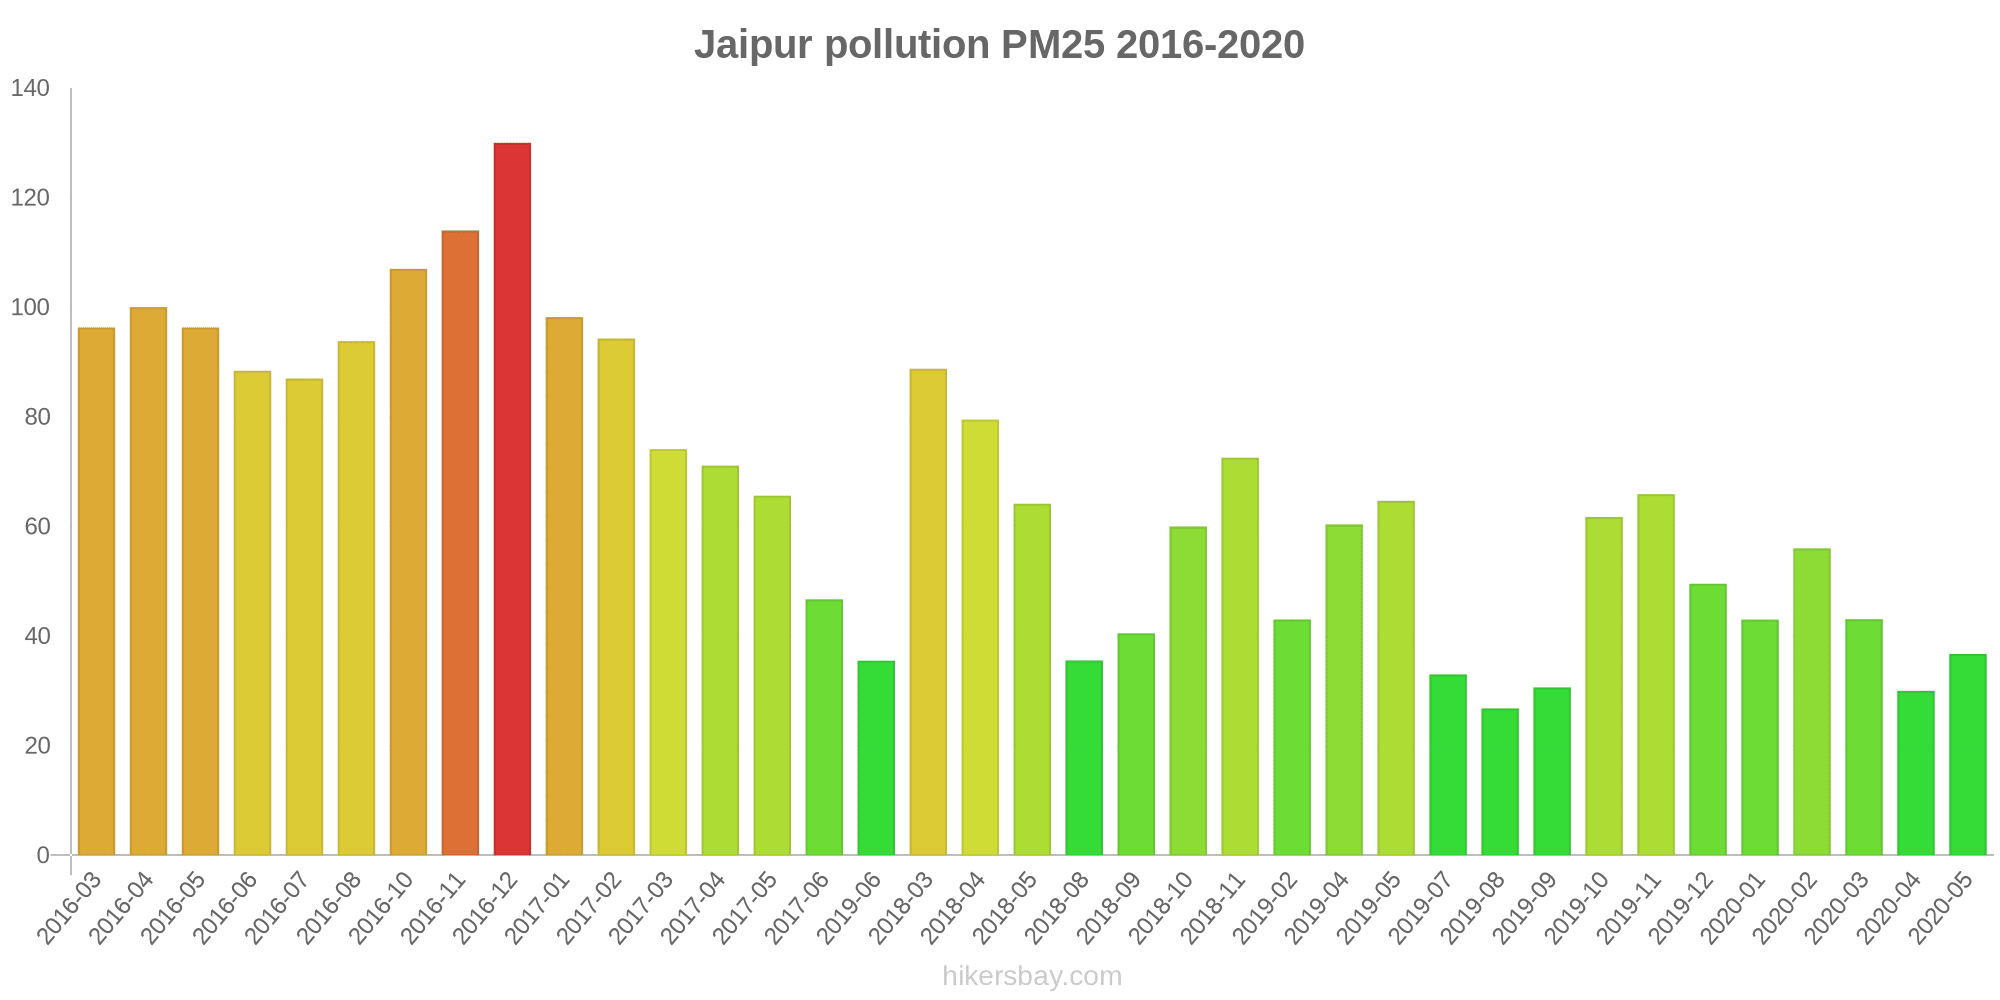
Air pollution in Jaipur from March 2016 to May 2020
index
2020-05
2020-04
2020-03
2020-02
2020-01
2019-12
2019-11
2019-10
2019-09
2019-08
2019-07
2019-05
2019-04
2019-02
2018-11
2018-10
2018-09
2018-08
2018-05
2018-04
2018-03
2019-06
2017-06
2017-05
2017-04
2017-03
2017-02
2017-01
2016-12
2016-11
2016-10
2016-09
2016-08
2016-07
2016-06
2016-05
2016-04
2016-03
pm25
37 (Unhealthy for Sensitive Groups)
30 (Moderate)
43 (Unhealthy for Sensitive Groups)
56 (Unhealthy)
43 (Unhealthy for Sensitive Groups)
50 (Unhealthy for Sensitive Groups)
66 (Unhealthy)
62 (Unhealthy)
31 (Moderate)
27 (Moderate)
33 (Moderate)
65 (Unhealthy)
60 (Unhealthy)
43 (Unhealthy for Sensitive Groups)
73 (Unhealthy)
60 (Unhealthy)
41 (Unhealthy for Sensitive Groups)
36 (Unhealthy for Sensitive Groups)
64 (Unhealthy)
80 (Very Unhealthy)
89 (Very Unhealthy)
36 (Unhealthy for Sensitive Groups)
47 (Unhealthy for Sensitive Groups)
66 (Unhealthy)
71 (Unhealthy)
74 (Unhealthy)
94 (Very Unhealthy)
98 (Very Unhealthy)
130 (Very bad Hazardous)
114 (Very bad Hazardous)
107 (Very Unhealthy)
- (Good)
94 (Very Unhealthy)
87 (Very Unhealthy)
88 (Very Unhealthy)
96 (Very Unhealthy)
100 (Very Unhealthy)
96 (Very Unhealthy)
pm10
81 (Unhealthy)
74 (Unhealthy for Sensitive Groups)
79 (Unhealthy for Sensitive Groups)
114 (Very Unhealthy)
97 (Unhealthy)
123 (Very Unhealthy)
133 (Very Unhealthy)
128 (Very Unhealthy)
66 (Unhealthy for Sensitive Groups)
57 (Unhealthy for Sensitive Groups)
71 (Unhealthy for Sensitive Groups)
155 (Very bad Hazardous)
148 (Very Unhealthy)
87 (Unhealthy)
155 (Very bad Hazardous)
132 (Very Unhealthy)
99 (Unhealthy)
83 (Unhealthy)
191 (Very bad Hazardous)
149 (Very Unhealthy)
117 (Very Unhealthy)
89 (Unhealthy)
132 (Very Unhealthy)
153 (Very bad Hazardous)
133 (Very Unhealthy)
129 (Very Unhealthy)
98 (Unhealthy)
86 (Unhealthy)
189 (Very bad Hazardous)
229 (Very bad Hazardous)
110 (Very Unhealthy)
115 (Very Unhealthy)
137 (Very Unhealthy)
140 (Very Unhealthy)
226 (Very bad Hazardous)
257 (Very bad Hazardous)
206 (Very bad Hazardous)
197 (Very bad Hazardous)
no2
14 (Good)
14 (Good)
28 (Good)
45 (Moderate)
40 (Good)
48 (Moderate)
43 (Moderate)
44 (Moderate)
24 (Good)
24 (Good)
19 (Good)
27 (Good)
52 (Moderate)
31 (Good)
50 (Moderate)
40 (Good)
21 (Good)
20 (Good)
29 (Good)
39 (Good)
47 (Moderate)
20 (Good)
26 (Good)
38 (Good)
24 (Good)
35 (Good)
6.6 (Good)
8.4 (Good)
20 (Good)
24 (Good)
4.6 (Good)
15 (Good)
26 (Good)
24 (Good)
24 (Good)
18 (Good)
23 (Good)
25 (Good)
so2
11 (Good)
12 (Good)
12 (Good)
13 (Good)
11 (Good)
12 (Good)
12 (Good)
13 (Good)
12 (Good)
9.8 (Good)
10 (Good)
17 (Good)
14 (Good)
12 (Good)
12 (Good)
11 (Good)
10 (Good)
9.8 (Good)
8.5 (Good)
10 (Good)
12 (Good)
19 (Good)
6.6 (Good)
5.5 (Good)
8.5 (Good)
13 (Good)
21 (Good)
20 (Good)
24 (Good)
19 (Good)
13 (Good)
8 (Good)
7.2 (Good)
7.2 (Good)
7.4 (Good)
8.5 (Good)
20 (Good)
15 (Good)
co
650 (Good)
578 (Good)
752 (Good)
615 (Good)
875 (Good)
580 (Good)
894 (Good)
612 (Good)
763 (Good)
677 (Good)
684 (Good)
542 (Good)
573 (Good)
252 (Good)
1 (Good)
1 (Good)
830 (Good)
660 (Good)
247 (Good)
21 (Good)
41 (Good)
711 (Good)
806 (Good)
699 (Good)
813 (Good)
834 (Good)
1 (Good)
1 (Good)
1 (Good)
947 (Good)
1 (Good)
851 (Good)
724 (Good)
832 (Good)
961 (Good)
924 (Good)
735 (Good)
503 (Good)
o3
50 (Good)
49 (Good)
60 (Good)
52 (Good)
41 (Good)
41 (Good)
52 (Good)
43 (Good)
31 (Good)
25 (Good)
33 (Good)
64 (Good)
57 (Good)
54 (Good)
42 (Good)
52 (Good)
25 (Good)
26 (Good)
100 (Moderate)
72 (Moderate)
53 (Good)
57 (Good)
32 (Good)
49 (Good)
29 (Good)
29 (Good)
71 (Moderate)
- (Good)
27 (Good)
30 (Good)
31 (Good)
27 (Good)
10 (Good)
27 (Good)
26 (Good)
45 (Good)
102 (Moderate)
10 (Good)
data source »
Quality of life in Jaipur
Green and Parks in the City
Jaipur
60%
Nepal: 32%
Bangladesh: 33%
Bhutan: 82%
Sri Lanka: 59%
Pakistan: 49%
particulate matter PM2.5
Jaipur
110 (Very Unhealthy)
Pleasure of spending time in the city
Jaipur
56%
Nepal: 32%
Bangladesh: 26%
Bhutan: 61%
Sri Lanka: 52%
Pakistan: 43%
particulate matter PM10
Jaipur
190 (Very bad Hazardous)
Air Pollution
Jaipur
55%
Nepal: 76%
Bangladesh: 78%
Bhutan: 45%
Sri Lanka: 53%
Pakistan: 64%
Garbage Disposal
Jaipur
45%
Nepal: 25%
Bangladesh: 22%
Bhutan: 47%
Sri Lanka: 41%
Pakistan: 34%
Availability and quality of drinking water
Jaipur
58%
Nepal: 36%
Bangladesh: 44%
Bhutan: 64%
Sri Lanka: 65%
Pakistan: 44%
Cleanliness and tidiness
Jaipur
46%
Nepal: 27%
Bangladesh: 23%
Bhutan: 57%
Sri Lanka: 52%
Pakistan: 40%
Noise and Light pollution
Jaipur
51%
Nepal: 55%
Bangladesh: 63%
Bhutan: 55%
Sri Lanka: 50%
Pakistan: 59%
Water Pollution
Jaipur
63%
Nepal: 76%
Bangladesh: 74%
Bhutan: 56%
Sri Lanka: 57%
Pakistan: 70%
Source: Numbeo
Adarsh Nagar, Jaipur - RSPCB
Monday, October 31, 2022, 2:00 AM
PM10 165 (Very bad Hazardous)
particulate matter (PM10) suspended dust
SO2 12 (Good)
sulfur dioxide (SO2)
PM2,5 122 (Very bad Hazardous)
particulate matter (PM2.5) dust
CO 1960 (Good)
carbon monoxide (CO)
NO2 137 (Unhealthy for Sensitive Groups)
nitrogen dioxide (NO2)
O3 3.4 (Good)
ozone (O3)
Police Commissionerate, Jaipur - RSPCB
Monday, October 31, 2022, 1:45 AM
PM10 255 (Very bad Hazardous)
particulate matter (PM10) suspended dust
SO2 20 (Good)
sulfur dioxide (SO2)
PM2,5 120 (Very bad Hazardous)
particulate matter (PM2.5) dust
CO 1370 (Good)
carbon monoxide (CO)
NO2 125 (Unhealthy for Sensitive Groups)
nitrogen dioxide (NO2)
O3 11 (Good)
ozone (O3)
Shastri Nagar, Jaipur - RSPCB
Monday, October 31, 2022, 1:45 AM
PM10 116 (Very Unhealthy)
particulate matter (PM10) suspended dust
SO2 20 (Good)
sulfur dioxide (SO2)
PM2,5 72 (Unhealthy)
particulate matter (PM2.5) dust
CO 30 (Good)
carbon monoxide (CO)
NO2 81 (Moderate)
nitrogen dioxide (NO2)
O3 38 (Good)
ozone (O3)
Adarsh Nagar, Jaipur - RSPCB
index
2022-10-31
pm10
155
so2
11
pm25
117
co
1550
no2
128
o3
2.8
Police Commissionerate, Jaipur - RSPCB
index
2022-10-31
pm10
235
so2
21
pm25
103
co
1115
no2
112
o3
11
Shastri Nagar, Jaipur - RSPCB
index
2022-10-31
pm10
109
so2
16
pm25
66
co
125
no2
91
o3
42
Adarsh Nagar, Jaipur - RSPCB
2018-03 2020-05

index
2020-05
2020-04
2020-03
2020-02
2020-01
2019-12
2019-11
2019-10
2019-09
2019-08
2019-07
2019-05
2019-04
2019-02
2018-11
2018-10
2018-09
2018-08
2018-05
2018-04
2018-03
pm25
25
26
27
38
35
44
46
37
22
20
27
50
50
31
56
45
29
25
51
69
83
pm10
87
68
71
96
88
116
121
111
48
46
60
150
138
78
157
155
95
69
163
153
117
no2
13
12
25
45
39
48
41
47
24
23
21
38
43
24
45
37
33
29
28
31
53
so2
8.9
11
12
14
11
12
13
13
12
9.3
9.7
9.6
12
9.3
12
9.9
10
9.8
7.2
10
11
co
808
684
682
883
898
972
966
980
905
925
850
922
850
755
1
1
858
713
739
18
38
o3
55
55
62
57
46
51
65
50
29
24
32
70
62
76
52
60
23
22
66
58
49
Police Commissionerate, Jaipur - RSPCB
2018-03 2020-05
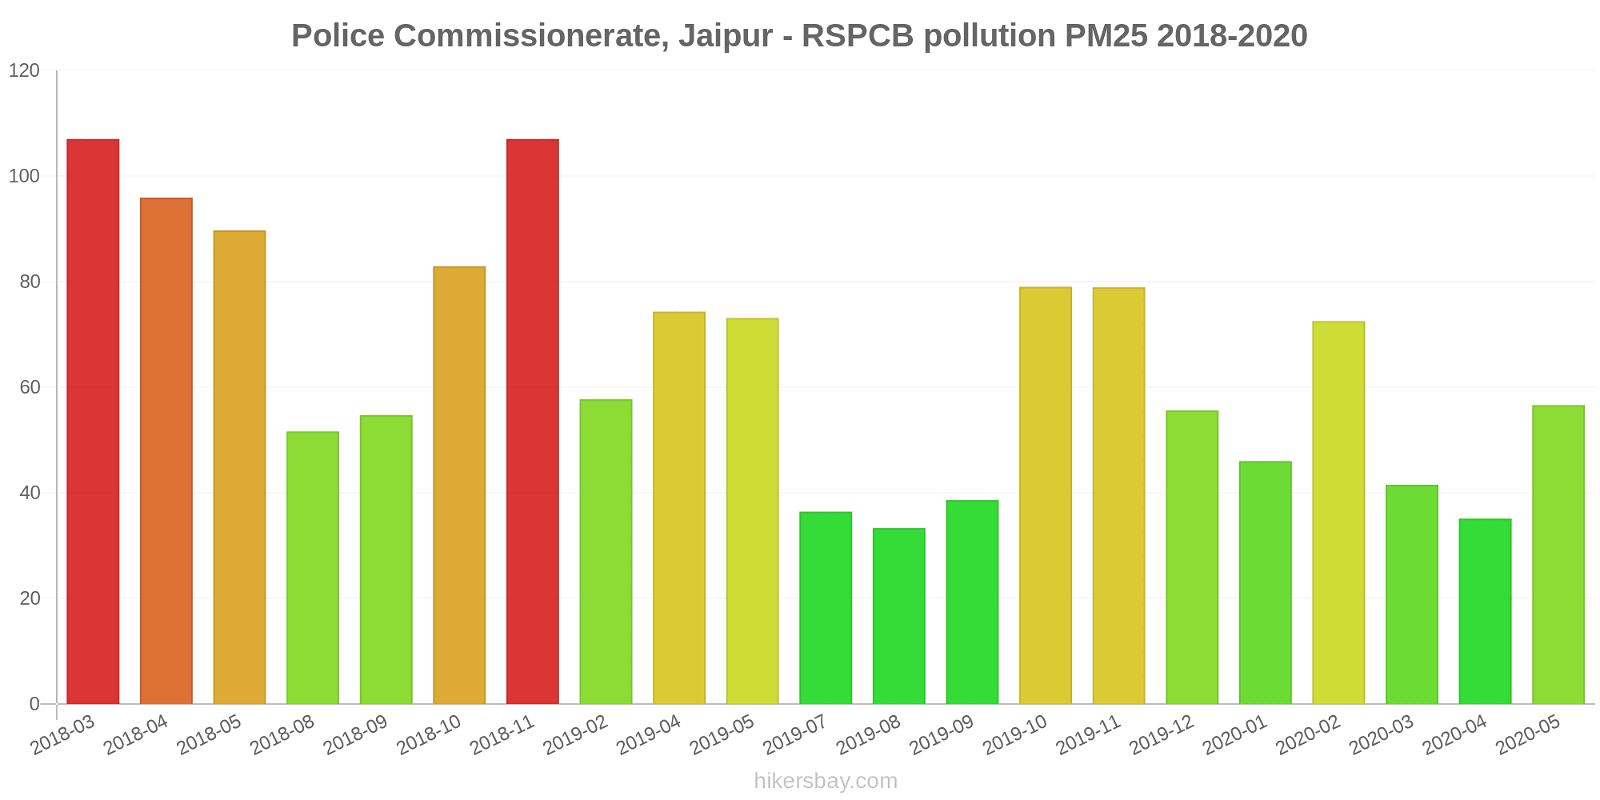
index
2020-05
2020-04
2020-03
2020-02
2020-01
2019-12
2019-11
2019-10
2019-09
2019-08
2019-07
2019-05
2019-04
2019-02
2018-11
2018-10
2018-09
2018-08
2018-05
2018-04
2018-03
pm25
57
35
42
73
46
56
79
79
39
33
36
73
74
58
107
83
55
52
90
96
107
pm10
79
78
89
130
105
128
141
135
80
67
82
137
153
104
181
158
133
98
236
145
118
no2
14
16
33
47
39
48
57
56
32
30
21
-
96
44
54
49
17
19
30
42
38
co
469
542
879
962
795
767
779
855
811
689
748
1
1
1
1
1
931
758
1
33
54
o3
37
29
43
34
23
27
46
40
33
28
36
51
45
26
40
45
27
31
166
85
44
so2
8.6
13
11
11
9.7
8.4
10
12
12
9
9.1
28
10
18
10
11
8.3
11
9.2
11
13
Shastri Nagar, Jaipur - RSPCB
2018-03 2020-05

index
2020-05
2020-04
2020-03
2020-02
2020-01
2019-12
2019-11
2019-10
2019-09
2019-08
2019-07
2019-06
2019-05
2019-04
2019-02
2018-11
2018-10
2018-09
2018-08
2018-05
2018-04
2018-03
pm25
29
29
61
58
48
49
73
69
31
28
36
36
71
57
40
54
52
38
30
52
73
76
pm10
78
77
78
117
97
126
138
138
68
57
72
89
177
152
78
128
82
69
83
174
150
115
no2
14
14
26
42
41
47
29
30
18
18
16
20
16
19
25
51
33
13
12
29
43
51
so2
16
14
14
14
13
16
12
15
12
11
11
19
14
18
9.9
13
13
13
8.8
9.3
8.5
14
co
673
509
696
1
931
1
937
1
572
417
455
711
704
867
1
1
1
701
510
1
13
32
o3
59
63
77
65
56
46
47
38
30
23
31
57
69
65
60
35
52
26
26
70
74
67
VK Industrial Area Jaipur - RSPCB
2016-03 2017-06
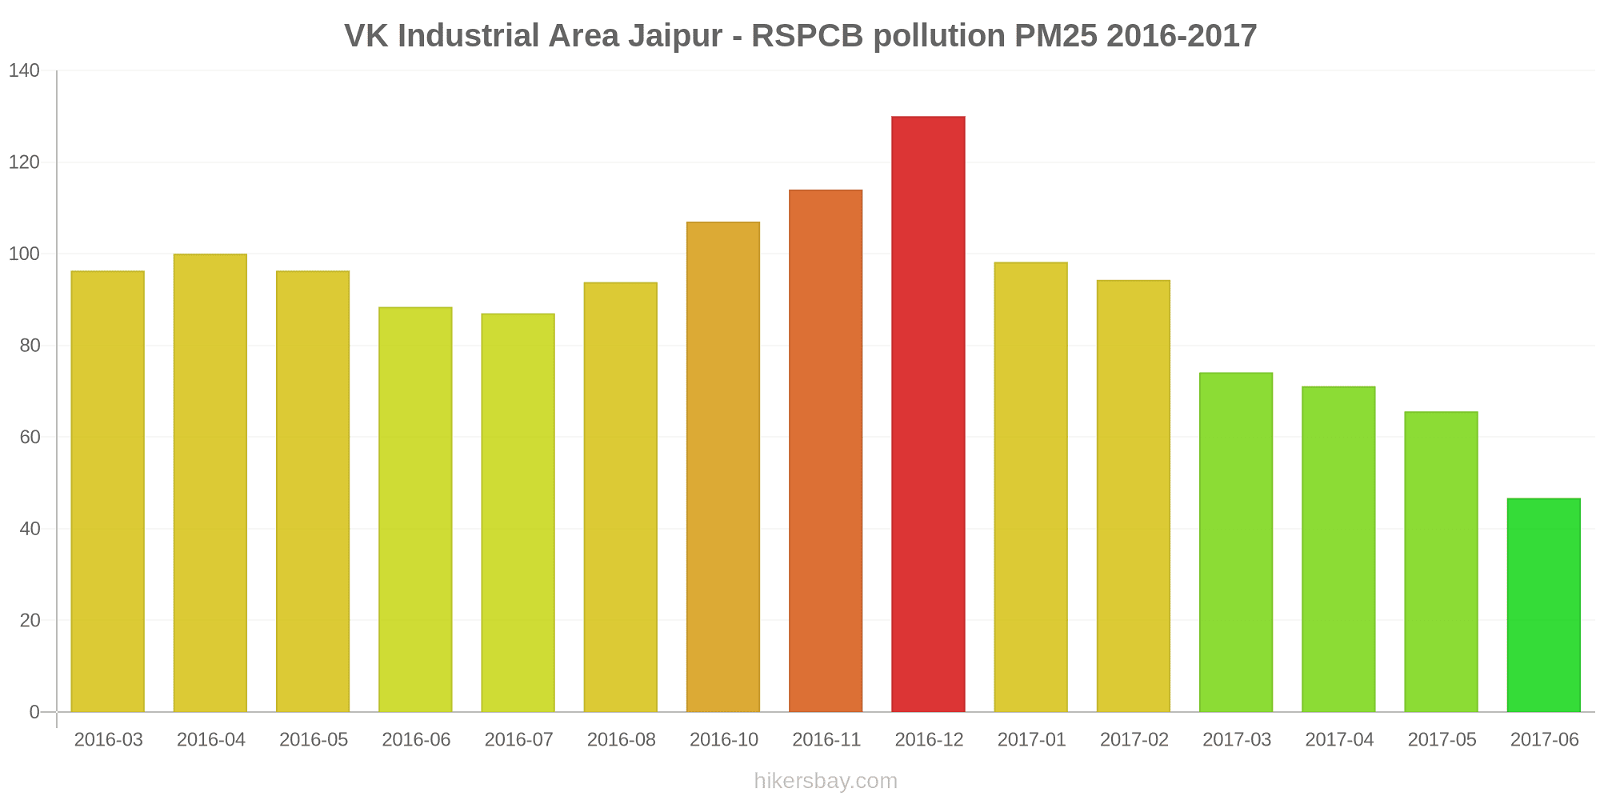
index
2017-06
2017-05
2017-04
2017-03
2017-02
2017-01
2016-12
2016-11
2016-10
2016-09
2016-08
2016-07
2016-06
2016-05
2016-04
2016-03
pm10
132
153
133
129
98
86
189
229
110
115
137
140
226
257
206
197
no2
26
38
24
35
6.6
8.4
20
24
4.6
15
26
24
24
18
23
25
so2
6.6
5.5
8.5
13
21
20
24
19
13
8
7.2
7.2
7.4
8.5
20
15
co
806
699
813
834
1
1
1
947
1
851
724
832
961
924
735
503
pm25
47
66
71
74
94
98
130
114
107
-
94
87
88
96
100
96
o3
32
49
29
29
71
-
27
30
31
27
10
27
26
45
102
10
* Pollution data source:
https://openaq.org
(caaqm, CPCB)
The data is licensed under CC-By 4.0
PM10 178 (Very bad Hazardous)
SO2 17 (Good)
PM2,5 105 (Very Unhealthy)
CO 1120 (Good)
NO2 114 (Unhealthy for Sensitive Groups)
O3 17 (Good)
Data on air pollution from recent days in Jaipur
| index | 2022-10-31 |
|---|---|
| pm10 | 166 Very bad Hazardous |
| so2 | 16 Good |
| pm25 | 95 Very Unhealthy |
| co | 930 Good |
| no2 | 111 Unhealthy for Sensitive Groups |
| o3 | 19 Good |
| index | 2020-05 | 2020-04 | 2020-03 | 2020-02 | 2020-01 | 2019-12 | 2019-11 | 2019-10 | 2019-09 | 2019-08 | 2019-07 | 2019-05 | 2019-04 | 2019-02 | 2018-11 | 2018-10 | 2018-09 | 2018-08 | 2018-05 | 2018-04 | 2018-03 | 2019-06 | 2017-06 | 2017-05 | 2017-04 | 2017-03 | 2017-02 | 2017-01 | 2016-12 | 2016-11 | 2016-10 | 2016-09 | 2016-08 | 2016-07 | 2016-06 | 2016-05 | 2016-04 | 2016-03 |
|---|---|---|---|---|---|---|---|---|---|---|---|---|---|---|---|---|---|---|---|---|---|---|---|---|---|---|---|---|---|---|---|---|---|---|---|---|---|---|
| pm25 | 37 (Unhealthy for Sensitive Groups) | 30 (Moderate) | 43 (Unhealthy for Sensitive Groups) | 56 (Unhealthy) | 43 (Unhealthy for Sensitive Groups) | 50 (Unhealthy for Sensitive Groups) | 66 (Unhealthy) | 62 (Unhealthy) | 31 (Moderate) | 27 (Moderate) | 33 (Moderate) | 65 (Unhealthy) | 60 (Unhealthy) | 43 (Unhealthy for Sensitive Groups) | 73 (Unhealthy) | 60 (Unhealthy) | 41 (Unhealthy for Sensitive Groups) | 36 (Unhealthy for Sensitive Groups) | 64 (Unhealthy) | 80 (Very Unhealthy) | 89 (Very Unhealthy) | 36 (Unhealthy for Sensitive Groups) | 47 (Unhealthy for Sensitive Groups) | 66 (Unhealthy) | 71 (Unhealthy) | 74 (Unhealthy) | 94 (Very Unhealthy) | 98 (Very Unhealthy) | 130 (Very bad Hazardous) | 114 (Very bad Hazardous) | 107 (Very Unhealthy) | - (Good) | 94 (Very Unhealthy) | 87 (Very Unhealthy) | 88 (Very Unhealthy) | 96 (Very Unhealthy) | 100 (Very Unhealthy) | 96 (Very Unhealthy) |
| pm10 | 81 (Unhealthy) | 74 (Unhealthy for Sensitive Groups) | 79 (Unhealthy for Sensitive Groups) | 114 (Very Unhealthy) | 97 (Unhealthy) | 123 (Very Unhealthy) | 133 (Very Unhealthy) | 128 (Very Unhealthy) | 66 (Unhealthy for Sensitive Groups) | 57 (Unhealthy for Sensitive Groups) | 71 (Unhealthy for Sensitive Groups) | 155 (Very bad Hazardous) | 148 (Very Unhealthy) | 87 (Unhealthy) | 155 (Very bad Hazardous) | 132 (Very Unhealthy) | 99 (Unhealthy) | 83 (Unhealthy) | 191 (Very bad Hazardous) | 149 (Very Unhealthy) | 117 (Very Unhealthy) | 89 (Unhealthy) | 132 (Very Unhealthy) | 153 (Very bad Hazardous) | 133 (Very Unhealthy) | 129 (Very Unhealthy) | 98 (Unhealthy) | 86 (Unhealthy) | 189 (Very bad Hazardous) | 229 (Very bad Hazardous) | 110 (Very Unhealthy) | 115 (Very Unhealthy) | 137 (Very Unhealthy) | 140 (Very Unhealthy) | 226 (Very bad Hazardous) | 257 (Very bad Hazardous) | 206 (Very bad Hazardous) | 197 (Very bad Hazardous) |
| no2 | 14 (Good) | 14 (Good) | 28 (Good) | 45 (Moderate) | 40 (Good) | 48 (Moderate) | 43 (Moderate) | 44 (Moderate) | 24 (Good) | 24 (Good) | 19 (Good) | 27 (Good) | 52 (Moderate) | 31 (Good) | 50 (Moderate) | 40 (Good) | 21 (Good) | 20 (Good) | 29 (Good) | 39 (Good) | 47 (Moderate) | 20 (Good) | 26 (Good) | 38 (Good) | 24 (Good) | 35 (Good) | 6.6 (Good) | 8.4 (Good) | 20 (Good) | 24 (Good) | 4.6 (Good) | 15 (Good) | 26 (Good) | 24 (Good) | 24 (Good) | 18 (Good) | 23 (Good) | 25 (Good) |
| so2 | 11 (Good) | 12 (Good) | 12 (Good) | 13 (Good) | 11 (Good) | 12 (Good) | 12 (Good) | 13 (Good) | 12 (Good) | 9.8 (Good) | 10 (Good) | 17 (Good) | 14 (Good) | 12 (Good) | 12 (Good) | 11 (Good) | 10 (Good) | 9.8 (Good) | 8.5 (Good) | 10 (Good) | 12 (Good) | 19 (Good) | 6.6 (Good) | 5.5 (Good) | 8.5 (Good) | 13 (Good) | 21 (Good) | 20 (Good) | 24 (Good) | 19 (Good) | 13 (Good) | 8 (Good) | 7.2 (Good) | 7.2 (Good) | 7.4 (Good) | 8.5 (Good) | 20 (Good) | 15 (Good) |
| co | 650 (Good) | 578 (Good) | 752 (Good) | 615 (Good) | 875 (Good) | 580 (Good) | 894 (Good) | 612 (Good) | 763 (Good) | 677 (Good) | 684 (Good) | 542 (Good) | 573 (Good) | 252 (Good) | 1 (Good) | 1 (Good) | 830 (Good) | 660 (Good) | 247 (Good) | 21 (Good) | 41 (Good) | 711 (Good) | 806 (Good) | 699 (Good) | 813 (Good) | 834 (Good) | 1 (Good) | 1 (Good) | 1 (Good) | 947 (Good) | 1 (Good) | 851 (Good) | 724 (Good) | 832 (Good) | 961 (Good) | 924 (Good) | 735 (Good) | 503 (Good) |
| o3 | 50 (Good) | 49 (Good) | 60 (Good) | 52 (Good) | 41 (Good) | 41 (Good) | 52 (Good) | 43 (Good) | 31 (Good) | 25 (Good) | 33 (Good) | 64 (Good) | 57 (Good) | 54 (Good) | 42 (Good) | 52 (Good) | 25 (Good) | 26 (Good) | 100 (Moderate) | 72 (Moderate) | 53 (Good) | 57 (Good) | 32 (Good) | 49 (Good) | 29 (Good) | 29 (Good) | 71 (Moderate) | - (Good) | 27 (Good) | 30 (Good) | 31 (Good) | 27 (Good) | 10 (Good) | 27 (Good) | 26 (Good) | 45 (Good) | 102 (Moderate) | 10 (Good) |
Green and Parks in the City
Jaipur 60%
Nepal: 32% Bangladesh: 33% Bhutan: 82% Sri Lanka: 59% Pakistan: 49%particulate matter PM2.5
Jaipur 110 (Very Unhealthy)
Pleasure of spending time in the city
Jaipur 56%
Nepal: 32% Bangladesh: 26% Bhutan: 61% Sri Lanka: 52% Pakistan: 43%particulate matter PM10
Jaipur 190 (Very bad Hazardous)
Air Pollution
Jaipur 55%
Nepal: 76% Bangladesh: 78% Bhutan: 45% Sri Lanka: 53% Pakistan: 64%Garbage Disposal
Jaipur 45%
Nepal: 25% Bangladesh: 22% Bhutan: 47% Sri Lanka: 41% Pakistan: 34%Availability and quality of drinking water
Jaipur 58%
Nepal: 36% Bangladesh: 44% Bhutan: 64% Sri Lanka: 65% Pakistan: 44%Cleanliness and tidiness
Jaipur 46%
Nepal: 27% Bangladesh: 23% Bhutan: 57% Sri Lanka: 52% Pakistan: 40%Noise and Light pollution
Jaipur 51%
Nepal: 55% Bangladesh: 63% Bhutan: 55% Sri Lanka: 50% Pakistan: 59%Water Pollution
Jaipur 63%
Nepal: 76% Bangladesh: 74% Bhutan: 56% Sri Lanka: 57% Pakistan: 70%PM10 165 (Very bad Hazardous)
particulate matter (PM10) suspended dustSO2 12 (Good)
sulfur dioxide (SO2)PM2,5 122 (Very bad Hazardous)
particulate matter (PM2.5) dustCO 1960 (Good)
carbon monoxide (CO)NO2 137 (Unhealthy for Sensitive Groups)
nitrogen dioxide (NO2)O3 3.4 (Good)
ozone (O3)PM10 255 (Very bad Hazardous)
particulate matter (PM10) suspended dustSO2 20 (Good)
sulfur dioxide (SO2)PM2,5 120 (Very bad Hazardous)
particulate matter (PM2.5) dustCO 1370 (Good)
carbon monoxide (CO)NO2 125 (Unhealthy for Sensitive Groups)
nitrogen dioxide (NO2)O3 11 (Good)
ozone (O3)PM10 116 (Very Unhealthy)
particulate matter (PM10) suspended dustSO2 20 (Good)
sulfur dioxide (SO2)PM2,5 72 (Unhealthy)
particulate matter (PM2.5) dustCO 30 (Good)
carbon monoxide (CO)NO2 81 (Moderate)
nitrogen dioxide (NO2)O3 38 (Good)
ozone (O3)Adarsh Nagar, Jaipur - RSPCB
| index | 2022-10-31 |
|---|---|
| pm10 | 155 |
| so2 | 11 |
| pm25 | 117 |
| co | 1550 |
| no2 | 128 |
| o3 | 2.8 |
Police Commissionerate, Jaipur - RSPCB
| index | 2022-10-31 |
|---|---|
| pm10 | 235 |
| so2 | 21 |
| pm25 | 103 |
| co | 1115 |
| no2 | 112 |
| o3 | 11 |
Shastri Nagar, Jaipur - RSPCB
| index | 2022-10-31 |
|---|---|
| pm10 | 109 |
| so2 | 16 |
| pm25 | 66 |
| co | 125 |
| no2 | 91 |
| o3 | 42 |
Adarsh Nagar, Jaipur - RSPCB
| index | 2020-05 | 2020-04 | 2020-03 | 2020-02 | 2020-01 | 2019-12 | 2019-11 | 2019-10 | 2019-09 | 2019-08 | 2019-07 | 2019-05 | 2019-04 | 2019-02 | 2018-11 | 2018-10 | 2018-09 | 2018-08 | 2018-05 | 2018-04 | 2018-03 |
|---|---|---|---|---|---|---|---|---|---|---|---|---|---|---|---|---|---|---|---|---|---|
| pm25 | 25 | 26 | 27 | 38 | 35 | 44 | 46 | 37 | 22 | 20 | 27 | 50 | 50 | 31 | 56 | 45 | 29 | 25 | 51 | 69 | 83 |
| pm10 | 87 | 68 | 71 | 96 | 88 | 116 | 121 | 111 | 48 | 46 | 60 | 150 | 138 | 78 | 157 | 155 | 95 | 69 | 163 | 153 | 117 |
| no2 | 13 | 12 | 25 | 45 | 39 | 48 | 41 | 47 | 24 | 23 | 21 | 38 | 43 | 24 | 45 | 37 | 33 | 29 | 28 | 31 | 53 |
| so2 | 8.9 | 11 | 12 | 14 | 11 | 12 | 13 | 13 | 12 | 9.3 | 9.7 | 9.6 | 12 | 9.3 | 12 | 9.9 | 10 | 9.8 | 7.2 | 10 | 11 |
| co | 808 | 684 | 682 | 883 | 898 | 972 | 966 | 980 | 905 | 925 | 850 | 922 | 850 | 755 | 1 | 1 | 858 | 713 | 739 | 18 | 38 |
| o3 | 55 | 55 | 62 | 57 | 46 | 51 | 65 | 50 | 29 | 24 | 32 | 70 | 62 | 76 | 52 | 60 | 23 | 22 | 66 | 58 | 49 |
Police Commissionerate, Jaipur - RSPCB

| index | 2020-05 | 2020-04 | 2020-03 | 2020-02 | 2020-01 | 2019-12 | 2019-11 | 2019-10 | 2019-09 | 2019-08 | 2019-07 | 2019-05 | 2019-04 | 2019-02 | 2018-11 | 2018-10 | 2018-09 | 2018-08 | 2018-05 | 2018-04 | 2018-03 |
|---|---|---|---|---|---|---|---|---|---|---|---|---|---|---|---|---|---|---|---|---|---|
| pm25 | 57 | 35 | 42 | 73 | 46 | 56 | 79 | 79 | 39 | 33 | 36 | 73 | 74 | 58 | 107 | 83 | 55 | 52 | 90 | 96 | 107 |
| pm10 | 79 | 78 | 89 | 130 | 105 | 128 | 141 | 135 | 80 | 67 | 82 | 137 | 153 | 104 | 181 | 158 | 133 | 98 | 236 | 145 | 118 |
| no2 | 14 | 16 | 33 | 47 | 39 | 48 | 57 | 56 | 32 | 30 | 21 | - | 96 | 44 | 54 | 49 | 17 | 19 | 30 | 42 | 38 |
| co | 469 | 542 | 879 | 962 | 795 | 767 | 779 | 855 | 811 | 689 | 748 | 1 | 1 | 1 | 1 | 1 | 931 | 758 | 1 | 33 | 54 |
| o3 | 37 | 29 | 43 | 34 | 23 | 27 | 46 | 40 | 33 | 28 | 36 | 51 | 45 | 26 | 40 | 45 | 27 | 31 | 166 | 85 | 44 |
| so2 | 8.6 | 13 | 11 | 11 | 9.7 | 8.4 | 10 | 12 | 12 | 9 | 9.1 | 28 | 10 | 18 | 10 | 11 | 8.3 | 11 | 9.2 | 11 | 13 |
Shastri Nagar, Jaipur - RSPCB
| index | 2020-05 | 2020-04 | 2020-03 | 2020-02 | 2020-01 | 2019-12 | 2019-11 | 2019-10 | 2019-09 | 2019-08 | 2019-07 | 2019-06 | 2019-05 | 2019-04 | 2019-02 | 2018-11 | 2018-10 | 2018-09 | 2018-08 | 2018-05 | 2018-04 | 2018-03 |
|---|---|---|---|---|---|---|---|---|---|---|---|---|---|---|---|---|---|---|---|---|---|---|
| pm25 | 29 | 29 | 61 | 58 | 48 | 49 | 73 | 69 | 31 | 28 | 36 | 36 | 71 | 57 | 40 | 54 | 52 | 38 | 30 | 52 | 73 | 76 |
| pm10 | 78 | 77 | 78 | 117 | 97 | 126 | 138 | 138 | 68 | 57 | 72 | 89 | 177 | 152 | 78 | 128 | 82 | 69 | 83 | 174 | 150 | 115 |
| no2 | 14 | 14 | 26 | 42 | 41 | 47 | 29 | 30 | 18 | 18 | 16 | 20 | 16 | 19 | 25 | 51 | 33 | 13 | 12 | 29 | 43 | 51 |
| so2 | 16 | 14 | 14 | 14 | 13 | 16 | 12 | 15 | 12 | 11 | 11 | 19 | 14 | 18 | 9.9 | 13 | 13 | 13 | 8.8 | 9.3 | 8.5 | 14 |
| co | 673 | 509 | 696 | 1 | 931 | 1 | 937 | 1 | 572 | 417 | 455 | 711 | 704 | 867 | 1 | 1 | 1 | 701 | 510 | 1 | 13 | 32 |
| o3 | 59 | 63 | 77 | 65 | 56 | 46 | 47 | 38 | 30 | 23 | 31 | 57 | 69 | 65 | 60 | 35 | 52 | 26 | 26 | 70 | 74 | 67 |
VK Industrial Area Jaipur - RSPCB

| index | 2017-06 | 2017-05 | 2017-04 | 2017-03 | 2017-02 | 2017-01 | 2016-12 | 2016-11 | 2016-10 | 2016-09 | 2016-08 | 2016-07 | 2016-06 | 2016-05 | 2016-04 | 2016-03 |
|---|---|---|---|---|---|---|---|---|---|---|---|---|---|---|---|---|
| pm10 | 132 | 153 | 133 | 129 | 98 | 86 | 189 | 229 | 110 | 115 | 137 | 140 | 226 | 257 | 206 | 197 |
| no2 | 26 | 38 | 24 | 35 | 6.6 | 8.4 | 20 | 24 | 4.6 | 15 | 26 | 24 | 24 | 18 | 23 | 25 |
| so2 | 6.6 | 5.5 | 8.5 | 13 | 21 | 20 | 24 | 19 | 13 | 8 | 7.2 | 7.2 | 7.4 | 8.5 | 20 | 15 |
| co | 806 | 699 | 813 | 834 | 1 | 1 | 1 | 947 | 1 | 851 | 724 | 832 | 961 | 924 | 735 | 503 |
| pm25 | 47 | 66 | 71 | 74 | 94 | 98 | 130 | 114 | 107 | - | 94 | 87 | 88 | 96 | 100 | 96 |
| o3 | 32 | 49 | 29 | 29 | 71 | - | 27 | 30 | 31 | 27 | 10 | 27 | 26 | 45 | 102 | 10 |