Air Pollution in Jogeshwari: Real-time Air Quality Index and smog alert.
Pollution and air quality forecast for Jogeshwari. Today is Wednesday, May 13, 2026. The following air pollution values have been recorded for Jogeshwari:- particulate matter (PM10) suspended dust - 117 (Very Unhealthy)
- sulfur dioxide (SO2) - 13 (Good)
- particulate matter (PM2.5) dust - 63 (Unhealthy)
- carbon monoxide (CO) - 1000 (Good)
- nitrogen dioxide (NO2) - 22 (Good)
- ozone (O3) - 3 (Good)

What is the air quality in Jogeshwari today? Is the air polluted in Jogeshwari?. Is there smog?
What is the level of PM10 today in Jogeshwari? (particulate matter (PM10) suspended dust)
The current level of particulate matter PM10 in Jogeshwari is:
117 (Very Unhealthy)
The highest PM10 values usually occur in month: 120 (November 2018).
The lowest value of particulate matter PM10 pollution in Jogeshwari is usually recorded in: May (42).
What is the level of SO2 pollution? (sulfur dioxide (SO2))
13 (Good)
What is the current level of PM2.5 in Jogeshwari? (particulate matter (PM2.5) dust)
Today's PM2.5 level is:
63 (Unhealthy)
For comparison, the highest level of PM2.5 in Jogeshwari in the last 7 days was: 58 (Monday, October 31, 2022) and the lowest: 58 (Monday, October 31, 2022).
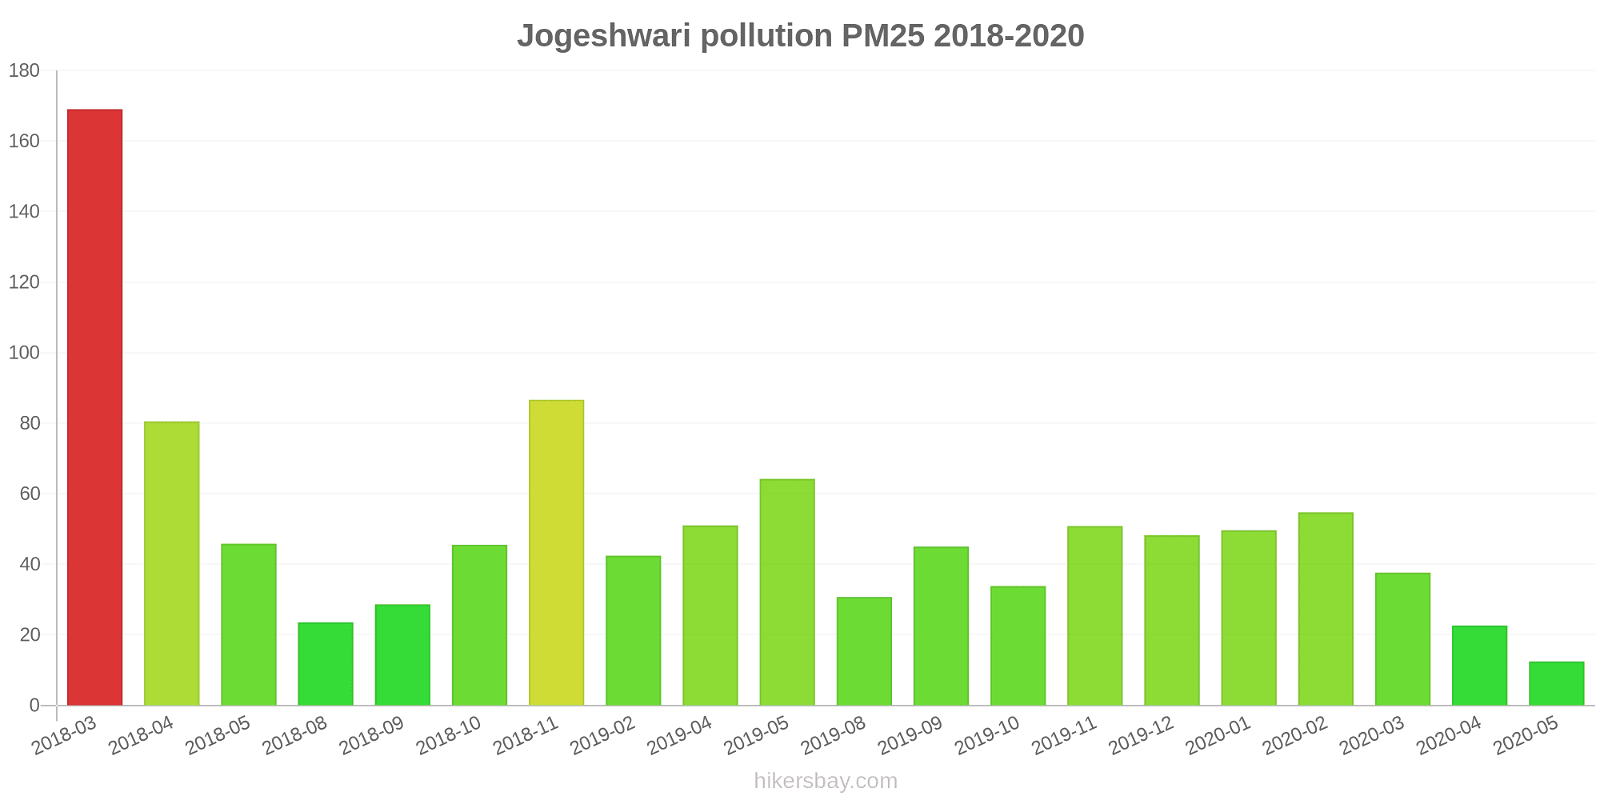
The highest PM2.5 values were recorded: 169 (March 2018).
The lowest level of particulate matter PM2.5 pollution occurs in month: May (12).
How high is the CO level? (carbon monoxide (CO))
1000 (Good)
How high is the level of NO2? (nitrogen dioxide (NO2))
22 (Good)
How is the O3 level today in Jogeshwari? (ozone (O3))
3 (Good)
Current data Monday, October 31, 2022, 1:45 AM
PM10 117 (Very Unhealthy)
SO2 13 (Good)
PM2,5 63 (Unhealthy)
CO 1000 (Good)
NO2 22 (Good)
O3 3 (Good)
Data on air pollution from recent days in Jogeshwari
index
2022-10-31
pm10
113
Very Unhealthy
so2
13
Good
pm25
58
Unhealthy
co
910
Good
no2
22
Good
o3
2
Good
data source »
Air pollution in Jogeshwari from March 2018 to May 2020
index
2020-05
2020-04
2020-03
2020-02
2020-01
2019-12
2019-11
2019-10
2019-09
2019-08
2019-07
2019-05
2019-04
2019-02
2018-11
2018-10
2018-09
2018-08
2018-05
2018-04
2018-03
pm25
12 (Good)
23 (Moderate)
38 (Unhealthy for Sensitive Groups)
55 (Unhealthy for Sensitive Groups)
50 (Unhealthy for Sensitive Groups)
48 (Unhealthy for Sensitive Groups)
51 (Unhealthy for Sensitive Groups)
34 (Moderate)
45 (Unhealthy for Sensitive Groups)
31 (Moderate)
- (Good)
64 (Unhealthy)
51 (Unhealthy for Sensitive Groups)
42 (Unhealthy for Sensitive Groups)
87 (Very Unhealthy)
46 (Unhealthy for Sensitive Groups)
29 (Moderate)
24 (Moderate)
46 (Unhealthy for Sensitive Groups)
81 (Very Unhealthy)
169 (Very bad Hazardous)
pm10
42 (Moderate)
43 (Moderate)
71 (Unhealthy for Sensitive Groups)
75 (Unhealthy for Sensitive Groups)
99 (Unhealthy)
87 (Unhealthy)
81 (Unhealthy)
64 (Unhealthy for Sensitive Groups)
62 (Unhealthy for Sensitive Groups)
66 (Unhealthy for Sensitive Groups)
77 (Unhealthy for Sensitive Groups)
89 (Unhealthy)
74 (Unhealthy for Sensitive Groups)
71 (Unhealthy for Sensitive Groups)
120 (Very Unhealthy)
81 (Unhealthy)
61 (Unhealthy for Sensitive Groups)
49 (Moderate)
105 (Unhealthy)
106 (Unhealthy)
119 (Very Unhealthy)
no2
23 (Good)
18 (Good)
22 (Good)
13 (Good)
14 (Good)
13 (Good)
6.4 (Good)
21 (Good)
16 (Good)
17 (Good)
25 (Good)
2.2 (Good)
1.8 (Good)
- (Good)
12 (Good)
27 (Good)
7.3 (Good)
18 (Good)
31 (Good)
23 (Good)
46 (Moderate)
so2
5.5 (Good)
5.5 (Good)
7.3 (Good)
9.3 (Good)
7.8 (Good)
9.3 (Good)
7.5 (Good)
8.2 (Good)
11 (Good)
6.5 (Good)
5.1 (Good)
3.3 (Good)
3.2 (Good)
8.1 (Good)
4.4 (Good)
6.7 (Good)
5 (Good)
4.8 (Good)
4.8 (Good)
5.9 (Good)
6.8 (Good)
co
427 (Good)
560 (Good)
650 (Good)
876 (Good)
750 (Good)
791 (Good)
879 (Good)
728 (Good)
654 (Good)
411 (Good)
454 (Good)
454 (Good)
382 (Good)
788 (Good)
844 (Good)
683 (Good)
531 (Good)
452 (Good)
510 (Good)
21 (Good)
48 (Good)
o3
50 (Good)
49 (Good)
153 (Unhealthy)
52 (Good)
25 (Good)
30 (Good)
31 (Good)
158 (Unhealthy)
13 (Good)
23 (Good)
17 (Good)
- (Good)
57 (Good)
70 (Good)
55 (Good)
72 (Moderate)
45 (Good)
18 (Good)
67 (Good)
62 (Good)
55 (Good)
data source »
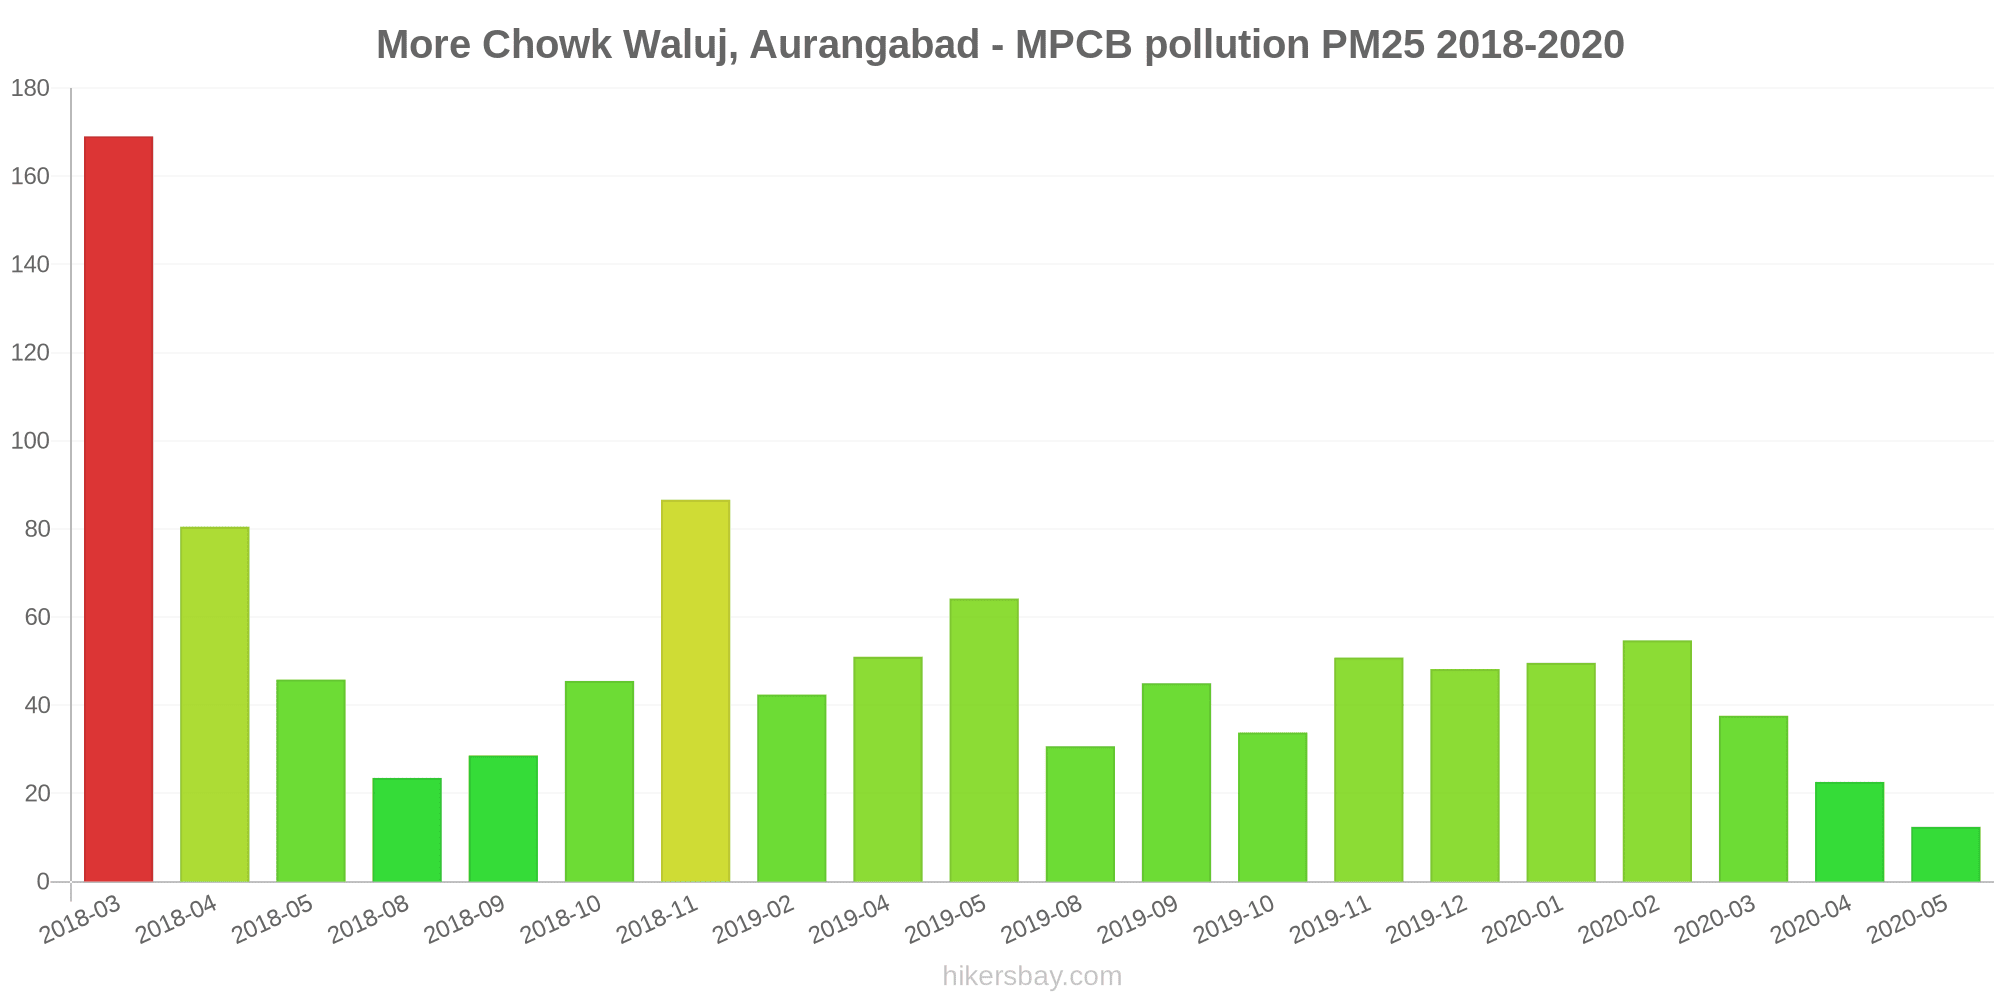
More Chowk Waluj, Aurangabad - MPCB
Monday, October 31, 2022, 1:45 AM
PM10 117 (Very Unhealthy)
particulate matter (PM10) suspended dust
SO2 13 (Good)
sulfur dioxide (SO2)
PM2,5 63 (Unhealthy)
particulate matter (PM2.5) dust
CO 1000 (Good)
carbon monoxide (CO)
NO2 22 (Good)
nitrogen dioxide (NO2)
O3 2.9 (Good)
ozone (O3)
More Chowk Waluj, Aurangabad - MPCB
index
2022-10-31
pm10
113
so2
13
pm25
58
co
910
no2
22
o3
2.1
More Chowk Waluj, Aurangabad - MPCB
2018-03 2020-05

index
2020-05
2020-04
2020-03
2020-02
2020-01
2019-12
2019-11
2019-10
2019-09
2019-08
2019-07
2019-05
2019-04
2019-02
2018-11
2018-10
2018-09
2018-08
2018-05
2018-04
2018-03
co
427
560
650
876
750
791
879
728
654
411
454
454
382
788
844
683
531
452
510
21
48
o3
50
49
153
52
25
30
31
158
13
23
17
-
57
70
55
72
45
18
67
62
55
pm25
12
23
38
55
50
48
51
34
45
31
-
64
51
42
87
46
29
24
46
81
169
pm10
42
43
71
75
99
87
81
64
62
66
77
89
74
71
120
81
61
49
105
106
119
no2
23
18
22
13
14
13
6.4
21
16
17
25
2.2
1.8
-
12
27
7.3
18
31
23
46
so2
5.5
5.5
7.3
9.3
7.8
9.3
7.5
8.2
11
6.5
5.1
3.3
3.2
8.1
4.4
6.7
5
4.8
4.8
5.9
6.8
* Pollution data source:
https://openaq.org
(caaqm)
The data is licensed under CC-By 4.0
PM10 117 (Very Unhealthy)
SO2 13 (Good)
PM2,5 63 (Unhealthy)
CO 1000 (Good)
NO2 22 (Good)
O3 3 (Good)
Data on air pollution from recent days in Jogeshwari
| index | 2022-10-31 |
|---|---|
| pm10 | 113 Very Unhealthy |
| so2 | 13 Good |
| pm25 | 58 Unhealthy |
| co | 910 Good |
| no2 | 22 Good |
| o3 | 2 Good |
| index | 2020-05 | 2020-04 | 2020-03 | 2020-02 | 2020-01 | 2019-12 | 2019-11 | 2019-10 | 2019-09 | 2019-08 | 2019-07 | 2019-05 | 2019-04 | 2019-02 | 2018-11 | 2018-10 | 2018-09 | 2018-08 | 2018-05 | 2018-04 | 2018-03 |
|---|---|---|---|---|---|---|---|---|---|---|---|---|---|---|---|---|---|---|---|---|---|
| pm25 | 12 (Good) | 23 (Moderate) | 38 (Unhealthy for Sensitive Groups) | 55 (Unhealthy for Sensitive Groups) | 50 (Unhealthy for Sensitive Groups) | 48 (Unhealthy for Sensitive Groups) | 51 (Unhealthy for Sensitive Groups) | 34 (Moderate) | 45 (Unhealthy for Sensitive Groups) | 31 (Moderate) | - (Good) | 64 (Unhealthy) | 51 (Unhealthy for Sensitive Groups) | 42 (Unhealthy for Sensitive Groups) | 87 (Very Unhealthy) | 46 (Unhealthy for Sensitive Groups) | 29 (Moderate) | 24 (Moderate) | 46 (Unhealthy for Sensitive Groups) | 81 (Very Unhealthy) | 169 (Very bad Hazardous) |
| pm10 | 42 (Moderate) | 43 (Moderate) | 71 (Unhealthy for Sensitive Groups) | 75 (Unhealthy for Sensitive Groups) | 99 (Unhealthy) | 87 (Unhealthy) | 81 (Unhealthy) | 64 (Unhealthy for Sensitive Groups) | 62 (Unhealthy for Sensitive Groups) | 66 (Unhealthy for Sensitive Groups) | 77 (Unhealthy for Sensitive Groups) | 89 (Unhealthy) | 74 (Unhealthy for Sensitive Groups) | 71 (Unhealthy for Sensitive Groups) | 120 (Very Unhealthy) | 81 (Unhealthy) | 61 (Unhealthy for Sensitive Groups) | 49 (Moderate) | 105 (Unhealthy) | 106 (Unhealthy) | 119 (Very Unhealthy) |
| no2 | 23 (Good) | 18 (Good) | 22 (Good) | 13 (Good) | 14 (Good) | 13 (Good) | 6.4 (Good) | 21 (Good) | 16 (Good) | 17 (Good) | 25 (Good) | 2.2 (Good) | 1.8 (Good) | - (Good) | 12 (Good) | 27 (Good) | 7.3 (Good) | 18 (Good) | 31 (Good) | 23 (Good) | 46 (Moderate) |
| so2 | 5.5 (Good) | 5.5 (Good) | 7.3 (Good) | 9.3 (Good) | 7.8 (Good) | 9.3 (Good) | 7.5 (Good) | 8.2 (Good) | 11 (Good) | 6.5 (Good) | 5.1 (Good) | 3.3 (Good) | 3.2 (Good) | 8.1 (Good) | 4.4 (Good) | 6.7 (Good) | 5 (Good) | 4.8 (Good) | 4.8 (Good) | 5.9 (Good) | 6.8 (Good) |
| co | 427 (Good) | 560 (Good) | 650 (Good) | 876 (Good) | 750 (Good) | 791 (Good) | 879 (Good) | 728 (Good) | 654 (Good) | 411 (Good) | 454 (Good) | 454 (Good) | 382 (Good) | 788 (Good) | 844 (Good) | 683 (Good) | 531 (Good) | 452 (Good) | 510 (Good) | 21 (Good) | 48 (Good) |
| o3 | 50 (Good) | 49 (Good) | 153 (Unhealthy) | 52 (Good) | 25 (Good) | 30 (Good) | 31 (Good) | 158 (Unhealthy) | 13 (Good) | 23 (Good) | 17 (Good) | - (Good) | 57 (Good) | 70 (Good) | 55 (Good) | 72 (Moderate) | 45 (Good) | 18 (Good) | 67 (Good) | 62 (Good) | 55 (Good) |
PM10 117 (Very Unhealthy)
particulate matter (PM10) suspended dustSO2 13 (Good)
sulfur dioxide (SO2)PM2,5 63 (Unhealthy)
particulate matter (PM2.5) dustCO 1000 (Good)
carbon monoxide (CO)NO2 22 (Good)
nitrogen dioxide (NO2)O3 2.9 (Good)
ozone (O3)More Chowk Waluj, Aurangabad - MPCB
| index | 2022-10-31 |
|---|---|
| pm10 | 113 |
| so2 | 13 |
| pm25 | 58 |
| co | 910 |
| no2 | 22 |
| o3 | 2.1 |
More Chowk Waluj, Aurangabad - MPCB
| index | 2020-05 | 2020-04 | 2020-03 | 2020-02 | 2020-01 | 2019-12 | 2019-11 | 2019-10 | 2019-09 | 2019-08 | 2019-07 | 2019-05 | 2019-04 | 2019-02 | 2018-11 | 2018-10 | 2018-09 | 2018-08 | 2018-05 | 2018-04 | 2018-03 |
|---|---|---|---|---|---|---|---|---|---|---|---|---|---|---|---|---|---|---|---|---|---|
| co | 427 | 560 | 650 | 876 | 750 | 791 | 879 | 728 | 654 | 411 | 454 | 454 | 382 | 788 | 844 | 683 | 531 | 452 | 510 | 21 | 48 |
| o3 | 50 | 49 | 153 | 52 | 25 | 30 | 31 | 158 | 13 | 23 | 17 | - | 57 | 70 | 55 | 72 | 45 | 18 | 67 | 62 | 55 |
| pm25 | 12 | 23 | 38 | 55 | 50 | 48 | 51 | 34 | 45 | 31 | - | 64 | 51 | 42 | 87 | 46 | 29 | 24 | 46 | 81 | 169 |
| pm10 | 42 | 43 | 71 | 75 | 99 | 87 | 81 | 64 | 62 | 66 | 77 | 89 | 74 | 71 | 120 | 81 | 61 | 49 | 105 | 106 | 119 |
| no2 | 23 | 18 | 22 | 13 | 14 | 13 | 6.4 | 21 | 16 | 17 | 25 | 2.2 | 1.8 | - | 12 | 27 | 7.3 | 18 | 31 | 23 | 46 |
| so2 | 5.5 | 5.5 | 7.3 | 9.3 | 7.8 | 9.3 | 7.5 | 8.2 | 11 | 6.5 | 5.1 | 3.3 | 3.2 | 8.1 | 4.4 | 6.7 | 5 | 4.8 | 4.8 | 5.9 | 6.8 |