Air Pollution in Jalandhar: Real-time Air Quality Index and smog alert.
Pollution and air quality forecast for Jalandhar. Today is Wednesday, May 13, 2026. The following air pollution values have been recorded for Jalandhar:- particulate matter (PM10) suspended dust - 103 (Unhealthy)
- sulfur dioxide (SO2) - 16 (Good)
- particulate matter (PM2.5) dust - 56 (Unhealthy)
- carbon monoxide (CO) - 720 (Good)
- nitrogen dioxide (NO2) - 25 (Good)
- ozone (O3) - 7 (Good)

What is the air quality in Jalandhar today? Is the air polluted in Jalandhar?. Is there smog?
What is the level of PM10 today in Jalandhar? (particulate matter (PM10) suspended dust)
The current level of particulate matter PM10 in Jalandhar is:
103 (Unhealthy)
The highest PM10 values usually occur in month: 178 (February 2019).
The lowest value of particulate matter PM10 pollution in Jalandhar is usually recorded in: September (43).
What is the level of SO2 pollution? (sulfur dioxide (SO2))
16 (Good)
What is the current level of PM2.5 in Jalandhar? (particulate matter (PM2.5) dust)
Today's PM2.5 level is:
56 (Unhealthy)
For comparison, the highest level of PM2.5 in Jalandhar in the last 7 days was: 56 (Monday, October 31, 2022) and the lowest: 56 (Monday, October 31, 2022).
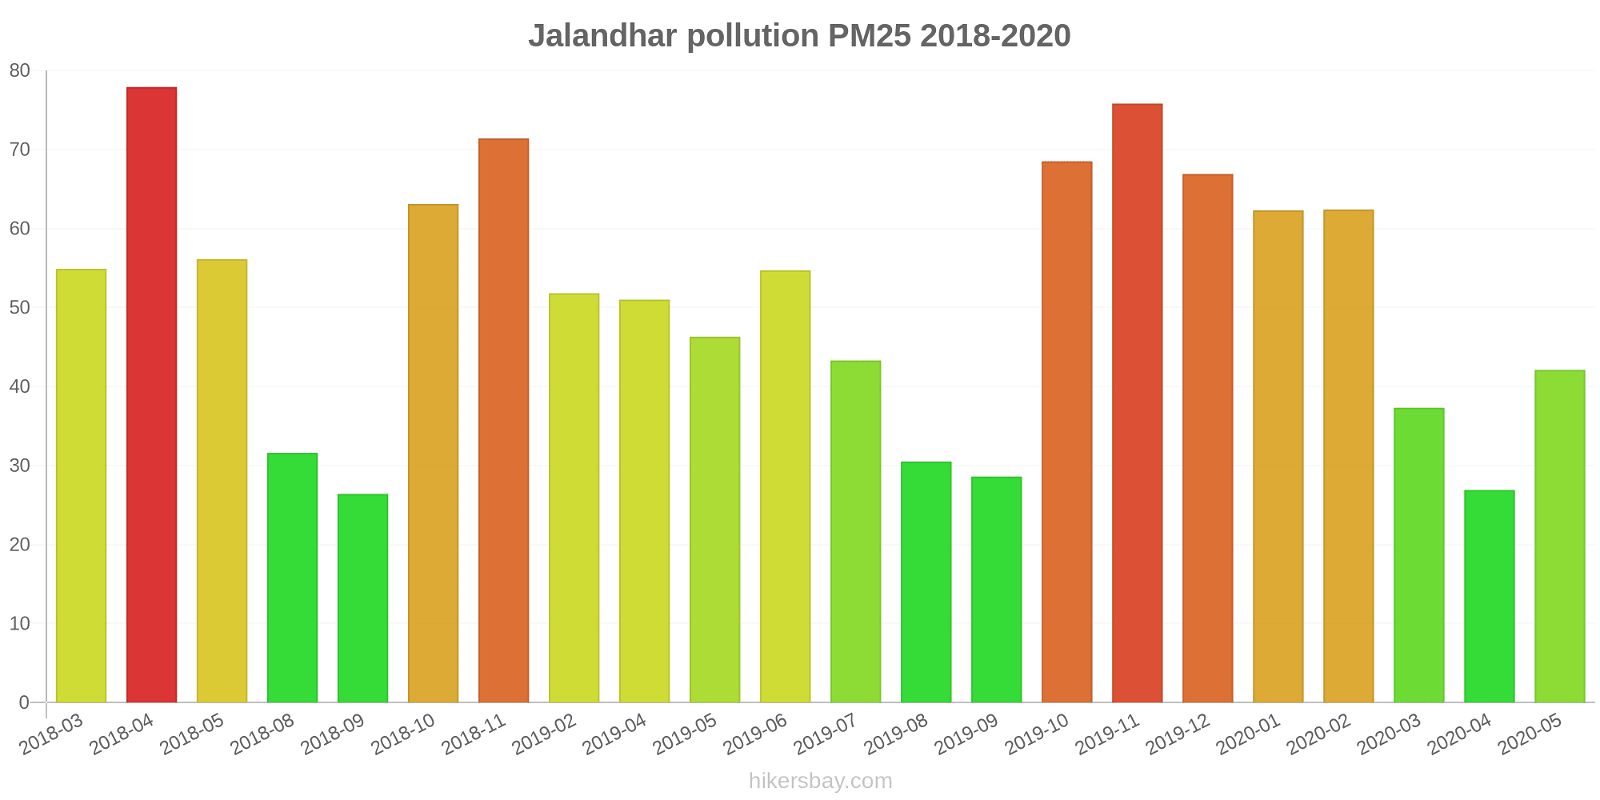
The highest PM2.5 values were recorded: 78 (April 2018).
The lowest level of particulate matter PM2.5 pollution occurs in month: September (26).
How high is the CO level? (carbon monoxide (CO))
720 (Good)
How high is the level of NO2? (nitrogen dioxide (NO2))
25 (Good)
How is the O3 level today in Jalandhar? (ozone (O3))
7 (Good)
Current data Monday, October 31, 2022, 2:00 AM
PM10 103 (Unhealthy)
SO2 16 (Good)
PM2,5 56 (Unhealthy)
CO 720 (Good)
NO2 25 (Good)
O3 7 (Good)
Data on air pollution from recent days in Jalandhar
index
2022-10-31
pm10
104
Unhealthy
so2
16
Good
pm25
56
Unhealthy
co
705
Good
no2
25
Good
o3
7
Good
data source »
Air pollution in Jalandhar from March 2018 to May 2020
index
2020-05
2020-04
2020-03
2020-02
2020-01
2019-12
2019-11
2019-10
2019-09
2019-08
2019-07
2019-06
2019-05
2019-04
2019-02
2018-11
2018-10
2018-09
2018-08
2018-05
2018-04
2018-03
pm25
42 (Unhealthy for Sensitive Groups)
27 (Moderate)
37 (Unhealthy for Sensitive Groups)
62 (Unhealthy)
62 (Unhealthy)
67 (Unhealthy)
76 (Very Unhealthy)
69 (Unhealthy)
29 (Moderate)
31 (Moderate)
43 (Unhealthy for Sensitive Groups)
55 (Unhealthy for Sensitive Groups)
46 (Unhealthy for Sensitive Groups)
51 (Unhealthy for Sensitive Groups)
52 (Unhealthy for Sensitive Groups)
71 (Unhealthy)
63 (Unhealthy)
26 (Moderate)
32 (Moderate)
56 (Unhealthy)
78 (Very Unhealthy)
55 (Unhealthy for Sensitive Groups)
pm10
72 (Unhealthy for Sensitive Groups)
46 (Moderate)
63 (Unhealthy for Sensitive Groups)
107 (Unhealthy)
108 (Unhealthy)
115 (Very Unhealthy)
131 (Very Unhealthy)
118 (Very Unhealthy)
70 (Unhealthy for Sensitive Groups)
112 (Very Unhealthy)
121 (Very Unhealthy)
128 (Very Unhealthy)
113 (Very Unhealthy)
171 (Very bad Hazardous)
178 (Very bad Hazardous)
112 (Very Unhealthy)
104 (Unhealthy)
43 (Moderate)
52 (Unhealthy for Sensitive Groups)
92 (Unhealthy)
112 (Very Unhealthy)
103 (Unhealthy)
no2
5.8 (Good)
9 (Good)
8.3 (Good)
15 (Good)
24 (Good)
17 (Good)
36 (Good)
25 (Good)
30 (Good)
20 (Good)
30 (Good)
28 (Good)
28 (Good)
31 (Good)
9.1 (Good)
17 (Good)
23 (Good)
26 (Good)
12 (Good)
15 (Good)
8.3 (Good)
22 (Good)
so2
9.2 (Good)
12 (Good)
11 (Good)
9.3 (Good)
8.6 (Good)
11 (Good)
13 (Good)
15 (Good)
16 (Good)
34 (Good)
131 (Unhealthy for Sensitive Groups)
11 (Good)
23 (Good)
6.2 (Good)
11 (Good)
6.4 (Good)
7.5 (Good)
7.6 (Good)
8.1 (Good)
- (Good)
- (Good)
18 (Good)
co
420 (Good)
319 (Good)
655 (Good)
807 (Good)
760 (Good)
739 (Good)
881 (Good)
829 (Good)
857 (Good)
880 (Good)
1 (Good)
478 (Good)
822 (Good)
906 (Good)
927 (Good)
666 (Good)
754 (Good)
658 (Good)
812 (Good)
954 (Good)
27 (Good)
54 (Good)
o3
23 (Good)
21 (Good)
19 (Good)
25 (Good)
18 (Good)
14 (Good)
15 (Good)
23 (Good)
15 (Good)
15 (Good)
26 (Good)
27 (Good)
18 (Good)
13 (Good)
15 (Good)
17 (Good)
22 (Good)
16 (Good)
24 (Good)
16 (Good)
23 (Good)
17 (Good)
data source »
Quality of life in Jalandhar
Green and Parks in the City
Jalandhar
47%
Nepal: 32%
Bangladesh: 33%
Bhutan: 82%
Sri Lanka: 59%
Pakistan: 49%
particulate matter PM2.5
Jalandhar
75 (Very Unhealthy)
Pleasure of spending time in the city
Jalandhar
32%
Nepal: 32%
Bangladesh: 26%
Bhutan: 61%
Sri Lanka: 52%
Pakistan: 43%
particulate matter PM10
Jalandhar
140 (Very Unhealthy)
Air Pollution
Jalandhar
76%
Nepal: 76%
Bangladesh: 78%
Bhutan: 45%
Sri Lanka: 53%
Pakistan: 64%
Garbage Disposal
Jalandhar
27%
Nepal: 25%
Bangladesh: 22%
Bhutan: 47%
Sri Lanka: 41%
Pakistan: 34%
Availability and quality of drinking water
Jalandhar
46%
Nepal: 36%
Bangladesh: 44%
Bhutan: 64%
Sri Lanka: 65%
Pakistan: 44%
Cleanliness and tidiness
Jalandhar
35%
Nepal: 27%
Bangladesh: 23%
Bhutan: 57%
Sri Lanka: 52%
Pakistan: 40%
Noise and Light pollution
Jalandhar
64%
Nepal: 55%
Bangladesh: 63%
Bhutan: 55%
Sri Lanka: 50%
Pakistan: 59%
Water Pollution
Jalandhar
67%
Nepal: 76%
Bangladesh: 74%
Bhutan: 56%
Sri Lanka: 57%
Pakistan: 70%
Source: Numbeo
Civil Line, Jalandhar - PPCB
Monday, October 31, 2022, 2:00 AM
PM10 103 (Unhealthy)
particulate matter (PM10) suspended dust
SO2 16 (Good)
sulfur dioxide (SO2)
PM2,5 56 (Unhealthy)
particulate matter (PM2.5) dust
CO 720 (Good)
carbon monoxide (CO)
NO2 25 (Good)
nitrogen dioxide (NO2)
O3 7.2 (Good)
ozone (O3)
Civil Line, Jalandhar - PPCB
index
2022-10-31
pm10
104
so2
16
pm25
56
co
705
no2
25
o3
7.1
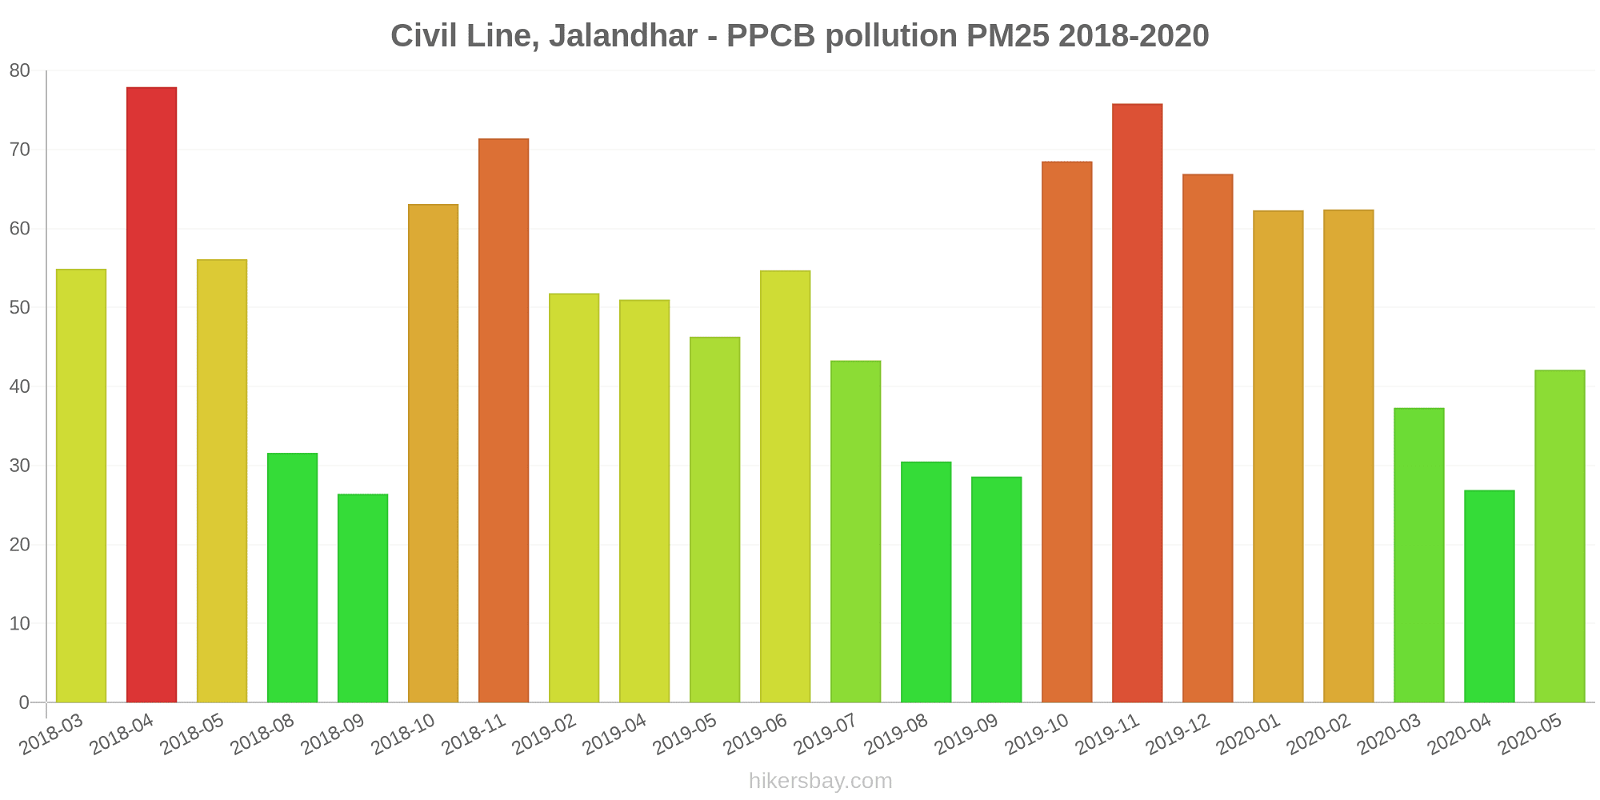
Civil Line, Jalandhar - PPCB
2018-03 2020-05
index
2020-05
2020-04
2020-03
2020-02
2020-01
2019-12
2019-11
2019-10
2019-09
2019-08
2019-07
2019-06
2019-05
2019-04
2019-02
2018-11
2018-10
2018-09
2018-08
2018-05
2018-04
2018-03
pm25
42
27
37
62
62
67
76
69
29
31
43
55
46
51
52
71
63
26
32
56
78
55
pm10
72
46
63
107
108
115
131
118
70
112
121
128
113
171
178
112
104
43
52
92
112
103
co
420
319
655
807
760
739
881
829
857
880
1
478
822
906
927
666
754
658
812
954
27
54
o3
23
21
19
25
18
14
15
23
15
15
26
27
18
13
15
17
22
16
24
16
23
17
no2
5.8
9
8.3
15
24
17
36
25
30
20
30
28
28
31
9.1
17
23
26
12
15
8.3
22
so2
9.2
12
11
9.3
8.6
11
13
15
16
34
131
11
23
6.2
11
6.4
7.5
7.6
8.1
-
-
18
* Pollution data source:
https://openaq.org
(caaqm)
The data is licensed under CC-By 4.0
PM10 103 (Unhealthy)
SO2 16 (Good)
PM2,5 56 (Unhealthy)
CO 720 (Good)
NO2 25 (Good)
O3 7 (Good)
Data on air pollution from recent days in Jalandhar
| index | 2022-10-31 |
|---|---|
| pm10 | 104 Unhealthy |
| so2 | 16 Good |
| pm25 | 56 Unhealthy |
| co | 705 Good |
| no2 | 25 Good |
| o3 | 7 Good |

| index | 2020-05 | 2020-04 | 2020-03 | 2020-02 | 2020-01 | 2019-12 | 2019-11 | 2019-10 | 2019-09 | 2019-08 | 2019-07 | 2019-06 | 2019-05 | 2019-04 | 2019-02 | 2018-11 | 2018-10 | 2018-09 | 2018-08 | 2018-05 | 2018-04 | 2018-03 |
|---|---|---|---|---|---|---|---|---|---|---|---|---|---|---|---|---|---|---|---|---|---|---|
| pm25 | 42 (Unhealthy for Sensitive Groups) | 27 (Moderate) | 37 (Unhealthy for Sensitive Groups) | 62 (Unhealthy) | 62 (Unhealthy) | 67 (Unhealthy) | 76 (Very Unhealthy) | 69 (Unhealthy) | 29 (Moderate) | 31 (Moderate) | 43 (Unhealthy for Sensitive Groups) | 55 (Unhealthy for Sensitive Groups) | 46 (Unhealthy for Sensitive Groups) | 51 (Unhealthy for Sensitive Groups) | 52 (Unhealthy for Sensitive Groups) | 71 (Unhealthy) | 63 (Unhealthy) | 26 (Moderate) | 32 (Moderate) | 56 (Unhealthy) | 78 (Very Unhealthy) | 55 (Unhealthy for Sensitive Groups) |
| pm10 | 72 (Unhealthy for Sensitive Groups) | 46 (Moderate) | 63 (Unhealthy for Sensitive Groups) | 107 (Unhealthy) | 108 (Unhealthy) | 115 (Very Unhealthy) | 131 (Very Unhealthy) | 118 (Very Unhealthy) | 70 (Unhealthy for Sensitive Groups) | 112 (Very Unhealthy) | 121 (Very Unhealthy) | 128 (Very Unhealthy) | 113 (Very Unhealthy) | 171 (Very bad Hazardous) | 178 (Very bad Hazardous) | 112 (Very Unhealthy) | 104 (Unhealthy) | 43 (Moderate) | 52 (Unhealthy for Sensitive Groups) | 92 (Unhealthy) | 112 (Very Unhealthy) | 103 (Unhealthy) |
| no2 | 5.8 (Good) | 9 (Good) | 8.3 (Good) | 15 (Good) | 24 (Good) | 17 (Good) | 36 (Good) | 25 (Good) | 30 (Good) | 20 (Good) | 30 (Good) | 28 (Good) | 28 (Good) | 31 (Good) | 9.1 (Good) | 17 (Good) | 23 (Good) | 26 (Good) | 12 (Good) | 15 (Good) | 8.3 (Good) | 22 (Good) |
| so2 | 9.2 (Good) | 12 (Good) | 11 (Good) | 9.3 (Good) | 8.6 (Good) | 11 (Good) | 13 (Good) | 15 (Good) | 16 (Good) | 34 (Good) | 131 (Unhealthy for Sensitive Groups) | 11 (Good) | 23 (Good) | 6.2 (Good) | 11 (Good) | 6.4 (Good) | 7.5 (Good) | 7.6 (Good) | 8.1 (Good) | - (Good) | - (Good) | 18 (Good) |
| co | 420 (Good) | 319 (Good) | 655 (Good) | 807 (Good) | 760 (Good) | 739 (Good) | 881 (Good) | 829 (Good) | 857 (Good) | 880 (Good) | 1 (Good) | 478 (Good) | 822 (Good) | 906 (Good) | 927 (Good) | 666 (Good) | 754 (Good) | 658 (Good) | 812 (Good) | 954 (Good) | 27 (Good) | 54 (Good) |
| o3 | 23 (Good) | 21 (Good) | 19 (Good) | 25 (Good) | 18 (Good) | 14 (Good) | 15 (Good) | 23 (Good) | 15 (Good) | 15 (Good) | 26 (Good) | 27 (Good) | 18 (Good) | 13 (Good) | 15 (Good) | 17 (Good) | 22 (Good) | 16 (Good) | 24 (Good) | 16 (Good) | 23 (Good) | 17 (Good) |
Green and Parks in the City
Jalandhar 47%
Nepal: 32% Bangladesh: 33% Bhutan: 82% Sri Lanka: 59% Pakistan: 49%particulate matter PM2.5
Jalandhar 75 (Very Unhealthy)
Pleasure of spending time in the city
Jalandhar 32%
Nepal: 32% Bangladesh: 26% Bhutan: 61% Sri Lanka: 52% Pakistan: 43%particulate matter PM10
Jalandhar 140 (Very Unhealthy)
Air Pollution
Jalandhar 76%
Nepal: 76% Bangladesh: 78% Bhutan: 45% Sri Lanka: 53% Pakistan: 64%Garbage Disposal
Jalandhar 27%
Nepal: 25% Bangladesh: 22% Bhutan: 47% Sri Lanka: 41% Pakistan: 34%Availability and quality of drinking water
Jalandhar 46%
Nepal: 36% Bangladesh: 44% Bhutan: 64% Sri Lanka: 65% Pakistan: 44%Cleanliness and tidiness
Jalandhar 35%
Nepal: 27% Bangladesh: 23% Bhutan: 57% Sri Lanka: 52% Pakistan: 40%Noise and Light pollution
Jalandhar 64%
Nepal: 55% Bangladesh: 63% Bhutan: 55% Sri Lanka: 50% Pakistan: 59%Water Pollution
Jalandhar 67%
Nepal: 76% Bangladesh: 74% Bhutan: 56% Sri Lanka: 57% Pakistan: 70%PM10 103 (Unhealthy)
particulate matter (PM10) suspended dustSO2 16 (Good)
sulfur dioxide (SO2)PM2,5 56 (Unhealthy)
particulate matter (PM2.5) dustCO 720 (Good)
carbon monoxide (CO)NO2 25 (Good)
nitrogen dioxide (NO2)O3 7.2 (Good)
ozone (O3)Civil Line, Jalandhar - PPCB
| index | 2022-10-31 |
|---|---|
| pm10 | 104 |
| so2 | 16 |
| pm25 | 56 |
| co | 705 |
| no2 | 25 |
| o3 | 7.1 |
Civil Line, Jalandhar - PPCB

| index | 2020-05 | 2020-04 | 2020-03 | 2020-02 | 2020-01 | 2019-12 | 2019-11 | 2019-10 | 2019-09 | 2019-08 | 2019-07 | 2019-06 | 2019-05 | 2019-04 | 2019-02 | 2018-11 | 2018-10 | 2018-09 | 2018-08 | 2018-05 | 2018-04 | 2018-03 |
|---|---|---|---|---|---|---|---|---|---|---|---|---|---|---|---|---|---|---|---|---|---|---|
| pm25 | 42 | 27 | 37 | 62 | 62 | 67 | 76 | 69 | 29 | 31 | 43 | 55 | 46 | 51 | 52 | 71 | 63 | 26 | 32 | 56 | 78 | 55 |
| pm10 | 72 | 46 | 63 | 107 | 108 | 115 | 131 | 118 | 70 | 112 | 121 | 128 | 113 | 171 | 178 | 112 | 104 | 43 | 52 | 92 | 112 | 103 |
| co | 420 | 319 | 655 | 807 | 760 | 739 | 881 | 829 | 857 | 880 | 1 | 478 | 822 | 906 | 927 | 666 | 754 | 658 | 812 | 954 | 27 | 54 |
| o3 | 23 | 21 | 19 | 25 | 18 | 14 | 15 | 23 | 15 | 15 | 26 | 27 | 18 | 13 | 15 | 17 | 22 | 16 | 24 | 16 | 23 | 17 |
| no2 | 5.8 | 9 | 8.3 | 15 | 24 | 17 | 36 | 25 | 30 | 20 | 30 | 28 | 28 | 31 | 9.1 | 17 | 23 | 26 | 12 | 15 | 8.3 | 22 |
| so2 | 9.2 | 12 | 11 | 9.3 | 8.6 | 11 | 13 | 15 | 16 | 34 | 131 | 11 | 23 | 6.2 | 11 | 6.4 | 7.5 | 7.6 | 8.1 | - | - | 18 |