Air Pollution in Kota: Real-time Air Quality Index and smog alert.
Pollution and air quality forecast for Kota. Today is Wednesday, May 13, 2026. The following air pollution values have been recorded for Kota:- particulate matter (PM10) suspended dust - 159 (Very bad Hazardous)
- sulfur dioxide (SO2) - 11 (Good)
- particulate matter (PM2.5) dust - 90 (Very Unhealthy)
- carbon monoxide (CO) - 1020 (Good)
- nitrogen dioxide (NO2) - 10 (Good)
- ozone (O3) - 15 (Good)

What is the air quality in Kota today? Is the air polluted in Kota?. Is there smog?
What is the level of PM10 today in Kota? (particulate matter (PM10) suspended dust)
The current level of particulate matter PM10 in Kota is:
159 (Very bad Hazardous)
The highest PM10 values usually occur in month: 224 (November 2019).
The lowest value of particulate matter PM10 pollution in Kota is usually recorded in: September (50).
What is the level of SO2 pollution? (sulfur dioxide (SO2))
11 (Good)
What is the current level of PM2.5 in Kota? (particulate matter (PM2.5) dust)
Today's PM2.5 level is:
90 (Very Unhealthy)
For comparison, the highest level of PM2.5 in Kota in the last 7 days was: 77 (Monday, October 31, 2022) and the lowest: 77 (Monday, October 31, 2022).
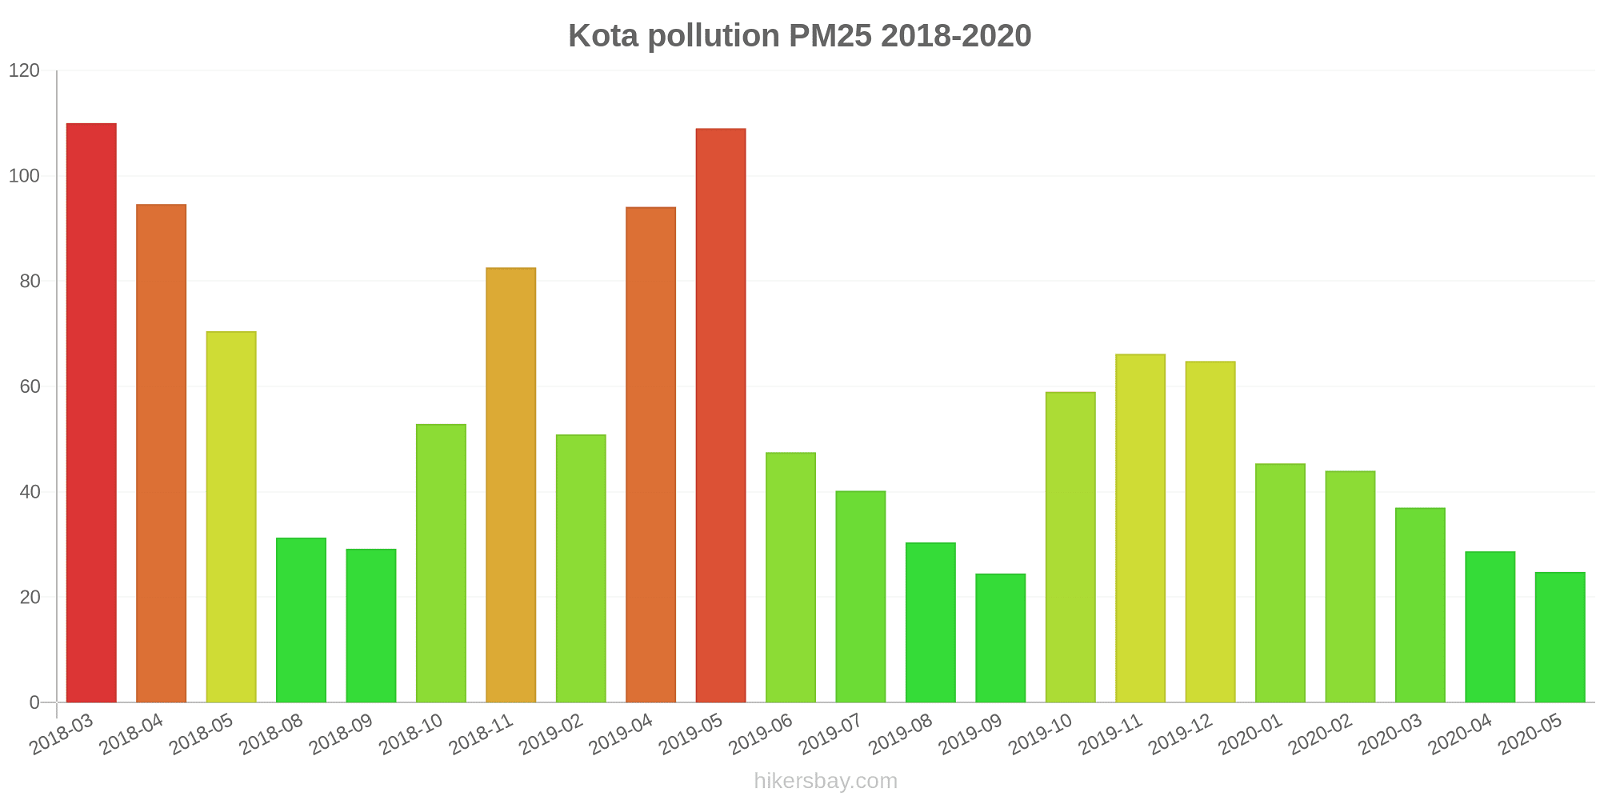
The highest PM2.5 values were recorded: 110 (March 2018).
The lowest level of particulate matter PM2.5 pollution occurs in month: September (25).
How high is the CO level? (carbon monoxide (CO))
1020 (Good)
How high is the level of NO2? (nitrogen dioxide (NO2))
10 (Good)
How is the O3 level today in Kota? (ozone (O3))
15 (Good)
Current data Monday, October 31, 2022, 2:00 AM
PM10 159 (Very bad Hazardous)
SO2 11 (Good)
PM2,5 90 (Very Unhealthy)
CO 1020 (Good)
NO2 10 (Good)
O3 15 (Good)
Data on air pollution from recent days in Kota
index
2022-10-31
pm10
144
Very Unhealthy
so2
11
Good
pm25
77
Very Unhealthy
co
920
Good
no2
10
Good
o3
15
Good
data source »
Air pollution in Kota from March 2018 to May 2020
index
2020-05
2020-04
2020-03
2020-02
2020-01
2019-12
2019-11
2019-10
2019-09
2019-08
2019-07
2019-06
2019-05
2019-04
2019-02
2018-11
2018-10
2018-09
2018-08
2018-05
2018-04
2018-03
pm25
25 (Moderate)
29 (Moderate)
37 (Unhealthy for Sensitive Groups)
44 (Unhealthy for Sensitive Groups)
45 (Unhealthy for Sensitive Groups)
65 (Unhealthy)
66 (Unhealthy)
59 (Unhealthy)
25 (Moderate)
30 (Moderate)
40 (Unhealthy for Sensitive Groups)
48 (Unhealthy for Sensitive Groups)
109 (Very Unhealthy)
94 (Very Unhealthy)
51 (Unhealthy for Sensitive Groups)
83 (Very Unhealthy)
53 (Unhealthy for Sensitive Groups)
29 (Moderate)
31 (Moderate)
71 (Unhealthy)
95 (Very Unhealthy)
110 (Very bad Hazardous)
pm10
53 (Unhealthy for Sensitive Groups)
67 (Unhealthy for Sensitive Groups)
80 (Unhealthy)
91 (Unhealthy)
97 (Unhealthy)
133 (Very Unhealthy)
224 (Very bad Hazardous)
103 (Unhealthy)
50 (Unhealthy for Sensitive Groups)
61 (Unhealthy for Sensitive Groups)
80 (Unhealthy)
87 (Unhealthy)
172 (Very bad Hazardous)
120 (Very Unhealthy)
101 (Unhealthy)
183 (Very bad Hazardous)
136 (Very Unhealthy)
70 (Unhealthy for Sensitive Groups)
67 (Unhealthy for Sensitive Groups)
195 (Very bad Hazardous)
146 (Very Unhealthy)
135 (Very Unhealthy)
no2
18 (Good)
12 (Good)
25 (Good)
34 (Good)
23 (Good)
50 (Moderate)
23 (Good)
24 (Good)
16 (Good)
24 (Good)
22 (Good)
12 (Good)
27 (Good)
26 (Good)
55 (Moderate)
22 (Good)
34 (Good)
19 (Good)
21 (Good)
9.6 (Good)
13 (Good)
21 (Good)
so2
8.7 (Good)
9.2 (Good)
9.7 (Good)
9.2 (Good)
8.4 (Good)
8.9 (Good)
8.8 (Good)
8.7 (Good)
12 (Good)
9.6 (Good)
9.9 (Good)
8.3 (Good)
11 (Good)
9 (Good)
9.3 (Good)
12 (Good)
11 (Good)
9.9 (Good)
9.2 (Good)
9.7 (Good)
17 (Good)
25 (Good)
co
468 (Good)
528 (Good)
496 (Good)
618 (Good)
630 (Good)
698 (Good)
779 (Good)
701 (Good)
736 (Good)
869 (Good)
883 (Good)
648 (Good)
375 (Good)
610 (Good)
694 (Good)
962 (Good)
866 (Good)
833 (Good)
722 (Good)
605 (Good)
22 (Good)
46 (Good)
o3
46 (Good)
45 (Good)
38 (Good)
33 (Good)
29 (Good)
38 (Good)
51 (Good)
32 (Good)
29 (Good)
25 (Good)
32 (Good)
141 (Unhealthy for Sensitive Groups)
24 (Good)
21 (Good)
27 (Good)
26 (Good)
23 (Good)
20 (Good)
17 (Good)
- (Good)
- (Good)
- (Good)
data source »
Quality of life in Kota
Green and Parks in the City
Kota
66%
Nepal: 32%
Bangladesh: 33%
Bhutan: 82%
Sri Lanka: 59%
Pakistan: 49%
particulate matter PM2.5
Kota
84 (Very Unhealthy)
Pleasure of spending time in the city
Kota
44%
Nepal: 32%
Bangladesh: 26%
Bhutan: 61%
Sri Lanka: 52%
Pakistan: 43%
particulate matter PM10
Kota
160 (Very bad Hazardous)
Air Pollution
Kota
68%
Nepal: 76%
Bangladesh: 78%
Bhutan: 45%
Sri Lanka: 53%
Pakistan: 64%
Garbage Disposal
Kota
31%
Nepal: 25%
Bangladesh: 22%
Bhutan: 47%
Sri Lanka: 41%
Pakistan: 34%
Availability and quality of drinking water
Kota
52%
Nepal: 36%
Bangladesh: 44%
Bhutan: 64%
Sri Lanka: 65%
Pakistan: 44%
Cleanliness and tidiness
Kota
44%
Nepal: 27%
Bangladesh: 23%
Bhutan: 57%
Sri Lanka: 52%
Pakistan: 40%
Noise and Light pollution
Kota
51%
Nepal: 55%
Bangladesh: 63%
Bhutan: 55%
Sri Lanka: 50%
Pakistan: 59%
Water Pollution
Kota
54%
Nepal: 76%
Bangladesh: 74%
Bhutan: 56%
Sri Lanka: 57%
Pakistan: 70%
Source: Numbeo
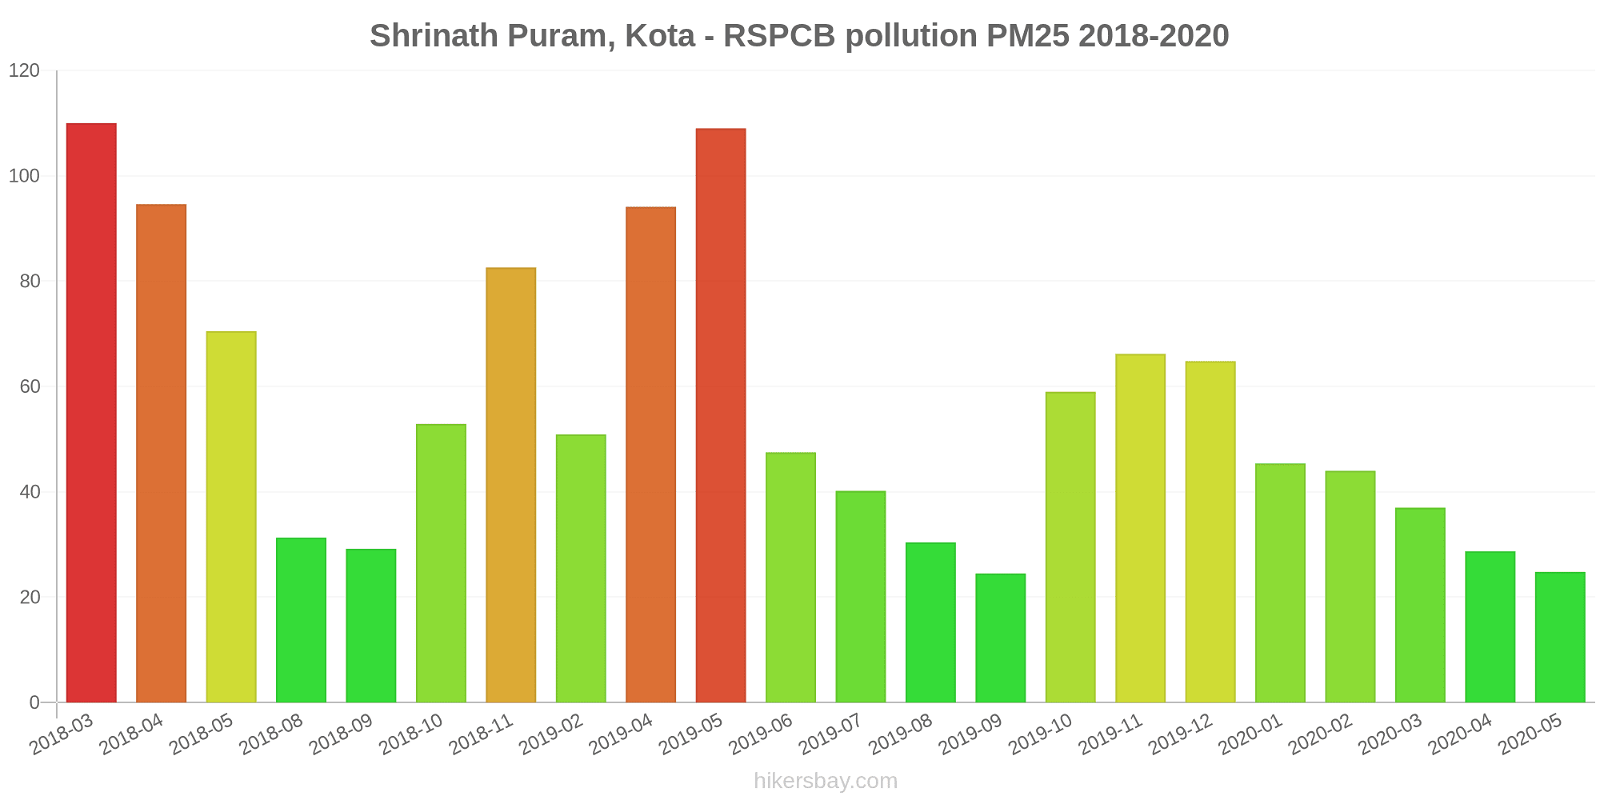
Shrinath Puram, Kota - RSPCB
Monday, October 31, 2022, 2:00 AM
PM10 159 (Very bad Hazardous)
particulate matter (PM10) suspended dust
SO2 11 (Good)
sulfur dioxide (SO2)
PM2,5 90 (Very Unhealthy)
particulate matter (PM2.5) dust
CO 1020 (Good)
carbon monoxide (CO)
NO2 9.5 (Good)
nitrogen dioxide (NO2)
O3 15 (Good)
ozone (O3)
Shrinath Puram, Kota - RSPCB
index
2022-10-31
pm10
144
so2
11
pm25
77
co
920
no2
9.7
o3
15
Shrinath Puram, Kota - RSPCB
2018-03 2020-05
index
2020-05
2020-04
2020-03
2020-02
2020-01
2019-12
2019-11
2019-10
2019-09
2019-08
2019-07
2019-06
2019-05
2019-04
2019-02
2018-11
2018-10
2018-09
2018-08
2018-05
2018-04
2018-03
pm25
25
29
37
44
45
65
66
59
25
30
40
48
109
94
51
83
53
29
31
71
95
110
pm10
53
67
80
91
97
133
224
103
50
61
80
87
172
120
101
183
136
70
67
195
146
135
no2
18
12
25
34
23
50
23
24
16
24
22
12
27
26
55
22
34
19
21
9.6
13
21
so2
8.7
9.2
9.7
9.2
8.4
8.9
8.8
8.7
12
9.6
9.9
8.3
11
9
9.3
12
11
9.9
9.2
9.7
17
25
co
468
528
496
618
630
698
779
701
736
869
883
648
375
610
694
962
866
833
722
605
22
46
o3
46
45
38
33
29
38
51
32
29
25
32
141
24
21
27
26
23
20
17
-
-
-
* Pollution data source:
https://openaq.org
(caaqm)
The data is licensed under CC-By 4.0
PM10 159 (Very bad Hazardous)
SO2 11 (Good)
PM2,5 90 (Very Unhealthy)
CO 1020 (Good)
NO2 10 (Good)
O3 15 (Good)
Data on air pollution from recent days in Kota
| index | 2022-10-31 |
|---|---|
| pm10 | 144 Very Unhealthy |
| so2 | 11 Good |
| pm25 | 77 Very Unhealthy |
| co | 920 Good |
| no2 | 10 Good |
| o3 | 15 Good |

| index | 2020-05 | 2020-04 | 2020-03 | 2020-02 | 2020-01 | 2019-12 | 2019-11 | 2019-10 | 2019-09 | 2019-08 | 2019-07 | 2019-06 | 2019-05 | 2019-04 | 2019-02 | 2018-11 | 2018-10 | 2018-09 | 2018-08 | 2018-05 | 2018-04 | 2018-03 |
|---|---|---|---|---|---|---|---|---|---|---|---|---|---|---|---|---|---|---|---|---|---|---|
| pm25 | 25 (Moderate) | 29 (Moderate) | 37 (Unhealthy for Sensitive Groups) | 44 (Unhealthy for Sensitive Groups) | 45 (Unhealthy for Sensitive Groups) | 65 (Unhealthy) | 66 (Unhealthy) | 59 (Unhealthy) | 25 (Moderate) | 30 (Moderate) | 40 (Unhealthy for Sensitive Groups) | 48 (Unhealthy for Sensitive Groups) | 109 (Very Unhealthy) | 94 (Very Unhealthy) | 51 (Unhealthy for Sensitive Groups) | 83 (Very Unhealthy) | 53 (Unhealthy for Sensitive Groups) | 29 (Moderate) | 31 (Moderate) | 71 (Unhealthy) | 95 (Very Unhealthy) | 110 (Very bad Hazardous) |
| pm10 | 53 (Unhealthy for Sensitive Groups) | 67 (Unhealthy for Sensitive Groups) | 80 (Unhealthy) | 91 (Unhealthy) | 97 (Unhealthy) | 133 (Very Unhealthy) | 224 (Very bad Hazardous) | 103 (Unhealthy) | 50 (Unhealthy for Sensitive Groups) | 61 (Unhealthy for Sensitive Groups) | 80 (Unhealthy) | 87 (Unhealthy) | 172 (Very bad Hazardous) | 120 (Very Unhealthy) | 101 (Unhealthy) | 183 (Very bad Hazardous) | 136 (Very Unhealthy) | 70 (Unhealthy for Sensitive Groups) | 67 (Unhealthy for Sensitive Groups) | 195 (Very bad Hazardous) | 146 (Very Unhealthy) | 135 (Very Unhealthy) |
| no2 | 18 (Good) | 12 (Good) | 25 (Good) | 34 (Good) | 23 (Good) | 50 (Moderate) | 23 (Good) | 24 (Good) | 16 (Good) | 24 (Good) | 22 (Good) | 12 (Good) | 27 (Good) | 26 (Good) | 55 (Moderate) | 22 (Good) | 34 (Good) | 19 (Good) | 21 (Good) | 9.6 (Good) | 13 (Good) | 21 (Good) |
| so2 | 8.7 (Good) | 9.2 (Good) | 9.7 (Good) | 9.2 (Good) | 8.4 (Good) | 8.9 (Good) | 8.8 (Good) | 8.7 (Good) | 12 (Good) | 9.6 (Good) | 9.9 (Good) | 8.3 (Good) | 11 (Good) | 9 (Good) | 9.3 (Good) | 12 (Good) | 11 (Good) | 9.9 (Good) | 9.2 (Good) | 9.7 (Good) | 17 (Good) | 25 (Good) |
| co | 468 (Good) | 528 (Good) | 496 (Good) | 618 (Good) | 630 (Good) | 698 (Good) | 779 (Good) | 701 (Good) | 736 (Good) | 869 (Good) | 883 (Good) | 648 (Good) | 375 (Good) | 610 (Good) | 694 (Good) | 962 (Good) | 866 (Good) | 833 (Good) | 722 (Good) | 605 (Good) | 22 (Good) | 46 (Good) |
| o3 | 46 (Good) | 45 (Good) | 38 (Good) | 33 (Good) | 29 (Good) | 38 (Good) | 51 (Good) | 32 (Good) | 29 (Good) | 25 (Good) | 32 (Good) | 141 (Unhealthy for Sensitive Groups) | 24 (Good) | 21 (Good) | 27 (Good) | 26 (Good) | 23 (Good) | 20 (Good) | 17 (Good) | - (Good) | - (Good) | - (Good) |
Green and Parks in the City
Kota 66%
Nepal: 32% Bangladesh: 33% Bhutan: 82% Sri Lanka: 59% Pakistan: 49%particulate matter PM2.5
Kota 84 (Very Unhealthy)
Pleasure of spending time in the city
Kota 44%
Nepal: 32% Bangladesh: 26% Bhutan: 61% Sri Lanka: 52% Pakistan: 43%particulate matter PM10
Kota 160 (Very bad Hazardous)
Air Pollution
Kota 68%
Nepal: 76% Bangladesh: 78% Bhutan: 45% Sri Lanka: 53% Pakistan: 64%Garbage Disposal
Kota 31%
Nepal: 25% Bangladesh: 22% Bhutan: 47% Sri Lanka: 41% Pakistan: 34%Availability and quality of drinking water
Kota 52%
Nepal: 36% Bangladesh: 44% Bhutan: 64% Sri Lanka: 65% Pakistan: 44%Cleanliness and tidiness
Kota 44%
Nepal: 27% Bangladesh: 23% Bhutan: 57% Sri Lanka: 52% Pakistan: 40%Noise and Light pollution
Kota 51%
Nepal: 55% Bangladesh: 63% Bhutan: 55% Sri Lanka: 50% Pakistan: 59%Water Pollution
Kota 54%
Nepal: 76% Bangladesh: 74% Bhutan: 56% Sri Lanka: 57% Pakistan: 70%PM10 159 (Very bad Hazardous)
particulate matter (PM10) suspended dustSO2 11 (Good)
sulfur dioxide (SO2)PM2,5 90 (Very Unhealthy)
particulate matter (PM2.5) dustCO 1020 (Good)
carbon monoxide (CO)NO2 9.5 (Good)
nitrogen dioxide (NO2)O3 15 (Good)
ozone (O3)Shrinath Puram, Kota - RSPCB
| index | 2022-10-31 |
|---|---|
| pm10 | 144 |
| so2 | 11 |
| pm25 | 77 |
| co | 920 |
| no2 | 9.7 |
| o3 | 15 |
Shrinath Puram, Kota - RSPCB

| index | 2020-05 | 2020-04 | 2020-03 | 2020-02 | 2020-01 | 2019-12 | 2019-11 | 2019-10 | 2019-09 | 2019-08 | 2019-07 | 2019-06 | 2019-05 | 2019-04 | 2019-02 | 2018-11 | 2018-10 | 2018-09 | 2018-08 | 2018-05 | 2018-04 | 2018-03 |
|---|---|---|---|---|---|---|---|---|---|---|---|---|---|---|---|---|---|---|---|---|---|---|
| pm25 | 25 | 29 | 37 | 44 | 45 | 65 | 66 | 59 | 25 | 30 | 40 | 48 | 109 | 94 | 51 | 83 | 53 | 29 | 31 | 71 | 95 | 110 |
| pm10 | 53 | 67 | 80 | 91 | 97 | 133 | 224 | 103 | 50 | 61 | 80 | 87 | 172 | 120 | 101 | 183 | 136 | 70 | 67 | 195 | 146 | 135 |
| no2 | 18 | 12 | 25 | 34 | 23 | 50 | 23 | 24 | 16 | 24 | 22 | 12 | 27 | 26 | 55 | 22 | 34 | 19 | 21 | 9.6 | 13 | 21 |
| so2 | 8.7 | 9.2 | 9.7 | 9.2 | 8.4 | 8.9 | 8.8 | 8.7 | 12 | 9.6 | 9.9 | 8.3 | 11 | 9 | 9.3 | 12 | 11 | 9.9 | 9.2 | 9.7 | 17 | 25 |
| co | 468 | 528 | 496 | 618 | 630 | 698 | 779 | 701 | 736 | 869 | 883 | 648 | 375 | 610 | 694 | 962 | 866 | 833 | 722 | 605 | 22 | 46 |
| o3 | 46 | 45 | 38 | 33 | 29 | 38 | 51 | 32 | 29 | 25 | 32 | 141 | 24 | 21 | 27 | 26 | 23 | 20 | 17 | - | - | - |