Air Pollution in Ludhiana: Real-time Air Quality Index and smog alert.
Pollution and air quality forecast for Ludhiana. Today is Saturday, June 27, 2026. The following air pollution values have been recorded for Ludhiana:- particulate matter (PM2.5) dust - 77 (Very Unhealthy)
- particulate matter (PM10) suspended dust - 171 (Very bad Hazardous)
- nitrogen dioxide (NO2) - 22 (Good)
- sulfur dioxide (SO2) - 7 (Good)
- carbon monoxide (CO) - 840 (Good)
- ozone (O3) - 15 (Good)

What is the air quality in Ludhiana today? Is the air polluted in Ludhiana?. Is there smog?
What is the current level of PM2.5 in Ludhiana? (particulate matter (PM2.5) dust)
Today's PM2.5 level is:
77 (Very Unhealthy)
For comparison, the highest level of PM2.5 in Ludhiana in the last 7 days was: 77 (Monday, October 31, 2022) and the lowest: 77 (Monday, October 31, 2022).
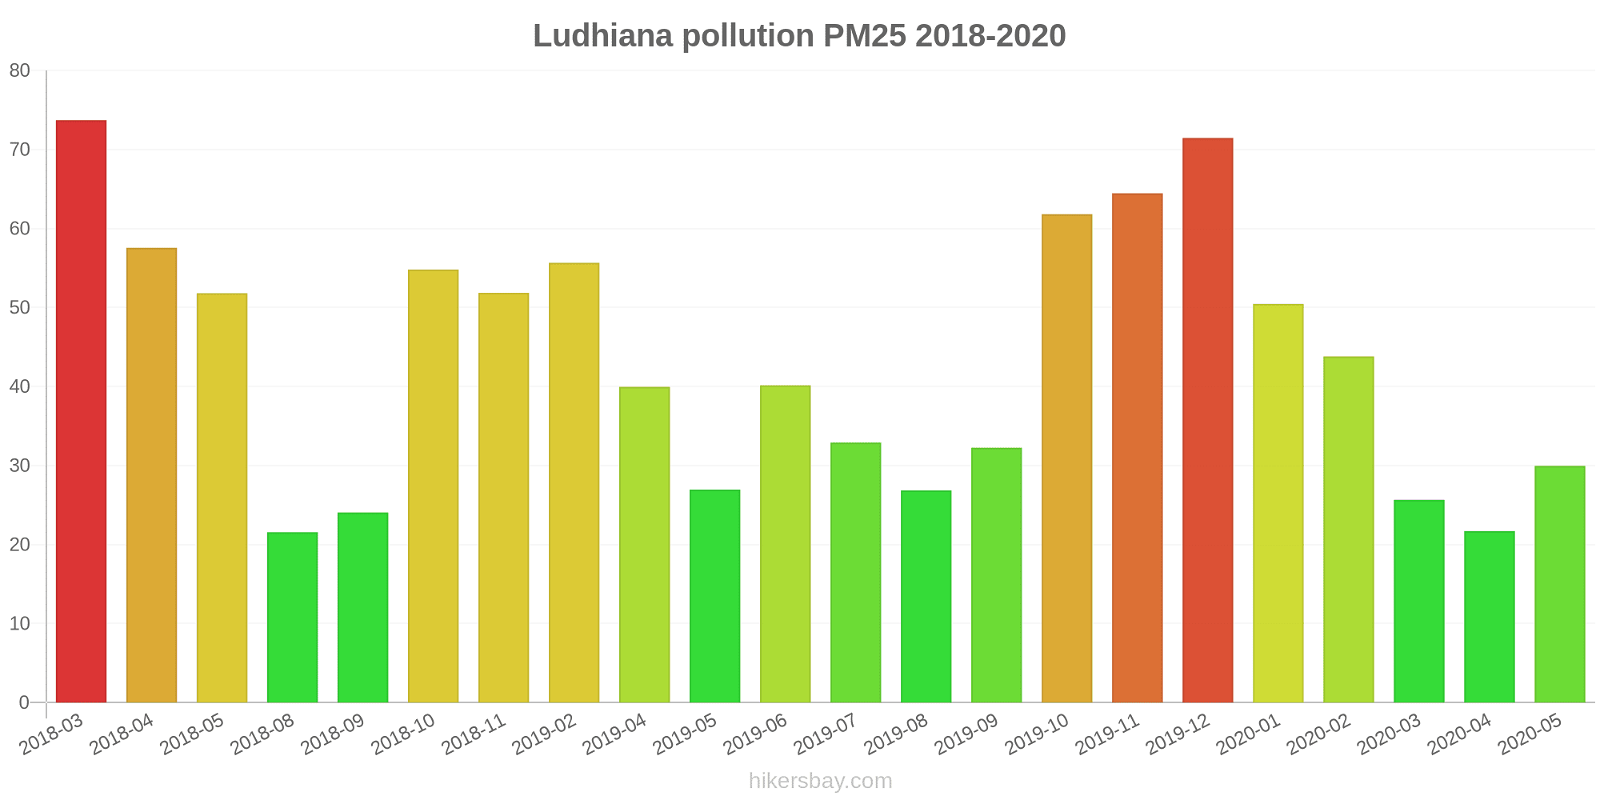
The highest PM2.5 values were recorded: 74 (March 2018).
The lowest level of particulate matter PM2.5 pollution occurs in month: August (22).
What is the level of PM10 today in Ludhiana? (particulate matter (PM10) suspended dust)
The current level of particulate matter PM10 in Ludhiana is:
171 (Very bad Hazardous)
The highest PM10 values usually occur in month: 158 (April 2018).
The lowest value of particulate matter PM10 pollution in Ludhiana is usually recorded in: April (47).
How high is the level of NO2? (nitrogen dioxide (NO2))
22 (Good)
What is the level of SO2 pollution? (sulfur dioxide (SO2))
7 (Good)
How high is the CO level? (carbon monoxide (CO))
840 (Good)
How is the O3 level today in Ludhiana? (ozone (O3))
15 (Good)
Current data Monday, October 31, 2022, 2:00 AM
PM2,5 77 (Very Unhealthy)
PM10 171 (Very bad Hazardous)
NO2 22 (Good)
SO2 7 (Good)
CO 840 (Good)
O3 15 (Good)
Data on air pollution from recent days in Ludhiana
index
2022-10-31
pm25
77
Very Unhealthy
pm10
173
Very bad Hazardous
no2
22
Good
so2
7
Good
co
838
Good
o3
14
Good
data source »
Air pollution in Ludhiana from March 2018 to May 2020
index
2020-05
2020-04
2020-03
2020-02
2020-01
2019-12
2019-11
2019-10
2019-09
2019-08
2019-07
2019-06
2019-05
2019-04
2019-02
2018-11
2018-10
2018-09
2018-08
2018-05
2018-04
2018-03
pm25
30 (Moderate)
22 (Moderate)
26 (Moderate)
44 (Unhealthy for Sensitive Groups)
50 (Unhealthy for Sensitive Groups)
71 (Unhealthy)
64 (Unhealthy)
62 (Unhealthy)
32 (Moderate)
27 (Moderate)
33 (Moderate)
40 (Unhealthy for Sensitive Groups)
27 (Moderate)
40 (Unhealthy for Sensitive Groups)
56 (Unhealthy)
52 (Unhealthy for Sensitive Groups)
55 (Unhealthy for Sensitive Groups)
24 (Moderate)
22 (Moderate)
52 (Unhealthy for Sensitive Groups)
58 (Unhealthy)
74 (Unhealthy)
pm10
74 (Unhealthy for Sensitive Groups)
47 (Moderate)
56 (Unhealthy for Sensitive Groups)
91 (Unhealthy)
95 (Unhealthy)
141 (Very Unhealthy)
147 (Very Unhealthy)
124 (Very Unhealthy)
72 (Unhealthy for Sensitive Groups)
72 (Unhealthy for Sensitive Groups)
72 (Unhealthy for Sensitive Groups)
95 (Unhealthy)
58 (Unhealthy for Sensitive Groups)
108 (Unhealthy)
100 (Unhealthy)
115 (Very Unhealthy)
104 (Unhealthy)
49 (Moderate)
51 (Unhealthy for Sensitive Groups)
120 (Very Unhealthy)
158 (Very bad Hazardous)
83 (Unhealthy)
no2
53 (Moderate)
15 (Good)
29 (Good)
21 (Good)
17 (Good)
23 (Good)
32 (Good)
38 (Good)
16 (Good)
19 (Good)
21 (Good)
45 (Moderate)
28 (Good)
7.3 (Good)
18 (Good)
29 (Good)
30 (Good)
14 (Good)
10 (Good)
14 (Good)
18 (Good)
27 (Good)
so2
6.7 (Good)
6.3 (Good)
12 (Good)
11 (Good)
8.7 (Good)
9.5 (Good)
13 (Good)
10 (Good)
6.6 (Good)
4.9 (Good)
5.1 (Good)
6.1 (Good)
12 (Good)
19 (Good)
8.3 (Good)
17 (Good)
11 (Good)
8 (Good)
10 (Good)
15 (Good)
24 (Good)
13 (Good)
o3
28 (Good)
26 (Good)
18 (Good)
20 (Good)
14 (Good)
11 (Good)
9.9 (Good)
22 (Good)
22 (Good)
14 (Good)
19 (Good)
21 (Good)
28 (Good)
28 (Good)
13 (Good)
14 (Good)
21 (Good)
25 (Good)
21 (Good)
32 (Good)
23 (Good)
5.3 (Good)
co
257 (Good)
227 (Good)
193 (Good)
554 (Good)
171 (Good)
315 (Good)
3.3 (Good)
6.9 (Good)
4.1 (Good)
0.88 (Good)
0.86 (Good)
0.69 (Good)
- (Good)
0.19 (Good)
0.35 (Good)
272 (Good)
406 (Good)
368 (Good)
348 (Good)
315 (Good)
7.4 (Good)
24 (Good)
data source »
Quality of life in Ludhiana
Green and Parks in the City
Ludhiana
36%
Nepal: 32%
Bangladesh: 33%
Bhutan: 82%
Sri Lanka: 59%
Pakistan: 49%
particulate matter PM2.5
Ludhiana
110 (Very Unhealthy)
Pleasure of spending time in the city
Ludhiana
25%
Nepal: 32%
Bangladesh: 26%
Bhutan: 61%
Sri Lanka: 52%
Pakistan: 43%
particulate matter PM10
Ludhiana
200 (Very bad Hazardous)
Air Pollution
Ludhiana
83%
Nepal: 76%
Bangladesh: 78%
Bhutan: 45%
Sri Lanka: 53%
Pakistan: 64%
Garbage Disposal
Ludhiana
22%
Nepal: 25%
Bangladesh: 22%
Bhutan: 47%
Sri Lanka: 41%
Pakistan: 34%
Availability and quality of drinking water
Ludhiana
42%
Nepal: 36%
Bangladesh: 44%
Bhutan: 64%
Sri Lanka: 65%
Pakistan: 44%
Cleanliness and tidiness
Ludhiana
25%
Nepal: 27%
Bangladesh: 23%
Bhutan: 57%
Sri Lanka: 52%
Pakistan: 40%
Noise and Light pollution
Ludhiana
57%
Nepal: 55%
Bangladesh: 63%
Bhutan: 55%
Sri Lanka: 50%
Pakistan: 59%
Water Pollution
Ludhiana
69%
Nepal: 76%
Bangladesh: 74%
Bhutan: 56%
Sri Lanka: 57%
Pakistan: 70%
Source: Numbeo
Kalal Majra, Khanna - PPCB
Monday, October 31, 2022, 1:00 AM
PM2,5 55 (Unhealthy for Sensitive Groups)
particulate matter (PM2.5) dust
PM10 155 (Very bad Hazardous)
particulate matter (PM10) suspended dust
NO2 23 (Good)
nitrogen dioxide (NO2)
SO2 8 (Good)
sulfur dioxide (SO2)
CO 0.75 (Good)
carbon monoxide (CO)
O3 21 (Good)
ozone (O3)
Punjab Agricultural University, Ludhiana - PPCB
Monday, October 31, 2022, 2:00 AM
SO2 6 (Good)
sulfur dioxide (SO2)
PM2,5 99 (Very Unhealthy)
particulate matter (PM2.5) dust
NO2 21 (Good)
nitrogen dioxide (NO2)
PM10 188 (Very bad Hazardous)
particulate matter (PM10) suspended dust
CO 1680 (Good)
carbon monoxide (CO)
O3 8.7 (Good)
ozone (O3)
Kalal Majra, Khanna - PPCB
index
2022-10-31
pm25
55
pm10
155
no2
23
so2
8
co
0.75
o3
21
Punjab Agricultural University, Ludhiana - PPCB
index
2022-10-31
so2
5.7
pm25
100
no2
20
pm10
190
co
1675
o3
7.3
Kalal Majra, Khanna - PPCB
2018-04 2020-05
index
2020-05
2020-04
2020-03
2020-02
2020-01
2019-12
2019-11
2019-10
2019-09
2019-08
2019-07
2019-06
2019-05
2019-04
2019-02
2018-11
2018-10
2018-09
2018-08
2018-05
2018-04
pm25
30
23
23
39
58
69
62
54
29
23
29
36
19
33
50
53
51
24
23
42
48
pm10
82
50
51
81
103
156
152
126
53
45
60
100
54
126
106
118
117
50
54
111
161
co
-
-
1.2
-
0.42
0.76
0.74
0.51
0.87
0.88
0.86
0.69
-
0.19
0.35
0.59
0.61
0.41
0.46
0.79
0.78
o3
22
18
17
16
11
8.2
6.9
21
24
13
21
26
16
16
7.5
14
29
26
22
32
43
no2
6.6
6.4
12
13
8.2
26
32
39
8.9
18
28
26
6.5
7.3
8.9
47
46
11
7.6
7.6
15
so2
7.4
7.1
15
13
11
12
21
11
6.5
4.9
4.6
6.2
13
17
9.3
22
13
7.2
4.5
17
37
Punjab Agricultural University, Ludhiana - PPCB
2018-03 2020-05

index
2020-05
2020-04
2020-03
2020-02
2020-01
2019-12
2019-11
2019-10
2019-09
2019-08
2019-07
2019-06
2019-05
2019-04
2019-02
2018-11
2018-10
2018-09
2018-08
2018-05
2018-04
2018-03
co
257
227
384
554
341
630
5.8
13
7.4
-
-
-
-
-
-
543
811
736
696
630
14
24
o3
34
33
19
25
17
15
13
23
21
15
18
16
40
39
19
15
13
23
19
-
4
5.3
pm25
30
20
28
48
43
74
67
69
35
31
37
44
35
47
61
50
59
24
20
62
67
74
no2
100
24
47
30
25
21
33
37
22
20
13
64
49
-
26
11
14
18
13
20
20
27
so2
6
5.5
9.3
9.4
6.7
7
4.8
9
6.7
4.9
5.6
6
11
22
7.4
11
10
8.8
16
13
10
13
pm10
66
44
61
100
87
126
141
122
90
99
84
91
61
90
94
112
91
48
48
129
155
83
* Pollution data source:
https://openaq.org
(caaqm)
The data is licensed under CC-By 4.0
PM2,5 77 (Very Unhealthy)
PM10 171 (Very bad Hazardous)
NO2 22 (Good)
SO2 7 (Good)
CO 840 (Good)
O3 15 (Good)
Data on air pollution from recent days in Ludhiana
| index | 2022-10-31 |
|---|---|
| pm25 | 77 Very Unhealthy |
| pm10 | 173 Very bad Hazardous |
| no2 | 22 Good |
| so2 | 7 Good |
| co | 838 Good |
| o3 | 14 Good |

| index | 2020-05 | 2020-04 | 2020-03 | 2020-02 | 2020-01 | 2019-12 | 2019-11 | 2019-10 | 2019-09 | 2019-08 | 2019-07 | 2019-06 | 2019-05 | 2019-04 | 2019-02 | 2018-11 | 2018-10 | 2018-09 | 2018-08 | 2018-05 | 2018-04 | 2018-03 |
|---|---|---|---|---|---|---|---|---|---|---|---|---|---|---|---|---|---|---|---|---|---|---|
| pm25 | 30 (Moderate) | 22 (Moderate) | 26 (Moderate) | 44 (Unhealthy for Sensitive Groups) | 50 (Unhealthy for Sensitive Groups) | 71 (Unhealthy) | 64 (Unhealthy) | 62 (Unhealthy) | 32 (Moderate) | 27 (Moderate) | 33 (Moderate) | 40 (Unhealthy for Sensitive Groups) | 27 (Moderate) | 40 (Unhealthy for Sensitive Groups) | 56 (Unhealthy) | 52 (Unhealthy for Sensitive Groups) | 55 (Unhealthy for Sensitive Groups) | 24 (Moderate) | 22 (Moderate) | 52 (Unhealthy for Sensitive Groups) | 58 (Unhealthy) | 74 (Unhealthy) |
| pm10 | 74 (Unhealthy for Sensitive Groups) | 47 (Moderate) | 56 (Unhealthy for Sensitive Groups) | 91 (Unhealthy) | 95 (Unhealthy) | 141 (Very Unhealthy) | 147 (Very Unhealthy) | 124 (Very Unhealthy) | 72 (Unhealthy for Sensitive Groups) | 72 (Unhealthy for Sensitive Groups) | 72 (Unhealthy for Sensitive Groups) | 95 (Unhealthy) | 58 (Unhealthy for Sensitive Groups) | 108 (Unhealthy) | 100 (Unhealthy) | 115 (Very Unhealthy) | 104 (Unhealthy) | 49 (Moderate) | 51 (Unhealthy for Sensitive Groups) | 120 (Very Unhealthy) | 158 (Very bad Hazardous) | 83 (Unhealthy) |
| no2 | 53 (Moderate) | 15 (Good) | 29 (Good) | 21 (Good) | 17 (Good) | 23 (Good) | 32 (Good) | 38 (Good) | 16 (Good) | 19 (Good) | 21 (Good) | 45 (Moderate) | 28 (Good) | 7.3 (Good) | 18 (Good) | 29 (Good) | 30 (Good) | 14 (Good) | 10 (Good) | 14 (Good) | 18 (Good) | 27 (Good) |
| so2 | 6.7 (Good) | 6.3 (Good) | 12 (Good) | 11 (Good) | 8.7 (Good) | 9.5 (Good) | 13 (Good) | 10 (Good) | 6.6 (Good) | 4.9 (Good) | 5.1 (Good) | 6.1 (Good) | 12 (Good) | 19 (Good) | 8.3 (Good) | 17 (Good) | 11 (Good) | 8 (Good) | 10 (Good) | 15 (Good) | 24 (Good) | 13 (Good) |
| o3 | 28 (Good) | 26 (Good) | 18 (Good) | 20 (Good) | 14 (Good) | 11 (Good) | 9.9 (Good) | 22 (Good) | 22 (Good) | 14 (Good) | 19 (Good) | 21 (Good) | 28 (Good) | 28 (Good) | 13 (Good) | 14 (Good) | 21 (Good) | 25 (Good) | 21 (Good) | 32 (Good) | 23 (Good) | 5.3 (Good) |
| co | 257 (Good) | 227 (Good) | 193 (Good) | 554 (Good) | 171 (Good) | 315 (Good) | 3.3 (Good) | 6.9 (Good) | 4.1 (Good) | 0.88 (Good) | 0.86 (Good) | 0.69 (Good) | - (Good) | 0.19 (Good) | 0.35 (Good) | 272 (Good) | 406 (Good) | 368 (Good) | 348 (Good) | 315 (Good) | 7.4 (Good) | 24 (Good) |
Green and Parks in the City
Ludhiana 36%
Nepal: 32% Bangladesh: 33% Bhutan: 82% Sri Lanka: 59% Pakistan: 49%particulate matter PM2.5
Ludhiana 110 (Very Unhealthy)
Pleasure of spending time in the city
Ludhiana 25%
Nepal: 32% Bangladesh: 26% Bhutan: 61% Sri Lanka: 52% Pakistan: 43%particulate matter PM10
Ludhiana 200 (Very bad Hazardous)
Air Pollution
Ludhiana 83%
Nepal: 76% Bangladesh: 78% Bhutan: 45% Sri Lanka: 53% Pakistan: 64%Garbage Disposal
Ludhiana 22%
Nepal: 25% Bangladesh: 22% Bhutan: 47% Sri Lanka: 41% Pakistan: 34%Availability and quality of drinking water
Ludhiana 42%
Nepal: 36% Bangladesh: 44% Bhutan: 64% Sri Lanka: 65% Pakistan: 44%Cleanliness and tidiness
Ludhiana 25%
Nepal: 27% Bangladesh: 23% Bhutan: 57% Sri Lanka: 52% Pakistan: 40%Noise and Light pollution
Ludhiana 57%
Nepal: 55% Bangladesh: 63% Bhutan: 55% Sri Lanka: 50% Pakistan: 59%Water Pollution
Ludhiana 69%
Nepal: 76% Bangladesh: 74% Bhutan: 56% Sri Lanka: 57% Pakistan: 70%PM2,5 55 (Unhealthy for Sensitive Groups)
particulate matter (PM2.5) dustPM10 155 (Very bad Hazardous)
particulate matter (PM10) suspended dustNO2 23 (Good)
nitrogen dioxide (NO2)SO2 8 (Good)
sulfur dioxide (SO2)CO 0.75 (Good)
carbon monoxide (CO)O3 21 (Good)
ozone (O3)SO2 6 (Good)
sulfur dioxide (SO2)PM2,5 99 (Very Unhealthy)
particulate matter (PM2.5) dustNO2 21 (Good)
nitrogen dioxide (NO2)PM10 188 (Very bad Hazardous)
particulate matter (PM10) suspended dustCO 1680 (Good)
carbon monoxide (CO)O3 8.7 (Good)
ozone (O3)Kalal Majra, Khanna - PPCB
| index | 2022-10-31 |
|---|---|
| pm25 | 55 |
| pm10 | 155 |
| no2 | 23 |
| so2 | 8 |
| co | 0.75 |
| o3 | 21 |
Punjab Agricultural University, Ludhiana - PPCB
| index | 2022-10-31 |
|---|---|
| so2 | 5.7 |
| pm25 | 100 |
| no2 | 20 |
| pm10 | 190 |
| co | 1675 |
| o3 | 7.3 |
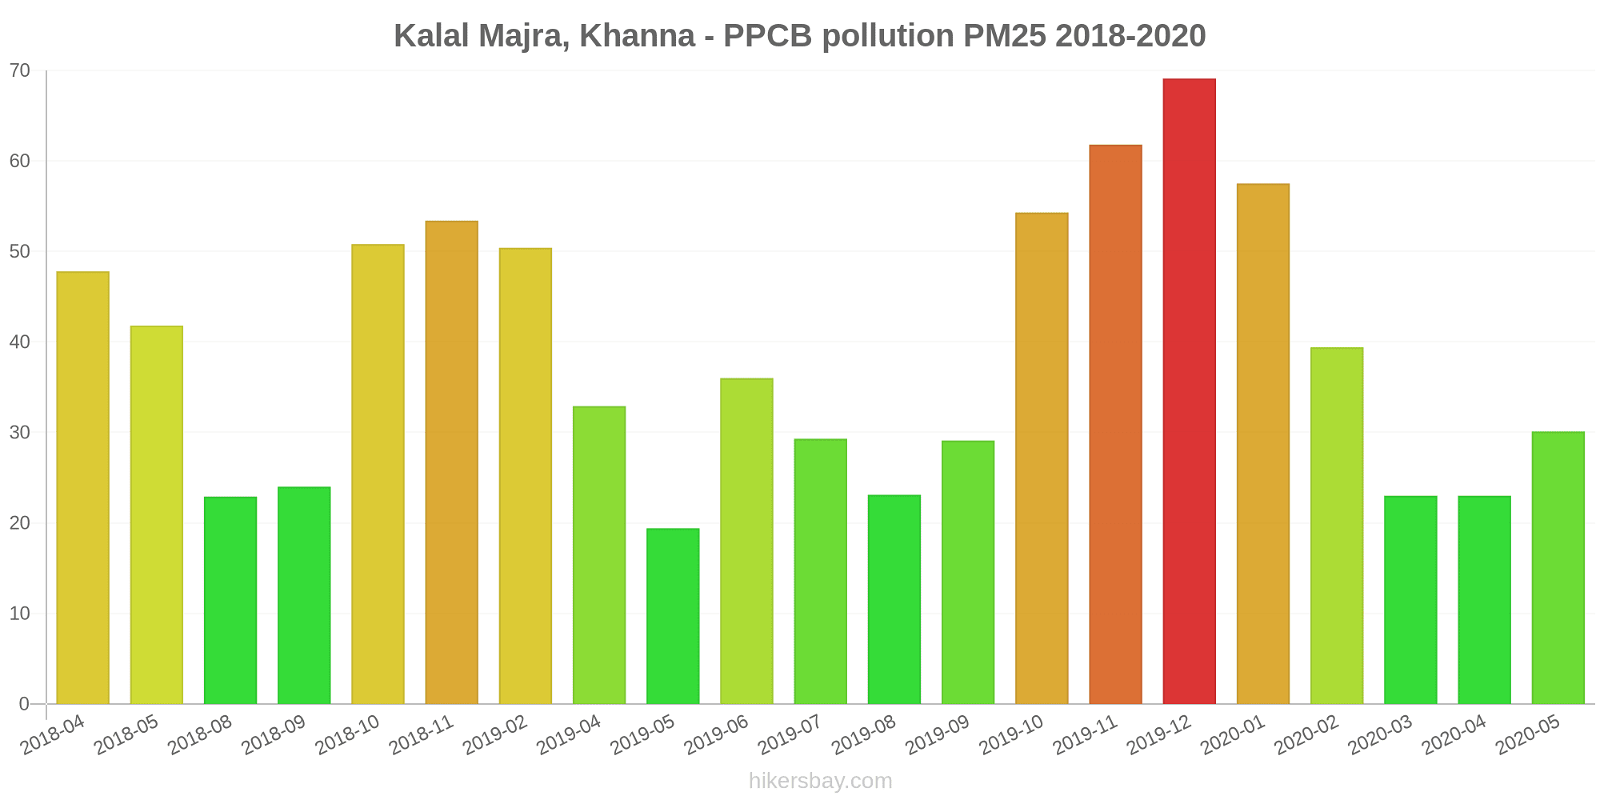
Kalal Majra, Khanna - PPCB

| index | 2020-05 | 2020-04 | 2020-03 | 2020-02 | 2020-01 | 2019-12 | 2019-11 | 2019-10 | 2019-09 | 2019-08 | 2019-07 | 2019-06 | 2019-05 | 2019-04 | 2019-02 | 2018-11 | 2018-10 | 2018-09 | 2018-08 | 2018-05 | 2018-04 |
|---|---|---|---|---|---|---|---|---|---|---|---|---|---|---|---|---|---|---|---|---|---|
| pm25 | 30 | 23 | 23 | 39 | 58 | 69 | 62 | 54 | 29 | 23 | 29 | 36 | 19 | 33 | 50 | 53 | 51 | 24 | 23 | 42 | 48 |
| pm10 | 82 | 50 | 51 | 81 | 103 | 156 | 152 | 126 | 53 | 45 | 60 | 100 | 54 | 126 | 106 | 118 | 117 | 50 | 54 | 111 | 161 |
| co | - | - | 1.2 | - | 0.42 | 0.76 | 0.74 | 0.51 | 0.87 | 0.88 | 0.86 | 0.69 | - | 0.19 | 0.35 | 0.59 | 0.61 | 0.41 | 0.46 | 0.79 | 0.78 |
| o3 | 22 | 18 | 17 | 16 | 11 | 8.2 | 6.9 | 21 | 24 | 13 | 21 | 26 | 16 | 16 | 7.5 | 14 | 29 | 26 | 22 | 32 | 43 |
| no2 | 6.6 | 6.4 | 12 | 13 | 8.2 | 26 | 32 | 39 | 8.9 | 18 | 28 | 26 | 6.5 | 7.3 | 8.9 | 47 | 46 | 11 | 7.6 | 7.6 | 15 |
| so2 | 7.4 | 7.1 | 15 | 13 | 11 | 12 | 21 | 11 | 6.5 | 4.9 | 4.6 | 6.2 | 13 | 17 | 9.3 | 22 | 13 | 7.2 | 4.5 | 17 | 37 |
Punjab Agricultural University, Ludhiana - PPCB
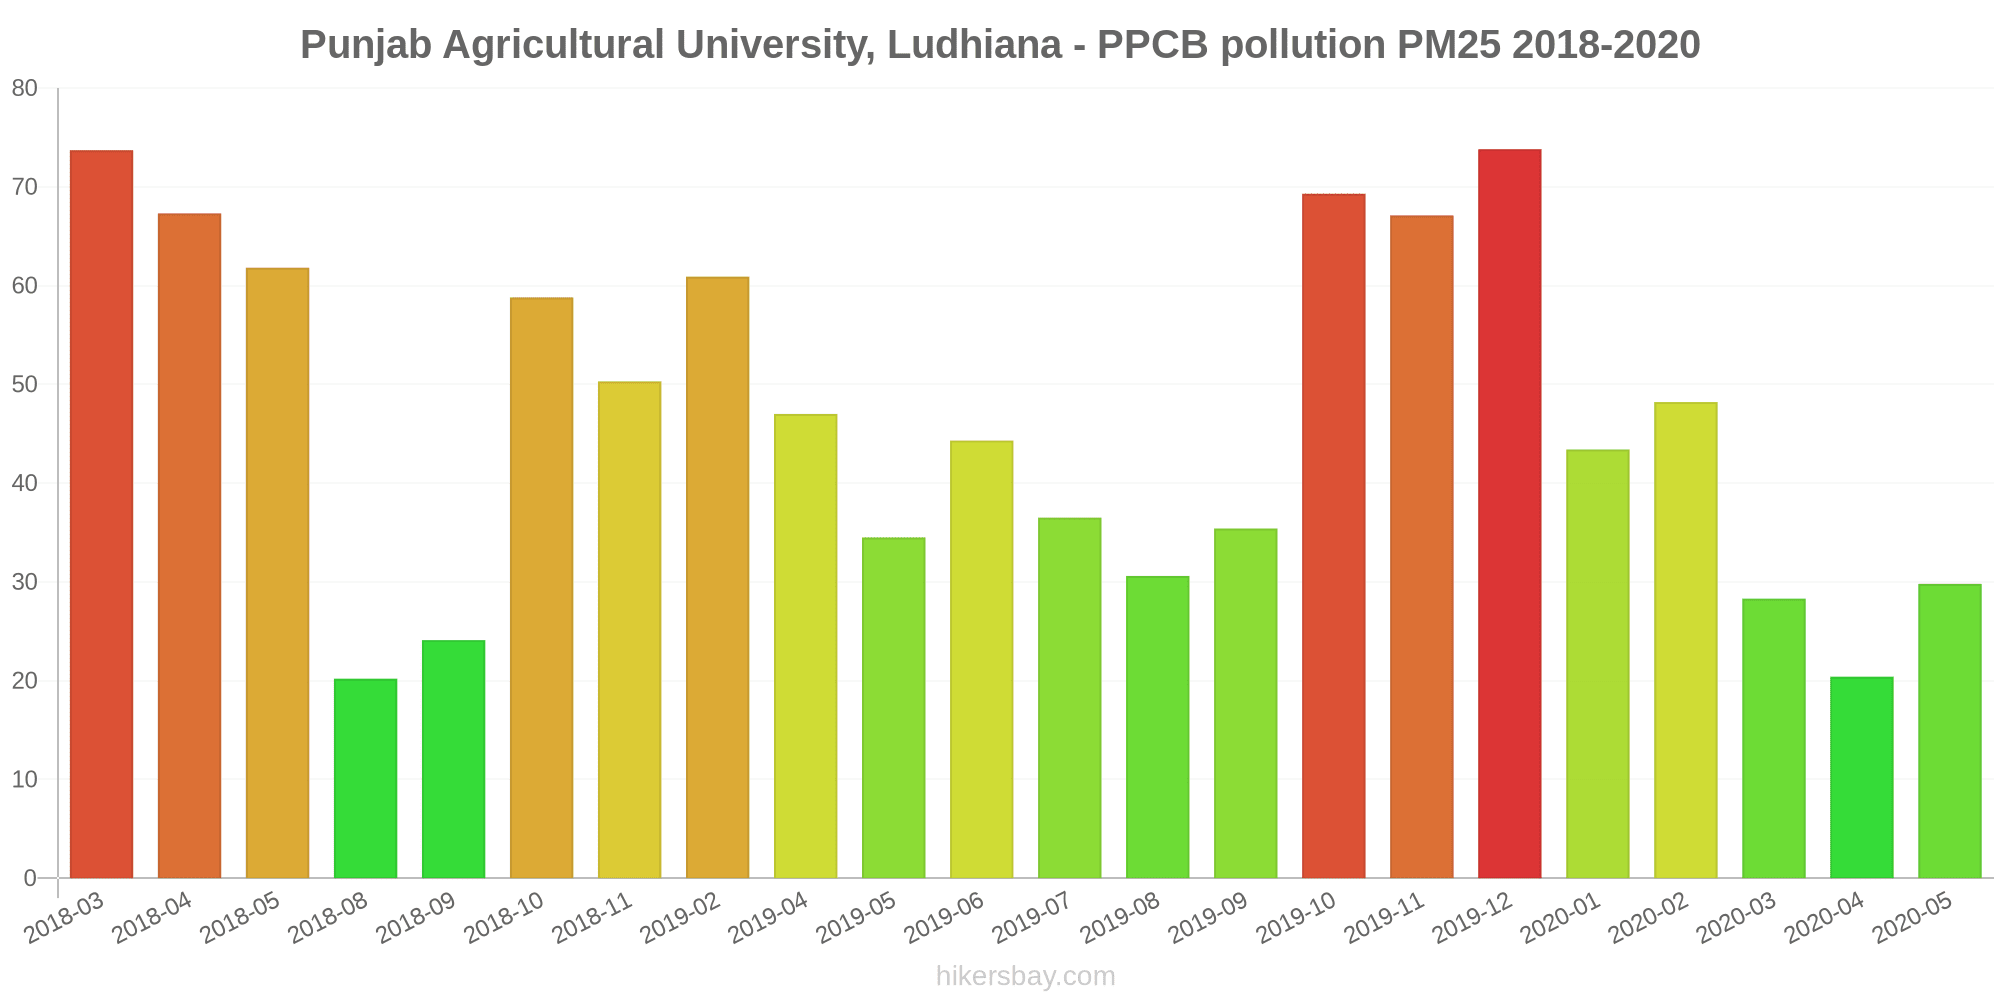
| index | 2020-05 | 2020-04 | 2020-03 | 2020-02 | 2020-01 | 2019-12 | 2019-11 | 2019-10 | 2019-09 | 2019-08 | 2019-07 | 2019-06 | 2019-05 | 2019-04 | 2019-02 | 2018-11 | 2018-10 | 2018-09 | 2018-08 | 2018-05 | 2018-04 | 2018-03 |
|---|---|---|---|---|---|---|---|---|---|---|---|---|---|---|---|---|---|---|---|---|---|---|
| co | 257 | 227 | 384 | 554 | 341 | 630 | 5.8 | 13 | 7.4 | - | - | - | - | - | - | 543 | 811 | 736 | 696 | 630 | 14 | 24 |
| o3 | 34 | 33 | 19 | 25 | 17 | 15 | 13 | 23 | 21 | 15 | 18 | 16 | 40 | 39 | 19 | 15 | 13 | 23 | 19 | - | 4 | 5.3 |
| pm25 | 30 | 20 | 28 | 48 | 43 | 74 | 67 | 69 | 35 | 31 | 37 | 44 | 35 | 47 | 61 | 50 | 59 | 24 | 20 | 62 | 67 | 74 |
| no2 | 100 | 24 | 47 | 30 | 25 | 21 | 33 | 37 | 22 | 20 | 13 | 64 | 49 | - | 26 | 11 | 14 | 18 | 13 | 20 | 20 | 27 |
| so2 | 6 | 5.5 | 9.3 | 9.4 | 6.7 | 7 | 4.8 | 9 | 6.7 | 4.9 | 5.6 | 6 | 11 | 22 | 7.4 | 11 | 10 | 8.8 | 16 | 13 | 10 | 13 |
| pm10 | 66 | 44 | 61 | 100 | 87 | 126 | 141 | 122 | 90 | 99 | 84 | 91 | 61 | 90 | 94 | 112 | 91 | 48 | 48 | 129 | 155 | 83 |