Air Pollution in Mahalakshmi: Real-time Air Quality Index and smog alert.
Pollution and air quality forecast for Mahalakshmi. Today is Wednesday, May 13, 2026. The following air pollution values have been recorded for Mahalakshmi:- particulate matter (PM2.5) dust - 66 (Unhealthy)
- particulate matter (PM10) suspended dust - 121 (Very Unhealthy)
- nitrogen dioxide (NO2) - 0 (Good)
- sulfur dioxide (SO2) - 13 (Good)
- carbon monoxide (CO) - 1400 (Good)
- ozone (O3) - 4 (Good)

What is the air quality in Mahalakshmi today? Is the air polluted in Mahalakshmi?. Is there smog?
What is the current level of PM2.5 in Mahalakshmi? (particulate matter (PM2.5) dust)
Today's PM2.5 level is:
66 (Unhealthy)
For comparison, the highest level of PM2.5 in Mahalakshmi in the last 7 days was: 66 (Monday, October 31, 2022) and the lowest: 66 (Monday, October 31, 2022).
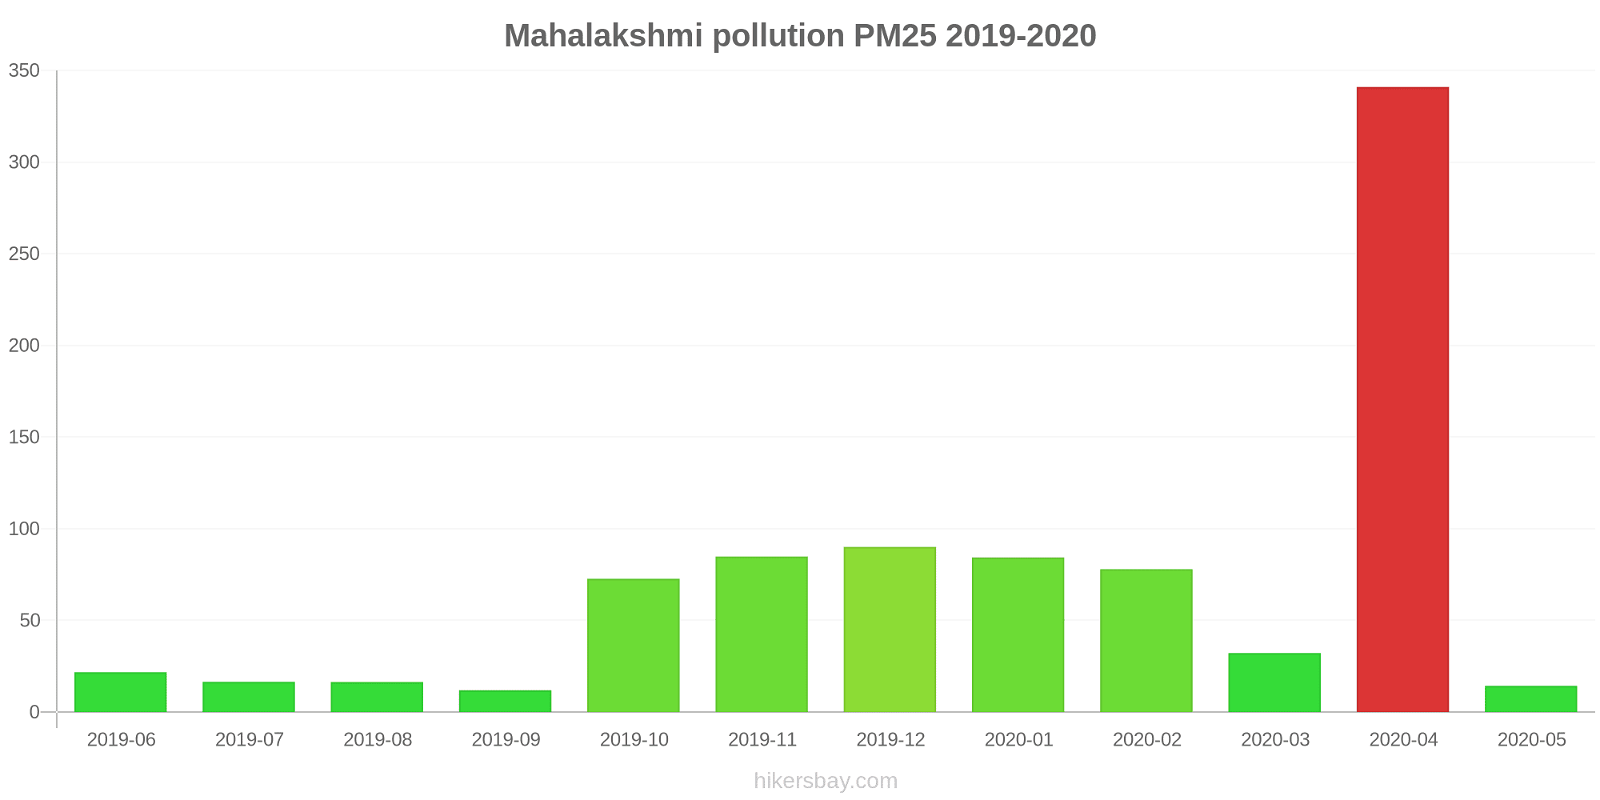
The highest PM2.5 values were recorded: 341 (April 2020).
The lowest level of particulate matter PM2.5 pollution occurs in month: September (12).
What is the level of PM10 today in Mahalakshmi? (particulate matter (PM10) suspended dust)
The current level of particulate matter PM10 in Mahalakshmi is:
121 (Very Unhealthy)
The highest PM10 values usually occur in month: 338 (April 2020).
The lowest value of particulate matter PM10 pollution in Mahalakshmi is usually recorded in: September (41).
How high is the level of NO2? (nitrogen dioxide (NO2))
0 (Good)
What is the level of SO2 pollution? (sulfur dioxide (SO2))
13 (Good)
How high is the CO level? (carbon monoxide (CO))
1400 (Good)
How is the O3 level today in Mahalakshmi? (ozone (O3))
4 (Good)
Current data Monday, October 31, 2022, 2:00 AM
PM2,5 66 (Unhealthy)
PM10 121 (Very Unhealthy)
NO2 0 (Good)
SO2 13 (Good)
CO 1400 (Good)
O3 4 (Good)
Data on air pollution from recent days in Mahalakshmi
index
2022-10-31
pm25
66
Unhealthy
pm10
121
Very Unhealthy
no2
0
Good
so2
13
Good
co
1400
Good
o3
4
Good
data source »
Air pollution in Mahalakshmi from June 2019 to May 2020
index
2020-05
2020-04
2020-03
2020-02
2020-01
2019-12
2019-11
2019-10
2019-09
2019-08
2019-07
2019-06
pm25
14 (Moderate)
341 (Very bad Hazardous)
32 (Moderate)
78 (Very Unhealthy)
84 (Very Unhealthy)
90 (Very Unhealthy)
85 (Very Unhealthy)
73 (Unhealthy)
12 (Good)
16 (Moderate)
17 (Moderate)
22 (Moderate)
pm10
52 (Unhealthy for Sensitive Groups)
338 (Very bad Hazardous)
91 (Unhealthy)
146 (Very Unhealthy)
136 (Very Unhealthy)
138 (Very Unhealthy)
138 (Very Unhealthy)
85 (Unhealthy)
41 (Moderate)
61 (Unhealthy for Sensitive Groups)
63 (Unhealthy for Sensitive Groups)
80 (Unhealthy)
no2
5.3 (Good)
4.8 (Good)
22 (Good)
44 (Moderate)
40 (Moderate)
38 (Good)
36 (Good)
21 (Good)
10 (Good)
7.3 (Good)
9.8 (Good)
8.2 (Good)
so2
3.8 (Good)
3.9 (Good)
5.5 (Good)
12 (Good)
10 (Good)
6.5 (Good)
6.9 (Good)
12 (Good)
3.5 (Good)
2.5 (Good)
6.2 (Good)
1.7 (Good)
co
222 (Good)
273 (Good)
331 (Good)
741 (Good)
724 (Good)
717 (Good)
742 (Good)
455 (Good)
261 (Good)
240 (Good)
281 (Good)
348 (Good)
o3
27 (Good)
35 (Good)
50 (Good)
367 (Very bad Hazardous)
55 (Good)
62 (Good)
55 (Good)
23 (Good)
21 (Good)
13 (Good)
14 (Good)
13 (Good)
data source »
Worli, Mumbai - MPCB
Monday, October 31, 2022, 2:00 AM
PM2,5 66 (Unhealthy)
particulate matter (PM2.5) dust
PM10 121 (Very Unhealthy)
particulate matter (PM10) suspended dust
NO2 0.08 (Good)
nitrogen dioxide (NO2)
SO2 13 (Good)
sulfur dioxide (SO2)
CO 1400 (Good)
carbon monoxide (CO)
O3 4 (Good)
ozone (O3)
Worli, Mumbai - MPCB
index
2022-10-31
pm25
66
pm10
121
no2
0.08
so2
13
co
1400
o3
4
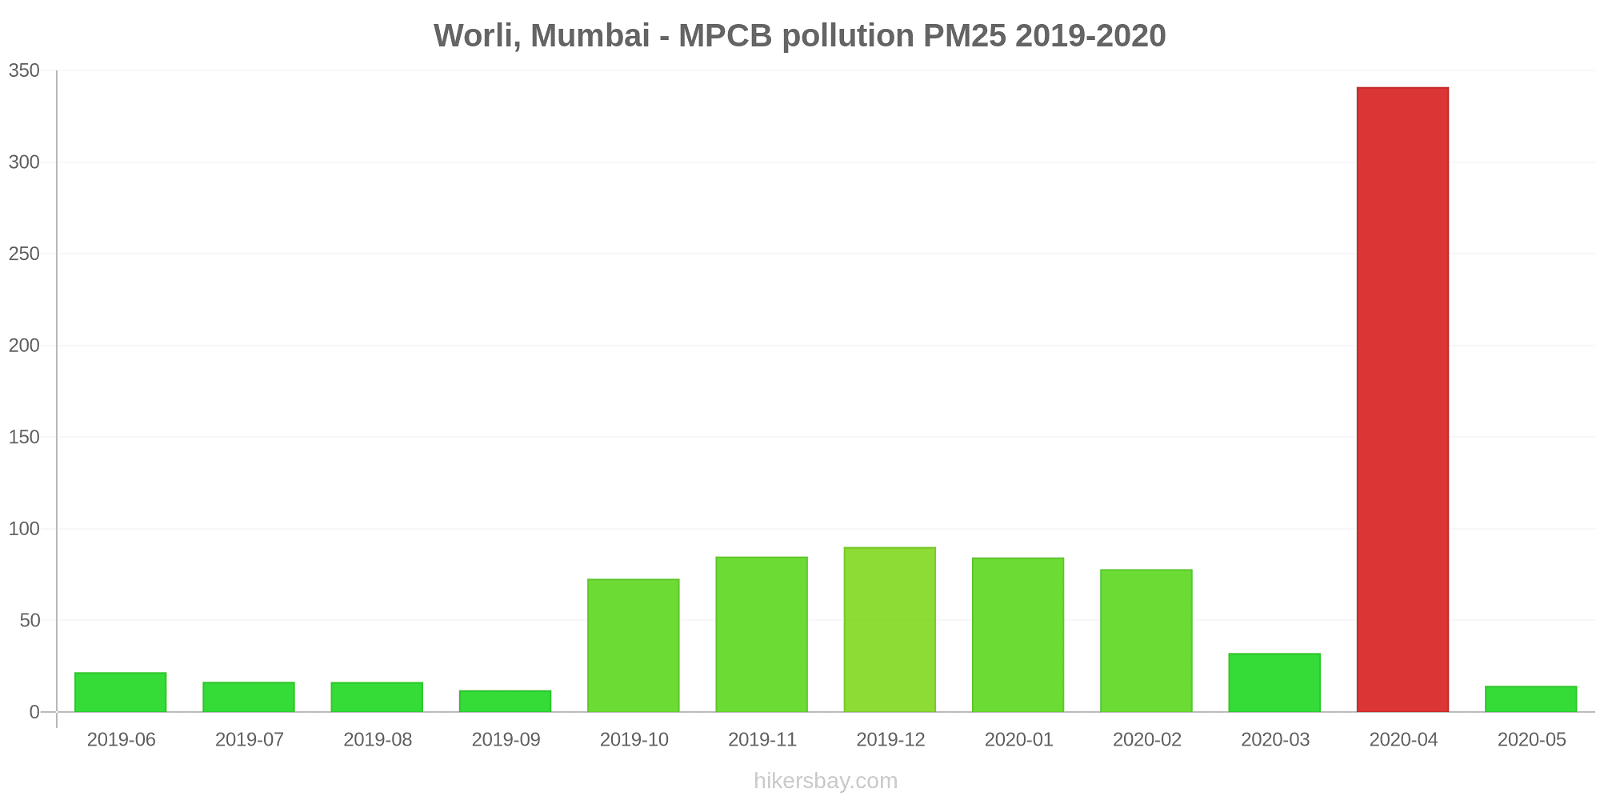
Worli, Mumbai - MPCB
2019-06 2020-05
index
2020-05
2020-04
2020-03
2020-02
2020-01
2019-12
2019-11
2019-10
2019-09
2019-08
2019-07
2019-06
pm25
14
341
32
78
84
90
85
73
12
16
17
22
pm10
52
338
91
146
136
138
138
85
41
61
63
80
no2
5.3
4.8
22
44
40
38
36
21
10
7.3
9.8
8.2
so2
3.8
3.9
5.5
12
10
6.5
6.9
12
3.5
2.5
6.2
1.7
co
222
273
331
741
724
717
742
455
261
240
281
348
o3
27
35
50
367
55
62
55
23
21
13
14
13
* Pollution data source:
https://openaq.org
(caaqm)
The data is licensed under CC-By 4.0
PM2,5 66 (Unhealthy)
PM10 121 (Very Unhealthy)
NO2 0 (Good)
SO2 13 (Good)
CO 1400 (Good)
O3 4 (Good)
Data on air pollution from recent days in Mahalakshmi
| index | 2022-10-31 |
|---|---|
| pm25 | 66 Unhealthy |
| pm10 | 121 Very Unhealthy |
| no2 | 0 Good |
| so2 | 13 Good |
| co | 1400 Good |
| o3 | 4 Good |

| index | 2020-05 | 2020-04 | 2020-03 | 2020-02 | 2020-01 | 2019-12 | 2019-11 | 2019-10 | 2019-09 | 2019-08 | 2019-07 | 2019-06 |
|---|---|---|---|---|---|---|---|---|---|---|---|---|
| pm25 | 14 (Moderate) | 341 (Very bad Hazardous) | 32 (Moderate) | 78 (Very Unhealthy) | 84 (Very Unhealthy) | 90 (Very Unhealthy) | 85 (Very Unhealthy) | 73 (Unhealthy) | 12 (Good) | 16 (Moderate) | 17 (Moderate) | 22 (Moderate) |
| pm10 | 52 (Unhealthy for Sensitive Groups) | 338 (Very bad Hazardous) | 91 (Unhealthy) | 146 (Very Unhealthy) | 136 (Very Unhealthy) | 138 (Very Unhealthy) | 138 (Very Unhealthy) | 85 (Unhealthy) | 41 (Moderate) | 61 (Unhealthy for Sensitive Groups) | 63 (Unhealthy for Sensitive Groups) | 80 (Unhealthy) |
| no2 | 5.3 (Good) | 4.8 (Good) | 22 (Good) | 44 (Moderate) | 40 (Moderate) | 38 (Good) | 36 (Good) | 21 (Good) | 10 (Good) | 7.3 (Good) | 9.8 (Good) | 8.2 (Good) |
| so2 | 3.8 (Good) | 3.9 (Good) | 5.5 (Good) | 12 (Good) | 10 (Good) | 6.5 (Good) | 6.9 (Good) | 12 (Good) | 3.5 (Good) | 2.5 (Good) | 6.2 (Good) | 1.7 (Good) |
| co | 222 (Good) | 273 (Good) | 331 (Good) | 741 (Good) | 724 (Good) | 717 (Good) | 742 (Good) | 455 (Good) | 261 (Good) | 240 (Good) | 281 (Good) | 348 (Good) |
| o3 | 27 (Good) | 35 (Good) | 50 (Good) | 367 (Very bad Hazardous) | 55 (Good) | 62 (Good) | 55 (Good) | 23 (Good) | 21 (Good) | 13 (Good) | 14 (Good) | 13 (Good) |
PM2,5 66 (Unhealthy)
particulate matter (PM2.5) dustPM10 121 (Very Unhealthy)
particulate matter (PM10) suspended dustNO2 0.08 (Good)
nitrogen dioxide (NO2)SO2 13 (Good)
sulfur dioxide (SO2)CO 1400 (Good)
carbon monoxide (CO)O3 4 (Good)
ozone (O3)Worli, Mumbai - MPCB
| index | 2022-10-31 |
|---|---|
| pm25 | 66 |
| pm10 | 121 |
| no2 | 0.08 |
| so2 | 13 |
| co | 1400 |
| o3 | 4 |
Worli, Mumbai - MPCB

| index | 2020-05 | 2020-04 | 2020-03 | 2020-02 | 2020-01 | 2019-12 | 2019-11 | 2019-10 | 2019-09 | 2019-08 | 2019-07 | 2019-06 |
|---|---|---|---|---|---|---|---|---|---|---|---|---|
| pm25 | 14 | 341 | 32 | 78 | 84 | 90 | 85 | 73 | 12 | 16 | 17 | 22 |
| pm10 | 52 | 338 | 91 | 146 | 136 | 138 | 138 | 85 | 41 | 61 | 63 | 80 |
| no2 | 5.3 | 4.8 | 22 | 44 | 40 | 38 | 36 | 21 | 10 | 7.3 | 9.8 | 8.2 |
| so2 | 3.8 | 3.9 | 5.5 | 12 | 10 | 6.5 | 6.9 | 12 | 3.5 | 2.5 | 6.2 | 1.7 |
| co | 222 | 273 | 331 | 741 | 724 | 717 | 742 | 455 | 261 | 240 | 281 | 348 |
| o3 | 27 | 35 | 50 | 367 | 55 | 62 | 55 | 23 | 21 | 13 | 14 | 13 |