Air Pollution in Mahendragarh: Real-time Air Quality Index and smog alert.
Pollution and air quality forecast for Mahendragarh. Today is Wednesday, May 13, 2026. The following air pollution values have been recorded for Mahendragarh:- particulate matter (PM10) suspended dust - 150 (Very bad Hazardous)
- sulfur dioxide (SO2) - 4 (Good)
- particulate matter (PM2.5) dust - 59 (Unhealthy)
- carbon monoxide (CO) - 0 (Good)
- nitrogen dioxide (NO2) - 19 (Good)
- ozone (O3) - 5 (Good)

What is the air quality in Mahendragarh today? Is the air polluted in Mahendragarh?. Is there smog?
What is the level of PM10 today in Mahendragarh? (particulate matter (PM10) suspended dust)
The current level of particulate matter PM10 in Mahendragarh is:
150 (Very bad Hazardous)
The highest PM10 values usually occur in month: 192 (April 2019).
The lowest value of particulate matter PM10 pollution in Mahendragarh is usually recorded in: August (38).
What is the level of SO2 pollution? (sulfur dioxide (SO2))
4 (Good)
What is the current level of PM2.5 in Mahendragarh? (particulate matter (PM2.5) dust)
Today's PM2.5 level is:
59 (Unhealthy)
For comparison, the highest level of PM2.5 in Mahendragarh in the last 7 days was: 60 (Monday, October 31, 2022) and the lowest: 60 (Monday, October 31, 2022).
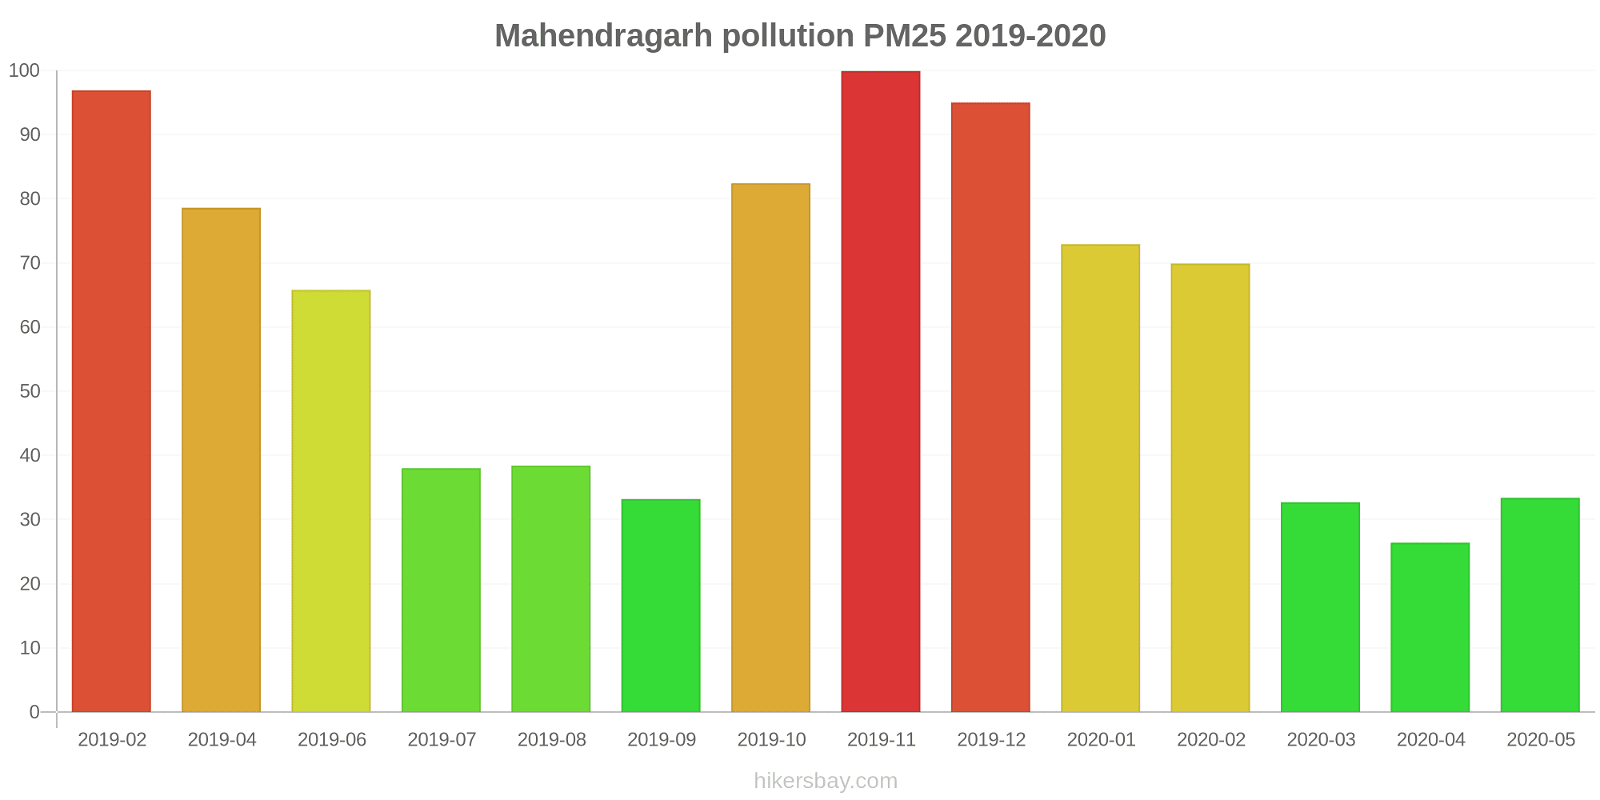
The highest PM2.5 values were recorded: 100 (November 2019).
The lowest level of particulate matter PM2.5 pollution occurs in month: April (26).
How high is the CO level? (carbon monoxide (CO))
0 (Good)
How high is the level of NO2? (nitrogen dioxide (NO2))
19 (Good)
How is the O3 level today in Mahendragarh? (ozone (O3))
5 (Good)
Current data Monday, October 31, 2022, 2:00 AM
PM10 150 (Very bad Hazardous)
SO2 4 (Good)
PM2,5 59 (Unhealthy)
CO 0 (Good)
NO2 19 (Good)
O3 5 (Good)
Data on air pollution from recent days in Mahendragarh
index
2022-10-31
pm10
145
Very Unhealthy
so2
4
Good
pm25
60
Unhealthy
co
0
Good
no2
16
Good
o3
5
Good
data source »
Air pollution in Mahendragarh from February 2019 to May 2020
index
2020-05
2020-04
2020-03
2020-02
2020-01
2019-12
2019-11
2019-10
2019-09
2019-08
2019-07
2019-06
2019-04
2019-02
pm25
33 (Moderate)
26 (Moderate)
33 (Moderate)
70 (Unhealthy)
73 (Unhealthy)
95 (Very Unhealthy)
100 (Very Unhealthy)
82 (Very Unhealthy)
33 (Moderate)
38 (Unhealthy for Sensitive Groups)
38 (Unhealthy for Sensitive Groups)
66 (Unhealthy)
79 (Very Unhealthy)
97 (Very Unhealthy)
pm10
96 (Unhealthy)
82 (Unhealthy)
77 (Unhealthy for Sensitive Groups)
116 (Very Unhealthy)
98 (Unhealthy)
138 (Very Unhealthy)
141 (Very Unhealthy)
151 (Very bad Hazardous)
46 (Moderate)
38 (Moderate)
74 (Unhealthy for Sensitive Groups)
138 (Very Unhealthy)
192 (Very bad Hazardous)
140 (Very Unhealthy)
so2
17 (Good)
5.3 (Good)
25 (Good)
6.3 (Good)
7.4 (Good)
6.4 (Good)
7.3 (Good)
4.2 (Good)
4.9 (Good)
6.5 (Good)
- (Good)
- (Good)
5.5 (Good)
5.5 (Good)
co
0.33 (Good)
0.31 (Good)
0.36 (Good)
0.62 (Good)
0.65 (Good)
0.83 (Good)
0.67 (Good)
0.57 (Good)
0.34 (Good)
0.35 (Good)
0.27 (Good)
0.31 (Good)
0.38 (Good)
0.71 (Good)
o3
17 (Good)
13 (Good)
12 (Good)
9.7 (Good)
12 (Good)
10 (Good)
10 (Good)
9.9 (Good)
12 (Good)
6.9 (Good)
4.3 (Good)
7.8 (Good)
9.1 (Good)
13 (Good)
no2
- (Good)
- (Good)
- (Good)
15 (Good)
9 (Good)
5.4 (Good)
15 (Good)
25 (Good)
12 (Good)
16 (Good)
8.9 (Good)
10 (Good)
4.7 (Good)
43 (Moderate)
data source »
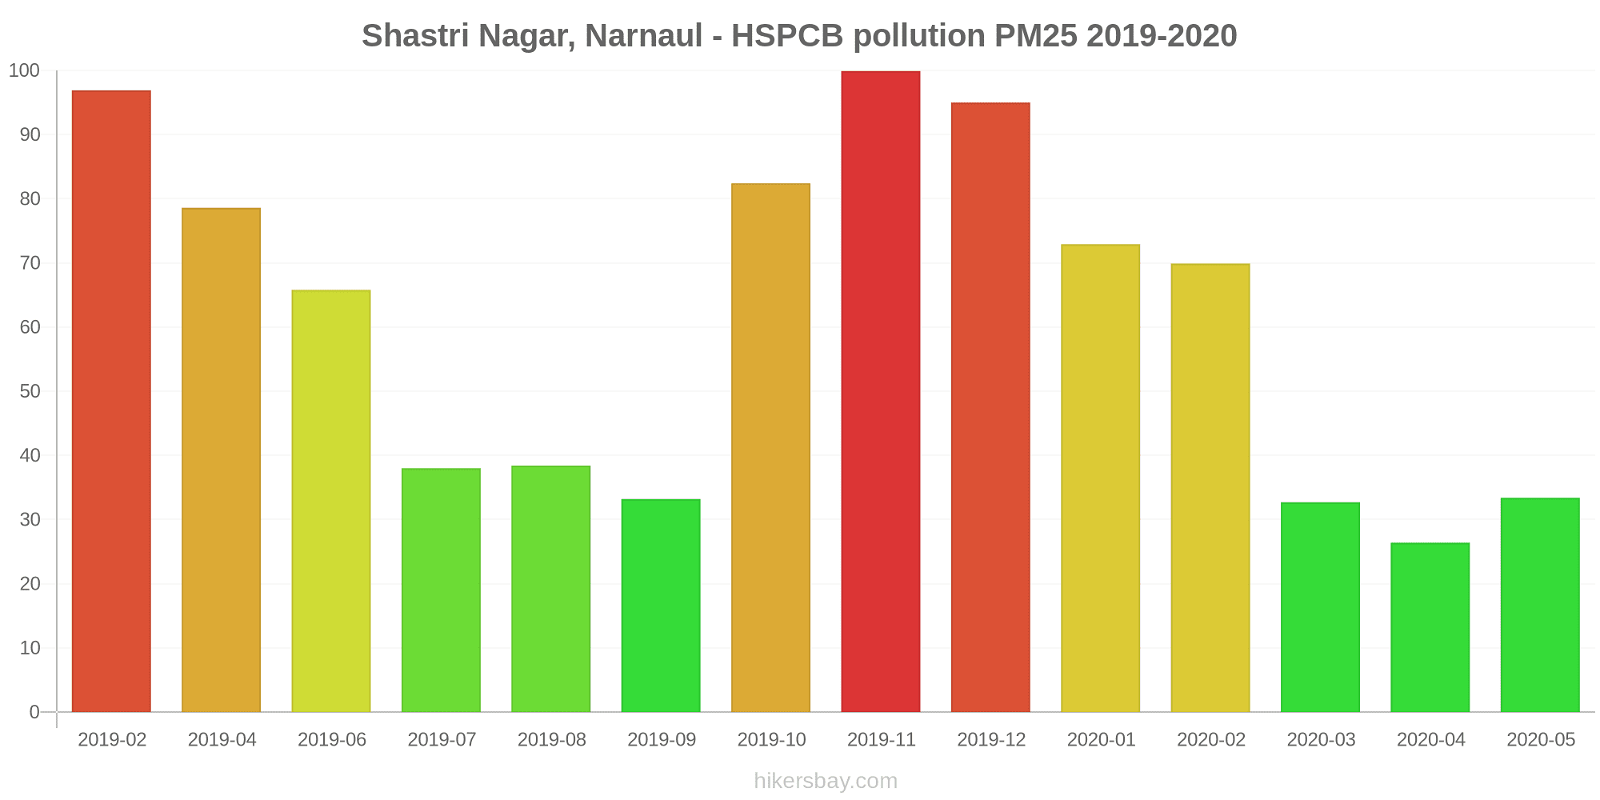
Shastri Nagar, Narnaul - HSPCB
Monday, October 31, 2022, 2:00 AM
PM10 150 (Very bad Hazardous)
particulate matter (PM10) suspended dust
SO2 4 (Good)
sulfur dioxide (SO2)
PM2,5 59 (Unhealthy)
particulate matter (PM2.5) dust
CO 0.32 (Good)
carbon monoxide (CO)
NO2 19 (Good)
nitrogen dioxide (NO2)
O3 5 (Good)
ozone (O3)
Shastri Nagar, Narnaul - HSPCB
index
2022-10-31
pm10
145
so2
3.6
pm25
60
co
0.32
no2
16
o3
4.6
Shastri Nagar, Narnaul - HSPCB
2019-02 2020-05
index
2020-05
2020-04
2020-03
2020-02
2020-01
2019-12
2019-11
2019-10
2019-09
2019-08
2019-07
2019-06
2019-04
2019-02
pm25
33
26
33
70
73
95
100
82
33
38
38
66
79
97
pm10
96
82
77
116
98
138
141
151
46
38
74
138
192
140
no2
-
-
-
15
9
5.4
15
25
12
16
8.9
10
4.7
43
so2
17
5.3
25
6.3
7.4
6.4
7.3
4.2
4.9
6.5
-
-
5.5
5.5
co
0.33
0.31
0.36
0.62
0.65
0.83
0.67
0.57
0.34
0.35
0.27
0.31
0.38
0.71
o3
17
13
12
9.7
12
10
10
9.9
12
6.9
4.3
7.8
9.1
13
* Pollution data source:
https://openaq.org
(caaqm)
The data is licensed under CC-By 4.0
PM10 150 (Very bad Hazardous)
SO2 4 (Good)
PM2,5 59 (Unhealthy)
CO 0 (Good)
NO2 19 (Good)
O3 5 (Good)
Data on air pollution from recent days in Mahendragarh
| index | 2022-10-31 |
|---|---|
| pm10 | 145 Very Unhealthy |
| so2 | 4 Good |
| pm25 | 60 Unhealthy |
| co | 0 Good |
| no2 | 16 Good |
| o3 | 5 Good |

| index | 2020-05 | 2020-04 | 2020-03 | 2020-02 | 2020-01 | 2019-12 | 2019-11 | 2019-10 | 2019-09 | 2019-08 | 2019-07 | 2019-06 | 2019-04 | 2019-02 |
|---|---|---|---|---|---|---|---|---|---|---|---|---|---|---|
| pm25 | 33 (Moderate) | 26 (Moderate) | 33 (Moderate) | 70 (Unhealthy) | 73 (Unhealthy) | 95 (Very Unhealthy) | 100 (Very Unhealthy) | 82 (Very Unhealthy) | 33 (Moderate) | 38 (Unhealthy for Sensitive Groups) | 38 (Unhealthy for Sensitive Groups) | 66 (Unhealthy) | 79 (Very Unhealthy) | 97 (Very Unhealthy) |
| pm10 | 96 (Unhealthy) | 82 (Unhealthy) | 77 (Unhealthy for Sensitive Groups) | 116 (Very Unhealthy) | 98 (Unhealthy) | 138 (Very Unhealthy) | 141 (Very Unhealthy) | 151 (Very bad Hazardous) | 46 (Moderate) | 38 (Moderate) | 74 (Unhealthy for Sensitive Groups) | 138 (Very Unhealthy) | 192 (Very bad Hazardous) | 140 (Very Unhealthy) |
| so2 | 17 (Good) | 5.3 (Good) | 25 (Good) | 6.3 (Good) | 7.4 (Good) | 6.4 (Good) | 7.3 (Good) | 4.2 (Good) | 4.9 (Good) | 6.5 (Good) | - (Good) | - (Good) | 5.5 (Good) | 5.5 (Good) |
| co | 0.33 (Good) | 0.31 (Good) | 0.36 (Good) | 0.62 (Good) | 0.65 (Good) | 0.83 (Good) | 0.67 (Good) | 0.57 (Good) | 0.34 (Good) | 0.35 (Good) | 0.27 (Good) | 0.31 (Good) | 0.38 (Good) | 0.71 (Good) |
| o3 | 17 (Good) | 13 (Good) | 12 (Good) | 9.7 (Good) | 12 (Good) | 10 (Good) | 10 (Good) | 9.9 (Good) | 12 (Good) | 6.9 (Good) | 4.3 (Good) | 7.8 (Good) | 9.1 (Good) | 13 (Good) |
| no2 | - (Good) | - (Good) | - (Good) | 15 (Good) | 9 (Good) | 5.4 (Good) | 15 (Good) | 25 (Good) | 12 (Good) | 16 (Good) | 8.9 (Good) | 10 (Good) | 4.7 (Good) | 43 (Moderate) |
PM10 150 (Very bad Hazardous)
particulate matter (PM10) suspended dustSO2 4 (Good)
sulfur dioxide (SO2)PM2,5 59 (Unhealthy)
particulate matter (PM2.5) dustCO 0.32 (Good)
carbon monoxide (CO)NO2 19 (Good)
nitrogen dioxide (NO2)O3 5 (Good)
ozone (O3)Shastri Nagar, Narnaul - HSPCB
| index | 2022-10-31 |
|---|---|
| pm10 | 145 |
| so2 | 3.6 |
| pm25 | 60 |
| co | 0.32 |
| no2 | 16 |
| o3 | 4.6 |
Shastri Nagar, Narnaul - HSPCB

| index | 2020-05 | 2020-04 | 2020-03 | 2020-02 | 2020-01 | 2019-12 | 2019-11 | 2019-10 | 2019-09 | 2019-08 | 2019-07 | 2019-06 | 2019-04 | 2019-02 |
|---|---|---|---|---|---|---|---|---|---|---|---|---|---|---|
| pm25 | 33 | 26 | 33 | 70 | 73 | 95 | 100 | 82 | 33 | 38 | 38 | 66 | 79 | 97 |
| pm10 | 96 | 82 | 77 | 116 | 98 | 138 | 141 | 151 | 46 | 38 | 74 | 138 | 192 | 140 |
| no2 | - | - | - | 15 | 9 | 5.4 | 15 | 25 | 12 | 16 | 8.9 | 10 | 4.7 | 43 |
| so2 | 17 | 5.3 | 25 | 6.3 | 7.4 | 6.4 | 7.3 | 4.2 | 4.9 | 6.5 | - | - | 5.5 | 5.5 |
| co | 0.33 | 0.31 | 0.36 | 0.62 | 0.65 | 0.83 | 0.67 | 0.57 | 0.34 | 0.35 | 0.27 | 0.31 | 0.38 | 0.71 |
| o3 | 17 | 13 | 12 | 9.7 | 12 | 10 | 10 | 9.9 | 12 | 6.9 | 4.3 | 7.8 | 9.1 | 13 |