Air Pollution in Moradabad: Real-time Air Quality Index and smog alert.
Pollution and air quality forecast for Moradabad. Today is Wednesday, May 13, 2026. The following air pollution values have been recorded for Moradabad:- particulate matter (PM2.5) dust - 22 (Moderate)
- carbon monoxide (CO) - 219 (Good)
- ozone (O3) - 0 (Good)
- nitrogen dioxide (NO2) - 7 (Good)
- particulate matter (PM10) suspended dust - 36 (Moderate)
- sulfur dioxide (SO2) - 8 (Good)

What is the air quality in Moradabad today? Is the air polluted in Moradabad?. Is there smog?
What is the current level of PM2.5 in Moradabad? (particulate matter (PM2.5) dust)
Today's PM2.5 level is:
22 (Moderate)
For comparison, the highest level of PM2.5 in Moradabad in the last 7 days was: 23 (Friday, May 27, 2022) and the lowest: 23 (Friday, May 27, 2022).
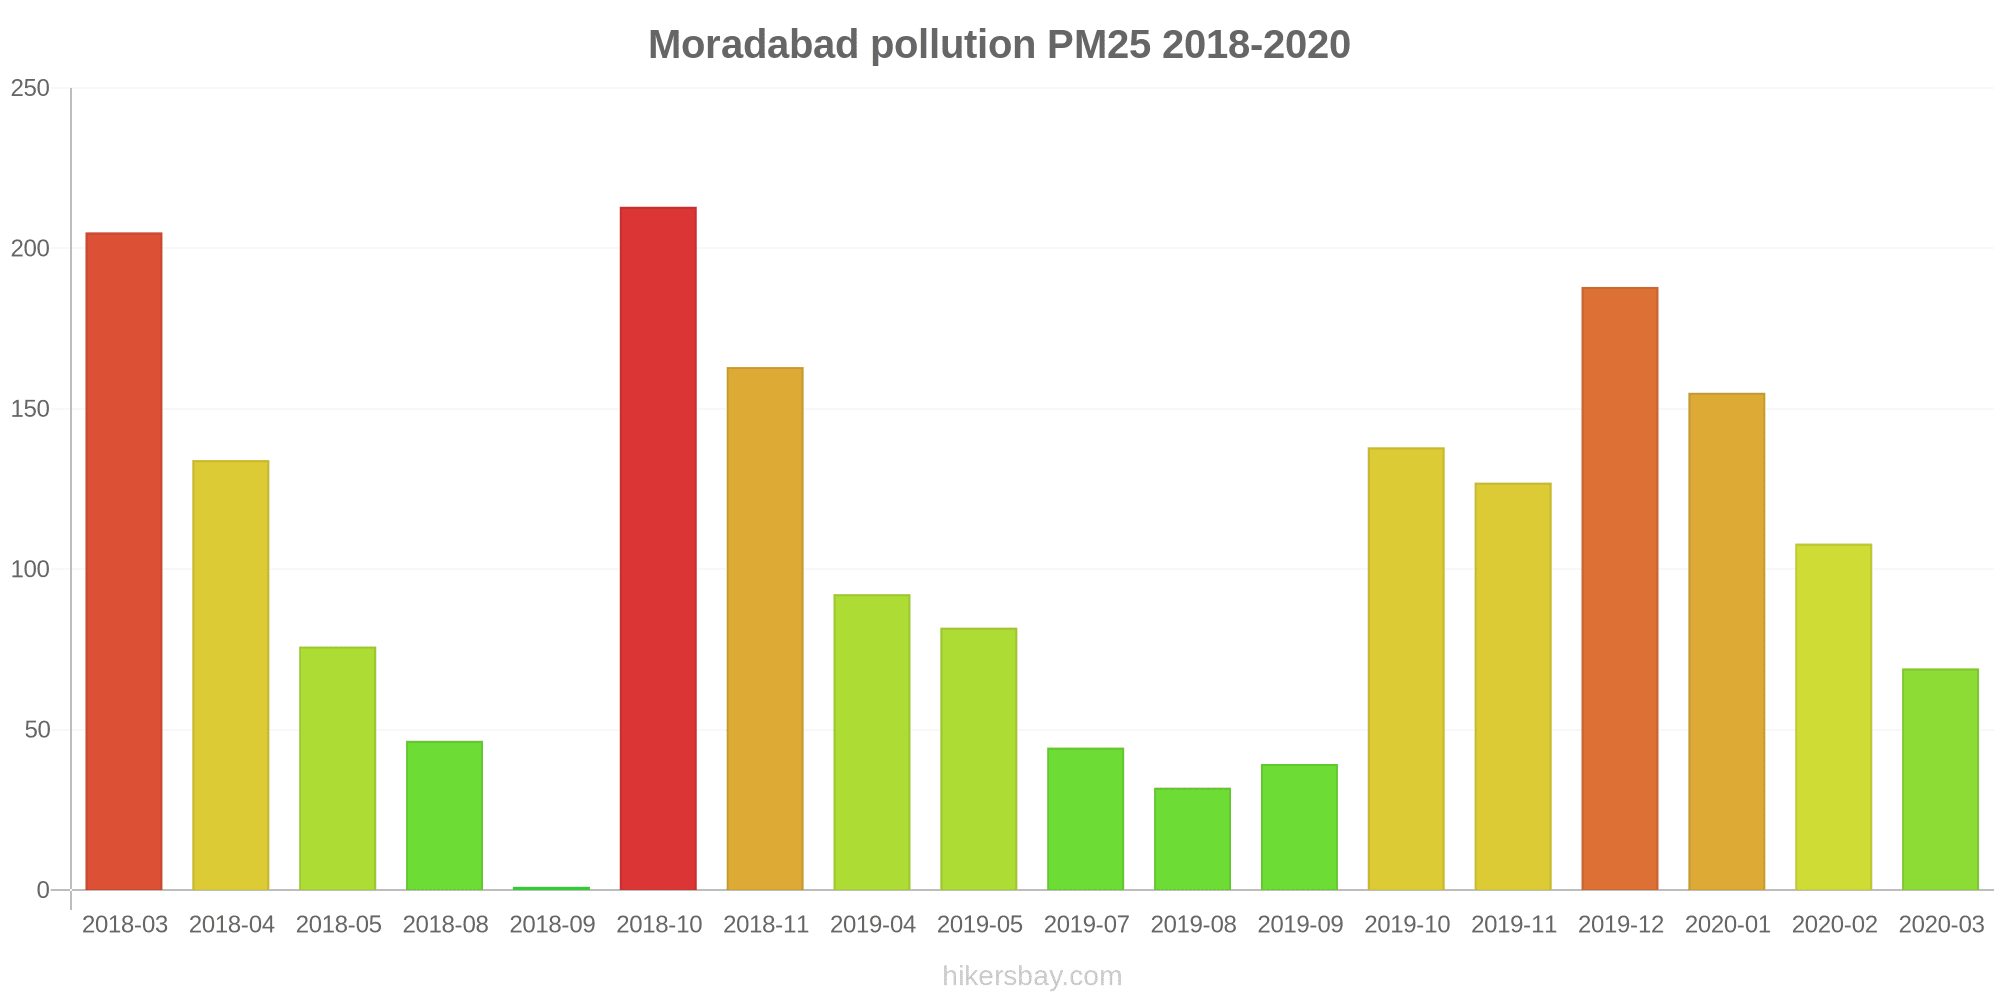
The highest PM2.5 values were recorded: 213 (October 2018).
The lowest level of particulate matter PM2.5 pollution occurs in month: September (1).
How high is the CO level? (carbon monoxide (CO))
219 (Good)
How is the O3 level today in Moradabad? (ozone (O3))
0 (Good)
How high is the level of NO2? (nitrogen dioxide (NO2))
7 (Good)
What is the level of PM10 today in Moradabad? (particulate matter (PM10) suspended dust)
The current level of particulate matter PM10 in Moradabad is:
36 (Moderate)
The highest PM10 values usually occur in month: 331 (May 2019).
The lowest value of particulate matter PM10 pollution in Moradabad is usually recorded in: September (1).
What is the level of SO2 pollution? (sulfur dioxide (SO2))
8 (Good)
Current data Friday, May 27, 2022, 3:00 PM
PM2,5 22 (Moderate)
CO 219 (Good)
O3 0 (Good)
NO2 7 (Good)
PM10 36 (Moderate)
SO2 8 (Good)
Data on air pollution from recent days in Moradabad
index
2022-05-27
pm25
23
Moderate
co
475
Good
o3
25
Good
no2
21
Good
pm10
32
Moderate
so2
4
Good
data source »
Air pollution in Moradabad from March 2018 to April 2020

index
2020-04
2020-03
2020-02
2020-01
2019-12
2019-11
2019-10
2019-09
2019-08
2019-07
2019-05
2019-04
2018-11
2018-10
2018-09
2018-08
2018-05
2018-04
2018-03
o3
12 (Good)
- (Good)
- (Good)
9.5 (Good)
9.4 (Good)
11 (Good)
51 (Good)
31 (Good)
25 (Good)
35 (Good)
92 (Moderate)
96 (Moderate)
58 (Good)
61 (Good)
42 (Good)
29 (Good)
69 (Good)
56 (Good)
30 (Good)
no2
9.3 (Good)
23 (Good)
60 (Moderate)
57 (Moderate)
77 (Moderate)
76 (Moderate)
40 (Good)
12 (Good)
12 (Good)
15 (Good)
30 (Good)
57 (Moderate)
64 (Moderate)
50 (Moderate)
27 (Good)
16 (Good)
58 (Moderate)
108 (Unhealthy for Sensitive Groups)
53 (Moderate)
so2
9.5 (Good)
18 (Good)
25 (Good)
25 (Good)
26 (Good)
30 (Good)
38 (Good)
22 (Good)
21 (Good)
21 (Good)
29 (Good)
45 (Good)
41 (Good)
41 (Good)
26 (Good)
21 (Good)
19 (Good)
21 (Good)
40 (Good)
co
1 (Good)
1 (Good)
1 (Good)
1 (Good)
1 (Good)
1 (Good)
1 (Good)
697 (Good)
1 (Good)
1 (Good)
665 (Good)
963 (Good)
2 (Good)
1 (Good)
862 (Good)
1 (Good)
621 (Good)
21 (Good)
63 (Good)
pm25
- (Good)
69 (Unhealthy)
108 (Very Unhealthy)
155 (Very bad Hazardous)
188 (Very bad Hazardous)
127 (Very bad Hazardous)
138 (Very bad Hazardous)
39 (Unhealthy for Sensitive Groups)
32 (Moderate)
44 (Unhealthy for Sensitive Groups)
82 (Very Unhealthy)
92 (Very Unhealthy)
163 (Very bad Hazardous)
213 (Very bad Hazardous)
1 (Good)
47 (Unhealthy for Sensitive Groups)
76 (Very Unhealthy)
134 (Very bad Hazardous)
205 (Very bad Hazardous)
pm10
- (Good)
103 (Unhealthy)
190 (Very bad Hazardous)
228 (Very bad Hazardous)
273 (Very bad Hazardous)
212 (Very bad Hazardous)
216 (Very bad Hazardous)
93 (Unhealthy)
82 (Unhealthy)
116 (Very Unhealthy)
331 (Very bad Hazardous)
305 (Very bad Hazardous)
260 (Very bad Hazardous)
270 (Very bad Hazardous)
1 (Good)
88 (Unhealthy)
202 (Very bad Hazardous)
255 (Very bad Hazardous)
175 (Very bad Hazardous)
data source »
Quality of life in Moradabad
Green and Parks in the City
Moradabad
25%
Nepal: 32%
Bangladesh: 33%
Bhutan: 82%
Sri Lanka: 59%
Pakistan: 49%
Pleasure of spending time in the city
Moradabad
40%
Nepal: 32%
Bangladesh: 26%
Bhutan: 61%
Sri Lanka: 52%
Pakistan: 43%
Air Pollution
Moradabad
60%
Nepal: 76%
Bangladesh: 78%
Bhutan: 45%
Sri Lanka: 53%
Pakistan: 64%
Garbage Disposal
Moradabad
30%
Nepal: 25%
Bangladesh: 22%
Bhutan: 47%
Sri Lanka: 41%
Pakistan: 34%
Availability and quality of drinking water
Moradabad
55%
Nepal: 36%
Bangladesh: 44%
Bhutan: 64%
Sri Lanka: 65%
Pakistan: 44%
Cleanliness and tidiness
Moradabad
20%
Nepal: 27%
Bangladesh: 23%
Bhutan: 57%
Sri Lanka: 52%
Pakistan: 40%
Noise and Light pollution
Moradabad
45%
Nepal: 55%
Bangladesh: 63%
Bhutan: 55%
Sri Lanka: 50%
Pakistan: 59%
Water Pollution
Moradabad
55%
Nepal: 76%
Bangladesh: 74%
Bhutan: 56%
Sri Lanka: 57%
Pakistan: 70%
Source: Numbeo
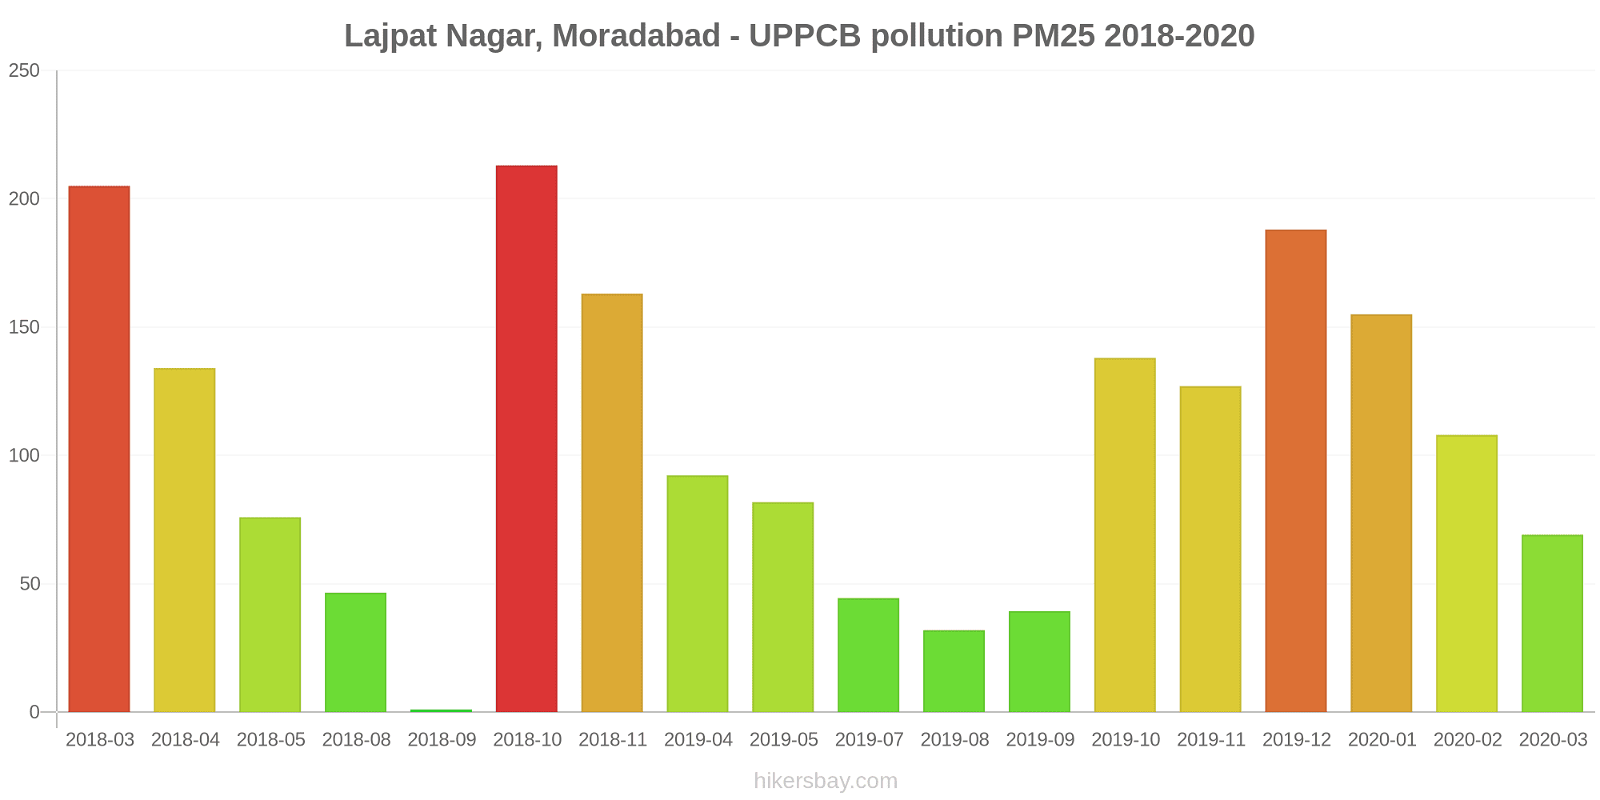
Lajpat Nagar, Moradabad - UPPCB
Friday, May 27, 2022, 3:00 PM
PM2,5 22 (Moderate)
particulate matter (PM2.5) dust
CO 219 (Good)
carbon monoxide (CO)
O3 0.05 (Good)
ozone (O3)
NO2 7 (Good)
nitrogen dioxide (NO2)
PM10 36 (Moderate)
particulate matter (PM10) suspended dust
SO2 7.7 (Good)
sulfur dioxide (SO2)
Lajpat Nagar, Moradabad - UPPCB
index
2022-05-27
pm25
23
co
475
o3
25
no2
21
pm10
32
so2
4.4
Lajpat Nagar, Moradabad - UPPCB
2018-03 2020-04
index
2020-04
2020-03
2020-02
2020-01
2019-12
2019-11
2019-10
2019-09
2019-08
2019-07
2019-05
2019-04
2018-11
2018-10
2018-09
2018-08
2018-05
2018-04
2018-03
pm25
-
69
108
155
188
127
138
39
32
44
82
92
163
213
1
47
76
134
205
pm10
-
103
190
228
273
212
216
93
82
116
331
305
260
270
1
88
202
255
175
so2
9.5
18
25
25
26
30
38
22
21
21
29
45
41
41
26
21
19
21
40
co
1
1
1
1
1
1
1
697
1
1
665
963
2
1
862
1
621
21
63
o3
12
-
-
9.5
9.4
11
51
31
25
35
92
96
58
61
42
29
69
56
30
no2
9.3
23
60
57
77
76
40
12
12
15
30
57
64
50
27
16
58
108
53
* Pollution data source:
https://openaq.org
(caaqm)
The data is licensed under CC-By 4.0
PM2,5 22 (Moderate)
CO 219 (Good)
O3 0 (Good)
NO2 7 (Good)
PM10 36 (Moderate)
SO2 8 (Good)
Data on air pollution from recent days in Moradabad
| index | 2022-05-27 |
|---|---|
| pm25 | 23 Moderate |
| co | 475 Good |
| o3 | 25 Good |
| no2 | 21 Good |
| pm10 | 32 Moderate |
| so2 | 4 Good |
| index | 2020-04 | 2020-03 | 2020-02 | 2020-01 | 2019-12 | 2019-11 | 2019-10 | 2019-09 | 2019-08 | 2019-07 | 2019-05 | 2019-04 | 2018-11 | 2018-10 | 2018-09 | 2018-08 | 2018-05 | 2018-04 | 2018-03 |
|---|---|---|---|---|---|---|---|---|---|---|---|---|---|---|---|---|---|---|---|
| o3 | 12 (Good) | - (Good) | - (Good) | 9.5 (Good) | 9.4 (Good) | 11 (Good) | 51 (Good) | 31 (Good) | 25 (Good) | 35 (Good) | 92 (Moderate) | 96 (Moderate) | 58 (Good) | 61 (Good) | 42 (Good) | 29 (Good) | 69 (Good) | 56 (Good) | 30 (Good) |
| no2 | 9.3 (Good) | 23 (Good) | 60 (Moderate) | 57 (Moderate) | 77 (Moderate) | 76 (Moderate) | 40 (Good) | 12 (Good) | 12 (Good) | 15 (Good) | 30 (Good) | 57 (Moderate) | 64 (Moderate) | 50 (Moderate) | 27 (Good) | 16 (Good) | 58 (Moderate) | 108 (Unhealthy for Sensitive Groups) | 53 (Moderate) |
| so2 | 9.5 (Good) | 18 (Good) | 25 (Good) | 25 (Good) | 26 (Good) | 30 (Good) | 38 (Good) | 22 (Good) | 21 (Good) | 21 (Good) | 29 (Good) | 45 (Good) | 41 (Good) | 41 (Good) | 26 (Good) | 21 (Good) | 19 (Good) | 21 (Good) | 40 (Good) |
| co | 1 (Good) | 1 (Good) | 1 (Good) | 1 (Good) | 1 (Good) | 1 (Good) | 1 (Good) | 697 (Good) | 1 (Good) | 1 (Good) | 665 (Good) | 963 (Good) | 2 (Good) | 1 (Good) | 862 (Good) | 1 (Good) | 621 (Good) | 21 (Good) | 63 (Good) |
| pm25 | - (Good) | 69 (Unhealthy) | 108 (Very Unhealthy) | 155 (Very bad Hazardous) | 188 (Very bad Hazardous) | 127 (Very bad Hazardous) | 138 (Very bad Hazardous) | 39 (Unhealthy for Sensitive Groups) | 32 (Moderate) | 44 (Unhealthy for Sensitive Groups) | 82 (Very Unhealthy) | 92 (Very Unhealthy) | 163 (Very bad Hazardous) | 213 (Very bad Hazardous) | 1 (Good) | 47 (Unhealthy for Sensitive Groups) | 76 (Very Unhealthy) | 134 (Very bad Hazardous) | 205 (Very bad Hazardous) |
| pm10 | - (Good) | 103 (Unhealthy) | 190 (Very bad Hazardous) | 228 (Very bad Hazardous) | 273 (Very bad Hazardous) | 212 (Very bad Hazardous) | 216 (Very bad Hazardous) | 93 (Unhealthy) | 82 (Unhealthy) | 116 (Very Unhealthy) | 331 (Very bad Hazardous) | 305 (Very bad Hazardous) | 260 (Very bad Hazardous) | 270 (Very bad Hazardous) | 1 (Good) | 88 (Unhealthy) | 202 (Very bad Hazardous) | 255 (Very bad Hazardous) | 175 (Very bad Hazardous) |
Green and Parks in the City
Moradabad 25%
Nepal: 32% Bangladesh: 33% Bhutan: 82% Sri Lanka: 59% Pakistan: 49%Pleasure of spending time in the city
Moradabad 40%
Nepal: 32% Bangladesh: 26% Bhutan: 61% Sri Lanka: 52% Pakistan: 43%Air Pollution
Moradabad 60%
Nepal: 76% Bangladesh: 78% Bhutan: 45% Sri Lanka: 53% Pakistan: 64%Garbage Disposal
Moradabad 30%
Nepal: 25% Bangladesh: 22% Bhutan: 47% Sri Lanka: 41% Pakistan: 34%Availability and quality of drinking water
Moradabad 55%
Nepal: 36% Bangladesh: 44% Bhutan: 64% Sri Lanka: 65% Pakistan: 44%Cleanliness and tidiness
Moradabad 20%
Nepal: 27% Bangladesh: 23% Bhutan: 57% Sri Lanka: 52% Pakistan: 40%Noise and Light pollution
Moradabad 45%
Nepal: 55% Bangladesh: 63% Bhutan: 55% Sri Lanka: 50% Pakistan: 59%Water Pollution
Moradabad 55%
Nepal: 76% Bangladesh: 74% Bhutan: 56% Sri Lanka: 57% Pakistan: 70%PM2,5 22 (Moderate)
particulate matter (PM2.5) dustCO 219 (Good)
carbon monoxide (CO)O3 0.05 (Good)
ozone (O3)NO2 7 (Good)
nitrogen dioxide (NO2)PM10 36 (Moderate)
particulate matter (PM10) suspended dustSO2 7.7 (Good)
sulfur dioxide (SO2)Lajpat Nagar, Moradabad - UPPCB
| index | 2022-05-27 |
|---|---|
| pm25 | 23 |
| co | 475 |
| o3 | 25 |
| no2 | 21 |
| pm10 | 32 |
| so2 | 4.4 |
Lajpat Nagar, Moradabad - UPPCB

| index | 2020-04 | 2020-03 | 2020-02 | 2020-01 | 2019-12 | 2019-11 | 2019-10 | 2019-09 | 2019-08 | 2019-07 | 2019-05 | 2019-04 | 2018-11 | 2018-10 | 2018-09 | 2018-08 | 2018-05 | 2018-04 | 2018-03 |
|---|---|---|---|---|---|---|---|---|---|---|---|---|---|---|---|---|---|---|---|
| pm25 | - | 69 | 108 | 155 | 188 | 127 | 138 | 39 | 32 | 44 | 82 | 92 | 163 | 213 | 1 | 47 | 76 | 134 | 205 |
| pm10 | - | 103 | 190 | 228 | 273 | 212 | 216 | 93 | 82 | 116 | 331 | 305 | 260 | 270 | 1 | 88 | 202 | 255 | 175 |
| so2 | 9.5 | 18 | 25 | 25 | 26 | 30 | 38 | 22 | 21 | 21 | 29 | 45 | 41 | 41 | 26 | 21 | 19 | 21 | 40 |
| co | 1 | 1 | 1 | 1 | 1 | 1 | 1 | 697 | 1 | 1 | 665 | 963 | 2 | 1 | 862 | 1 | 621 | 21 | 63 |
| o3 | 12 | - | - | 9.5 | 9.4 | 11 | 51 | 31 | 25 | 35 | 92 | 96 | 58 | 61 | 42 | 29 | 69 | 56 | 30 |
| no2 | 9.3 | 23 | 60 | 57 | 77 | 76 | 40 | 12 | 12 | 15 | 30 | 57 | 64 | 50 | 27 | 16 | 58 | 108 | 53 |