Air Pollution in Pāli: Real-time Air Quality Index and smog alert.
Pollution and air quality forecast for Pāli. Today is Wednesday, May 13, 2026. The following air pollution values have been recorded for Pāli:- particulate matter (PM10) suspended dust - 54 (Unhealthy for Sensitive Groups)
- sulfur dioxide (SO2) - 10 (Good)
- particulate matter (PM2.5) dust - 50 (Unhealthy for Sensitive Groups)
- carbon monoxide (CO) - 1130 (Good)
- nitrogen dioxide (NO2) - 20 (Good)
- ozone (O3) - 14 (Good)

What is the air quality in Pāli today? Is the air polluted in Pāli?. Is there smog?
What is the level of PM10 today in Pāli? (particulate matter (PM10) suspended dust)
The current level of particulate matter PM10 in Pāli is:
54 (Unhealthy for Sensitive Groups)
The highest PM10 values usually occur in month: 246 (May 2019).
The lowest value of particulate matter PM10 pollution in Pāli is usually recorded in: May (66).
What is the level of SO2 pollution? (sulfur dioxide (SO2))
10 (Good)
What is the current level of PM2.5 in Pāli? (particulate matter (PM2.5) dust)
Today's PM2.5 level is:
50 (Unhealthy for Sensitive Groups)
For comparison, the highest level of PM2.5 in Pāli in the last 7 days was: 56 (Monday, October 31, 2022) and the lowest: 56 (Monday, October 31, 2022).
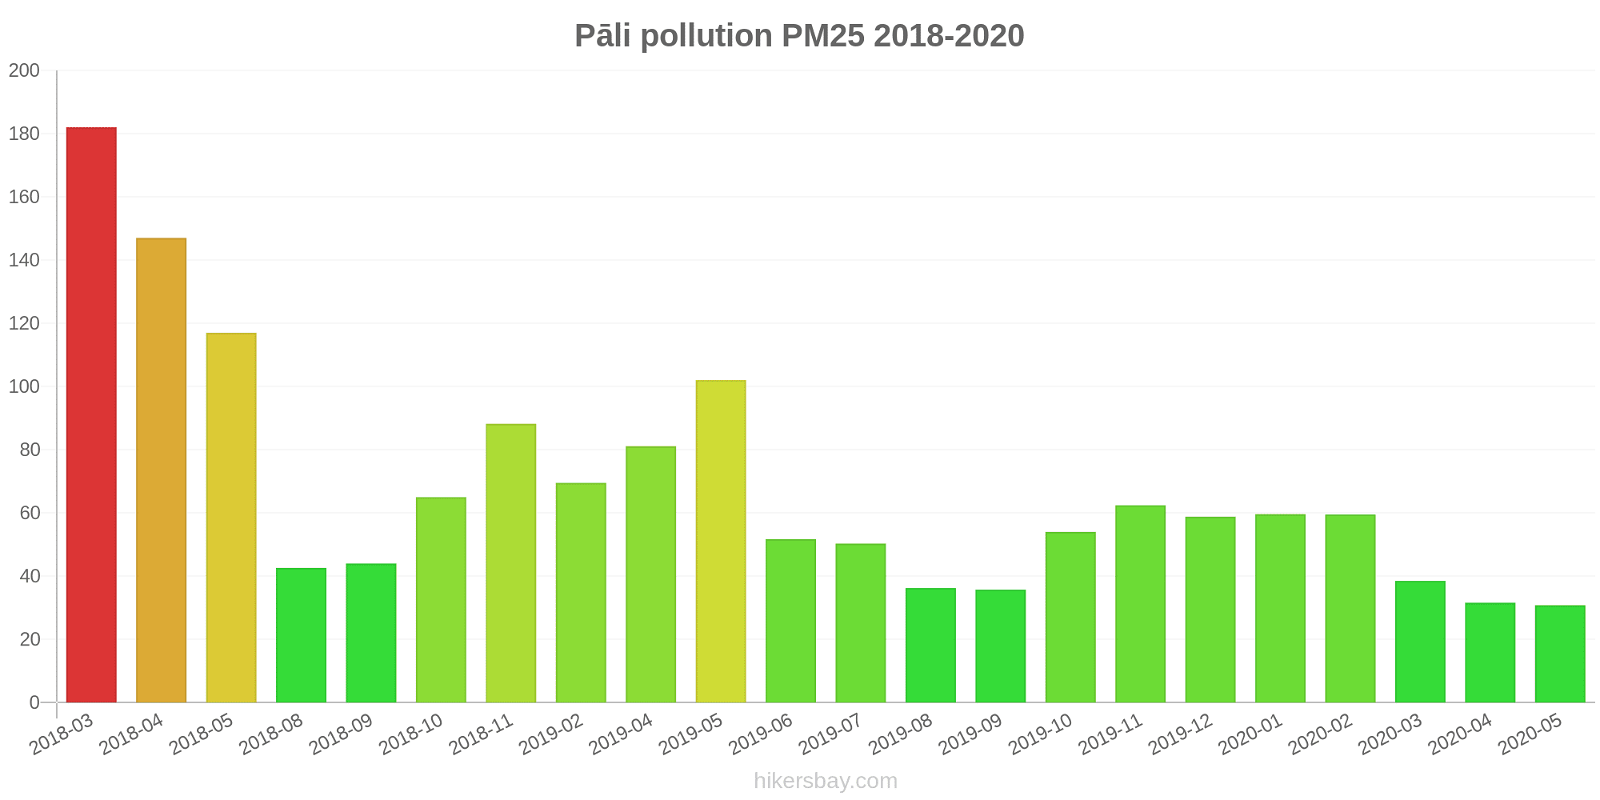
The highest PM2.5 values were recorded: 182 (March 2018).
The lowest level of particulate matter PM2.5 pollution occurs in month: May (31).
How high is the CO level? (carbon monoxide (CO))
1130 (Good)
How high is the level of NO2? (nitrogen dioxide (NO2))
20 (Good)
How is the O3 level today in Pāli? (ozone (O3))
14 (Good)
Current data Monday, October 31, 2022, 1:45 AM
PM10 54 (Unhealthy for Sensitive Groups)
SO2 10 (Good)
PM2,5 50 (Unhealthy for Sensitive Groups)
CO 1130 (Good)
NO2 20 (Good)
O3 14 (Good)
Data on air pollution from recent days in Pāli
index
2022-10-31
pm10
64
Unhealthy for Sensitive Groups
so2
9
Good
pm25
56
Unhealthy
co
1070
Good
no2
19
Good
o3
18
Good
data source »
Air pollution in Pāli from March 2018 to May 2020
index
2020-05
2020-04
2020-03
2020-02
2020-01
2019-12
2019-11
2019-10
2019-09
2019-08
2019-07
2019-06
2019-05
2019-04
2019-02
2018-11
2018-10
2018-09
2018-08
2018-05
2018-04
2018-03
pm25
31 (Moderate)
32 (Moderate)
39 (Unhealthy for Sensitive Groups)
60 (Unhealthy)
60 (Unhealthy)
59 (Unhealthy)
62 (Unhealthy)
54 (Unhealthy for Sensitive Groups)
36 (Unhealthy for Sensitive Groups)
36 (Unhealthy for Sensitive Groups)
50 (Unhealthy for Sensitive Groups)
52 (Unhealthy for Sensitive Groups)
102 (Very Unhealthy)
81 (Very Unhealthy)
70 (Unhealthy)
88 (Very Unhealthy)
65 (Unhealthy)
44 (Unhealthy for Sensitive Groups)
43 (Unhealthy for Sensitive Groups)
117 (Very bad Hazardous)
147 (Very bad Hazardous)
182 (Very bad Hazardous)
pm10
66 (Unhealthy for Sensitive Groups)
83 (Unhealthy)
100 (Unhealthy)
123 (Very Unhealthy)
101 (Unhealthy)
100 (Unhealthy)
100 (Unhealthy)
93 (Unhealthy)
69 (Unhealthy for Sensitive Groups)
74 (Unhealthy for Sensitive Groups)
101 (Unhealthy)
107 (Unhealthy)
246 (Very bad Hazardous)
183 (Very bad Hazardous)
124 (Very Unhealthy)
162 (Very bad Hazardous)
141 (Very Unhealthy)
87 (Unhealthy)
98 (Unhealthy)
210 (Very bad Hazardous)
169 (Very bad Hazardous)
137 (Very Unhealthy)
no2
8.1 (Good)
13 (Good)
26 (Good)
23 (Good)
22 (Good)
23 (Good)
22 (Good)
28 (Good)
31 (Good)
31 (Good)
24 (Good)
29 (Good)
39 (Good)
32 (Good)
42 (Moderate)
48 (Moderate)
27 (Good)
23 (Good)
14 (Good)
12 (Good)
9.9 (Good)
15 (Good)
so2
2.1 (Good)
2.6 (Good)
3.9 (Good)
8.2 (Good)
7.9 (Good)
6.7 (Good)
6.4 (Good)
8.5 (Good)
5.6 (Good)
5.7 (Good)
6 (Good)
8.7 (Good)
13 (Good)
22 (Good)
14 (Good)
9.9 (Good)
6.9 (Good)
3.5 (Good)
3.5 (Good)
12 (Good)
18 (Good)
29 (Good)
co
322 (Good)
307 (Good)
335 (Good)
583 (Good)
575 (Good)
577 (Good)
617 (Good)
686 (Good)
668 (Good)
480 (Good)
465 (Good)
456 (Good)
523 (Good)
589 (Good)
654 (Good)
937 (Good)
661 (Good)
454 (Good)
237 (Good)
448 (Good)
11 (Good)
32 (Good)
o3
41 (Good)
40 (Good)
44 (Good)
49 (Good)
37 (Good)
39 (Good)
41 (Good)
34 (Good)
22 (Good)
22 (Good)
30 (Good)
37 (Good)
40 (Good)
38 (Good)
45 (Good)
40 (Good)
47 (Good)
31 (Good)
33 (Good)
36 (Good)
35 (Good)
34 (Good)
data source »
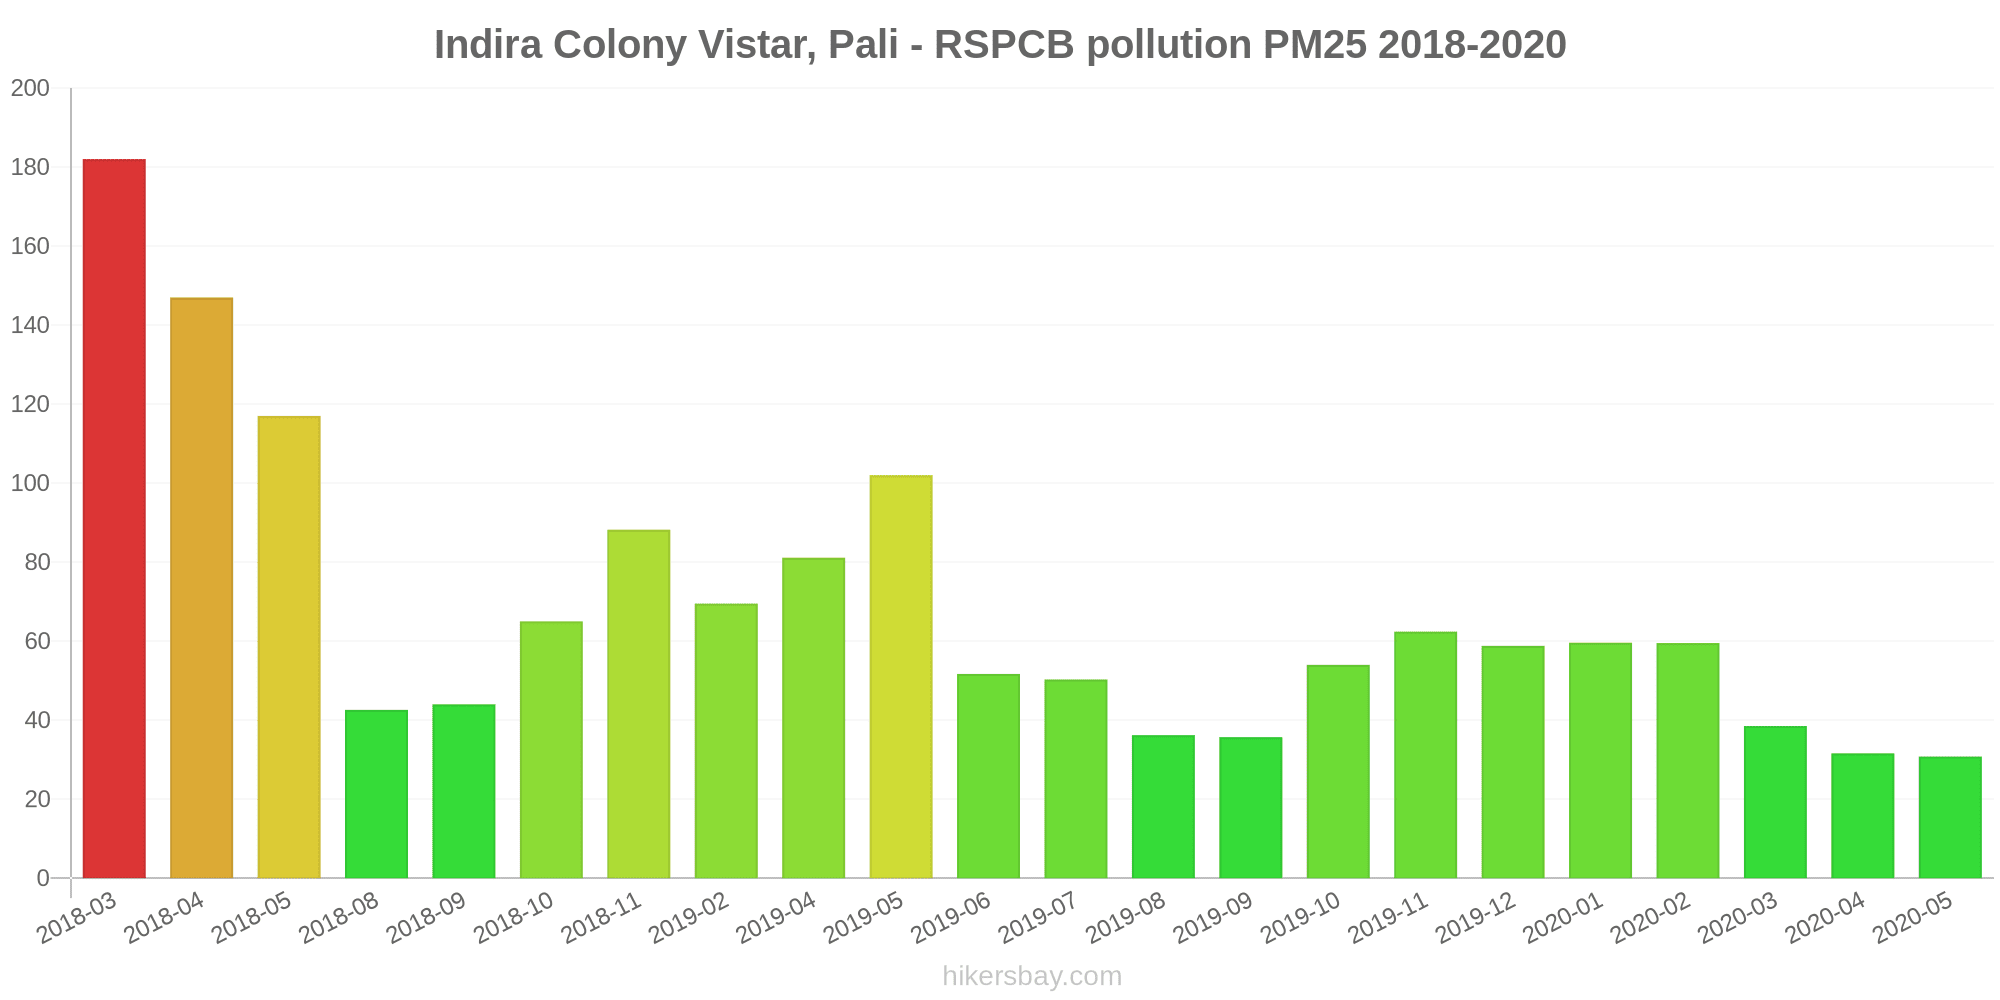
Indira Colony Vistar, Pali - RSPCB
Monday, October 31, 2022, 1:45 AM
PM10 54 (Unhealthy for Sensitive Groups)
particulate matter (PM10) suspended dust
SO2 9.8 (Good)
sulfur dioxide (SO2)
PM2,5 50 (Unhealthy for Sensitive Groups)
particulate matter (PM2.5) dust
CO 1130 (Good)
carbon monoxide (CO)
NO2 20 (Good)
nitrogen dioxide (NO2)
O3 14 (Good)
ozone (O3)
Indira Colony Vistar, Pali - RSPCB
index
2022-10-31
pm10
64
so2
9.1
pm25
56
co
1070
no2
19
o3
18
Indira Colony Vistar, Pali - RSPCB
2018-03 2020-05

index
2020-05
2020-04
2020-03
2020-02
2020-01
2019-12
2019-11
2019-10
2019-09
2019-08
2019-07
2019-06
2019-05
2019-04
2019-02
2018-11
2018-10
2018-09
2018-08
2018-05
2018-04
2018-03
pm25
31
32
39
60
60
59
62
54
36
36
50
52
102
81
70
88
65
44
43
117
147
182
pm10
66
83
100
123
101
100
100
93
69
74
101
107
246
183
124
162
141
87
98
210
169
137
no2
8.1
13
26
23
22
23
22
28
31
31
24
29
39
32
42
48
27
23
14
12
9.9
15
so2
2.1
2.6
3.9
8.2
7.9
6.7
6.4
8.5
5.6
5.7
6
8.7
13
22
14
9.9
6.9
3.5
3.5
12
18
29
co
322
307
335
583
575
577
617
686
668
480
465
456
523
589
654
937
661
454
237
448
11
32
o3
41
40
44
49
37
39
41
34
22
22
30
37
40
38
45
40
47
31
33
36
35
34
* Pollution data source:
https://openaq.org
(caaqm)
The data is licensed under CC-By 4.0
PM10 54 (Unhealthy for Sensitive Groups)
SO2 10 (Good)
PM2,5 50 (Unhealthy for Sensitive Groups)
CO 1130 (Good)
NO2 20 (Good)
O3 14 (Good)
Data on air pollution from recent days in Pāli
| index | 2022-10-31 |
|---|---|
| pm10 | 64 Unhealthy for Sensitive Groups |
| so2 | 9 Good |
| pm25 | 56 Unhealthy |
| co | 1070 Good |
| no2 | 19 Good |
| o3 | 18 Good |

| index | 2020-05 | 2020-04 | 2020-03 | 2020-02 | 2020-01 | 2019-12 | 2019-11 | 2019-10 | 2019-09 | 2019-08 | 2019-07 | 2019-06 | 2019-05 | 2019-04 | 2019-02 | 2018-11 | 2018-10 | 2018-09 | 2018-08 | 2018-05 | 2018-04 | 2018-03 |
|---|---|---|---|---|---|---|---|---|---|---|---|---|---|---|---|---|---|---|---|---|---|---|
| pm25 | 31 (Moderate) | 32 (Moderate) | 39 (Unhealthy for Sensitive Groups) | 60 (Unhealthy) | 60 (Unhealthy) | 59 (Unhealthy) | 62 (Unhealthy) | 54 (Unhealthy for Sensitive Groups) | 36 (Unhealthy for Sensitive Groups) | 36 (Unhealthy for Sensitive Groups) | 50 (Unhealthy for Sensitive Groups) | 52 (Unhealthy for Sensitive Groups) | 102 (Very Unhealthy) | 81 (Very Unhealthy) | 70 (Unhealthy) | 88 (Very Unhealthy) | 65 (Unhealthy) | 44 (Unhealthy for Sensitive Groups) | 43 (Unhealthy for Sensitive Groups) | 117 (Very bad Hazardous) | 147 (Very bad Hazardous) | 182 (Very bad Hazardous) |
| pm10 | 66 (Unhealthy for Sensitive Groups) | 83 (Unhealthy) | 100 (Unhealthy) | 123 (Very Unhealthy) | 101 (Unhealthy) | 100 (Unhealthy) | 100 (Unhealthy) | 93 (Unhealthy) | 69 (Unhealthy for Sensitive Groups) | 74 (Unhealthy for Sensitive Groups) | 101 (Unhealthy) | 107 (Unhealthy) | 246 (Very bad Hazardous) | 183 (Very bad Hazardous) | 124 (Very Unhealthy) | 162 (Very bad Hazardous) | 141 (Very Unhealthy) | 87 (Unhealthy) | 98 (Unhealthy) | 210 (Very bad Hazardous) | 169 (Very bad Hazardous) | 137 (Very Unhealthy) |
| no2 | 8.1 (Good) | 13 (Good) | 26 (Good) | 23 (Good) | 22 (Good) | 23 (Good) | 22 (Good) | 28 (Good) | 31 (Good) | 31 (Good) | 24 (Good) | 29 (Good) | 39 (Good) | 32 (Good) | 42 (Moderate) | 48 (Moderate) | 27 (Good) | 23 (Good) | 14 (Good) | 12 (Good) | 9.9 (Good) | 15 (Good) |
| so2 | 2.1 (Good) | 2.6 (Good) | 3.9 (Good) | 8.2 (Good) | 7.9 (Good) | 6.7 (Good) | 6.4 (Good) | 8.5 (Good) | 5.6 (Good) | 5.7 (Good) | 6 (Good) | 8.7 (Good) | 13 (Good) | 22 (Good) | 14 (Good) | 9.9 (Good) | 6.9 (Good) | 3.5 (Good) | 3.5 (Good) | 12 (Good) | 18 (Good) | 29 (Good) |
| co | 322 (Good) | 307 (Good) | 335 (Good) | 583 (Good) | 575 (Good) | 577 (Good) | 617 (Good) | 686 (Good) | 668 (Good) | 480 (Good) | 465 (Good) | 456 (Good) | 523 (Good) | 589 (Good) | 654 (Good) | 937 (Good) | 661 (Good) | 454 (Good) | 237 (Good) | 448 (Good) | 11 (Good) | 32 (Good) |
| o3 | 41 (Good) | 40 (Good) | 44 (Good) | 49 (Good) | 37 (Good) | 39 (Good) | 41 (Good) | 34 (Good) | 22 (Good) | 22 (Good) | 30 (Good) | 37 (Good) | 40 (Good) | 38 (Good) | 45 (Good) | 40 (Good) | 47 (Good) | 31 (Good) | 33 (Good) | 36 (Good) | 35 (Good) | 34 (Good) |
PM10 54 (Unhealthy for Sensitive Groups)
particulate matter (PM10) suspended dustSO2 9.8 (Good)
sulfur dioxide (SO2)PM2,5 50 (Unhealthy for Sensitive Groups)
particulate matter (PM2.5) dustCO 1130 (Good)
carbon monoxide (CO)NO2 20 (Good)
nitrogen dioxide (NO2)O3 14 (Good)
ozone (O3)Indira Colony Vistar, Pali - RSPCB
| index | 2022-10-31 |
|---|---|
| pm10 | 64 |
| so2 | 9.1 |
| pm25 | 56 |
| co | 1070 |
| no2 | 19 |
| o3 | 18 |
Indira Colony Vistar, Pali - RSPCB
| index | 2020-05 | 2020-04 | 2020-03 | 2020-02 | 2020-01 | 2019-12 | 2019-11 | 2019-10 | 2019-09 | 2019-08 | 2019-07 | 2019-06 | 2019-05 | 2019-04 | 2019-02 | 2018-11 | 2018-10 | 2018-09 | 2018-08 | 2018-05 | 2018-04 | 2018-03 |
|---|---|---|---|---|---|---|---|---|---|---|---|---|---|---|---|---|---|---|---|---|---|---|
| pm25 | 31 | 32 | 39 | 60 | 60 | 59 | 62 | 54 | 36 | 36 | 50 | 52 | 102 | 81 | 70 | 88 | 65 | 44 | 43 | 117 | 147 | 182 |
| pm10 | 66 | 83 | 100 | 123 | 101 | 100 | 100 | 93 | 69 | 74 | 101 | 107 | 246 | 183 | 124 | 162 | 141 | 87 | 98 | 210 | 169 | 137 |
| no2 | 8.1 | 13 | 26 | 23 | 22 | 23 | 22 | 28 | 31 | 31 | 24 | 29 | 39 | 32 | 42 | 48 | 27 | 23 | 14 | 12 | 9.9 | 15 |
| so2 | 2.1 | 2.6 | 3.9 | 8.2 | 7.9 | 6.7 | 6.4 | 8.5 | 5.6 | 5.7 | 6 | 8.7 | 13 | 22 | 14 | 9.9 | 6.9 | 3.5 | 3.5 | 12 | 18 | 29 |
| co | 322 | 307 | 335 | 583 | 575 | 577 | 617 | 686 | 668 | 480 | 465 | 456 | 523 | 589 | 654 | 937 | 661 | 454 | 237 | 448 | 11 | 32 |
| o3 | 41 | 40 | 44 | 49 | 37 | 39 | 41 | 34 | 22 | 22 | 30 | 37 | 40 | 38 | 45 | 40 | 47 | 31 | 33 | 36 | 35 | 34 |