Air Pollution in Patiala: Real-time Air Quality Index and smog alert.
Pollution and air quality forecast for Patiala. Today is Wednesday, May 13, 2026. The following air pollution values have been recorded for Patiala:- particulate matter (PM10) suspended dust - 171 (Very bad Hazardous)
- sulfur dioxide (SO2) - 9 (Good)
- particulate matter (PM2.5) dust - 93 (Very Unhealthy)
- carbon monoxide (CO) - 2060 (Moderate)
- nitrogen dioxide (NO2) - 21 (Good)
- ozone (O3) - 28 (Good)

What is the air quality in Patiala today? Is the air polluted in Patiala?. Is there smog?
What is the level of PM10 today in Patiala? (particulate matter (PM10) suspended dust)
The current level of particulate matter PM10 in Patiala is:
171 (Very bad Hazardous)
The highest PM10 values usually occur in month: 209 (February 2019).
The lowest value of particulate matter PM10 pollution in Patiala is usually recorded in: July (41).
What is the level of SO2 pollution? (sulfur dioxide (SO2))
9 (Good)
What is the current level of PM2.5 in Patiala? (particulate matter (PM2.5) dust)
Today's PM2.5 level is:
93 (Very Unhealthy)
For comparison, the highest level of PM2.5 in Patiala in the last 7 days was: 94 (Monday, October 31, 2022) and the lowest: 94 (Monday, October 31, 2022).
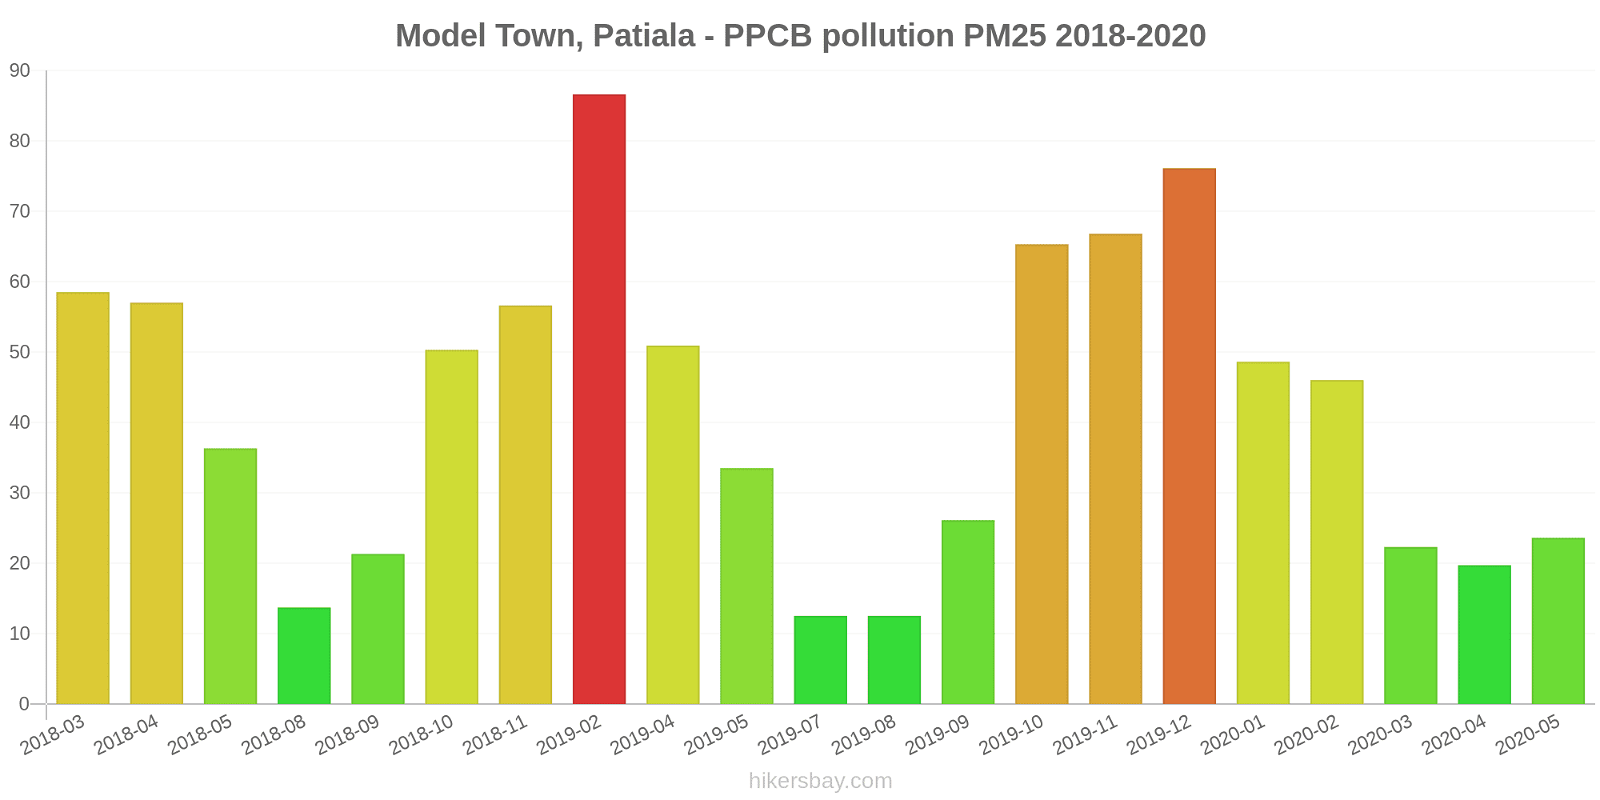
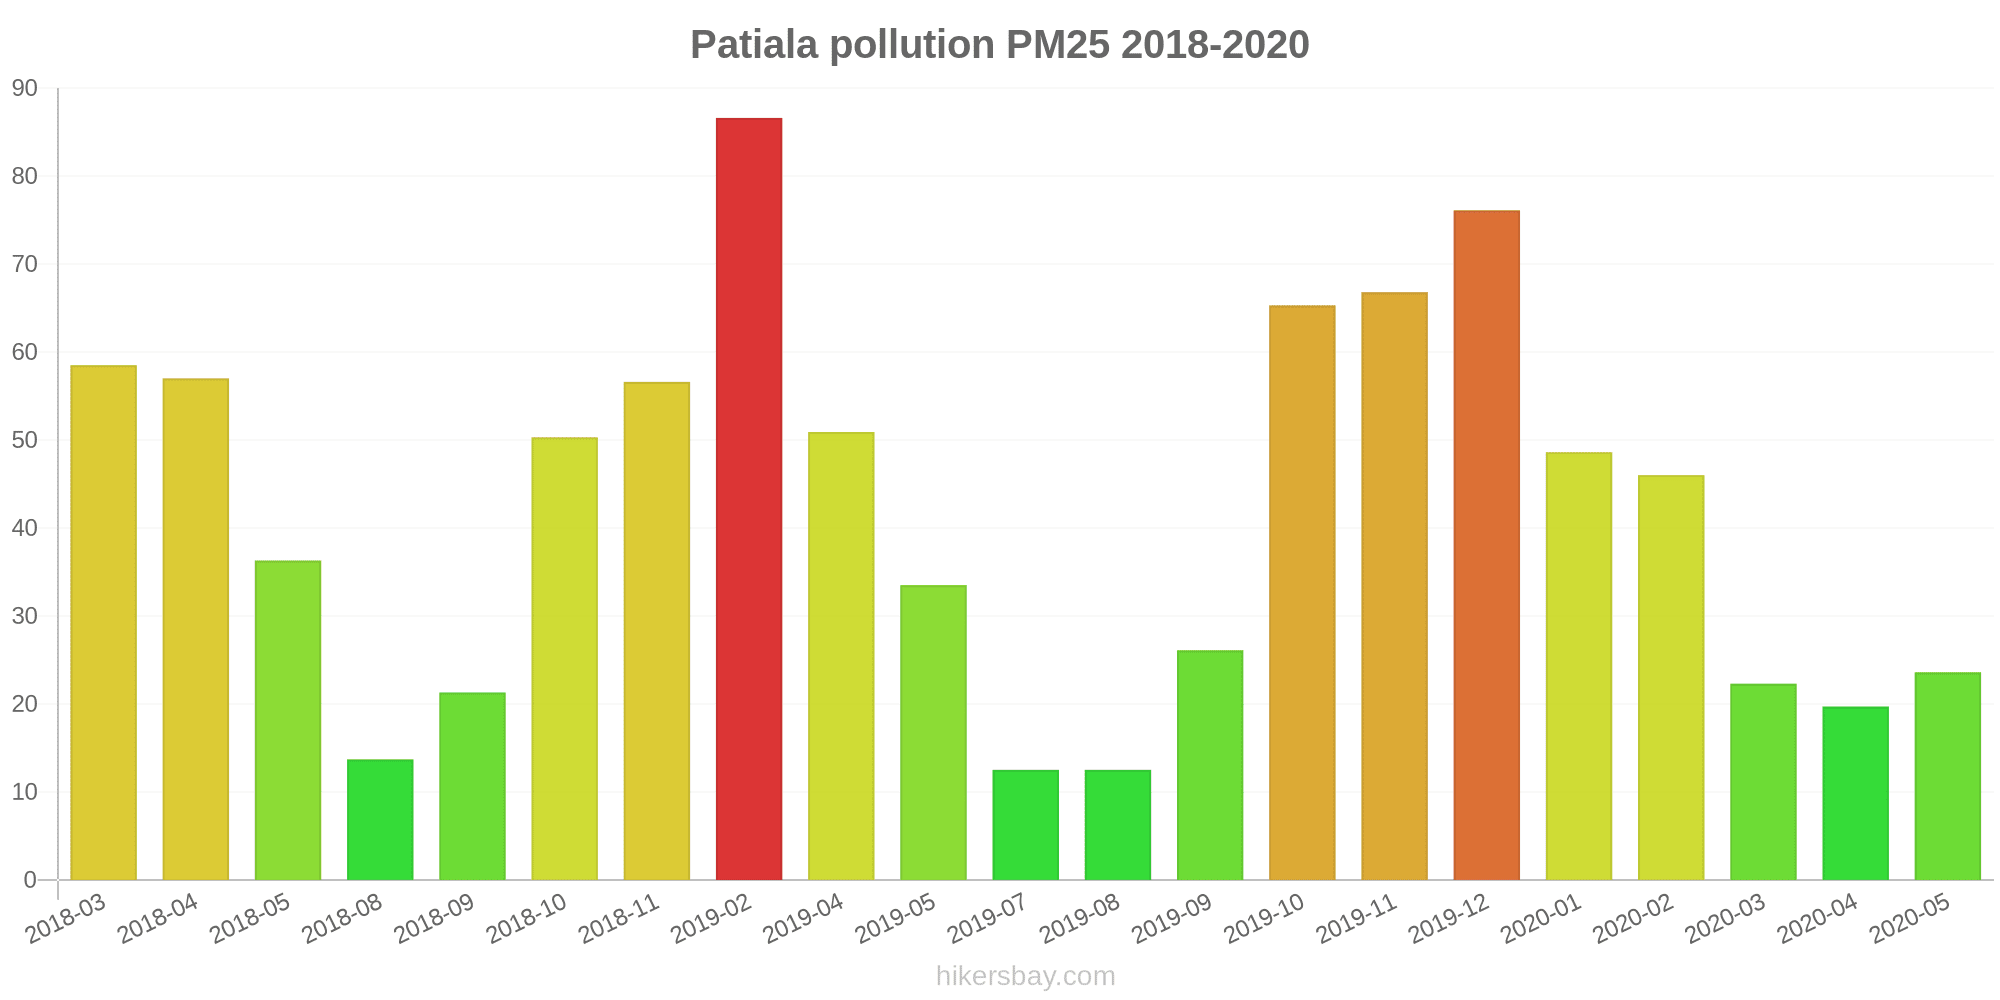
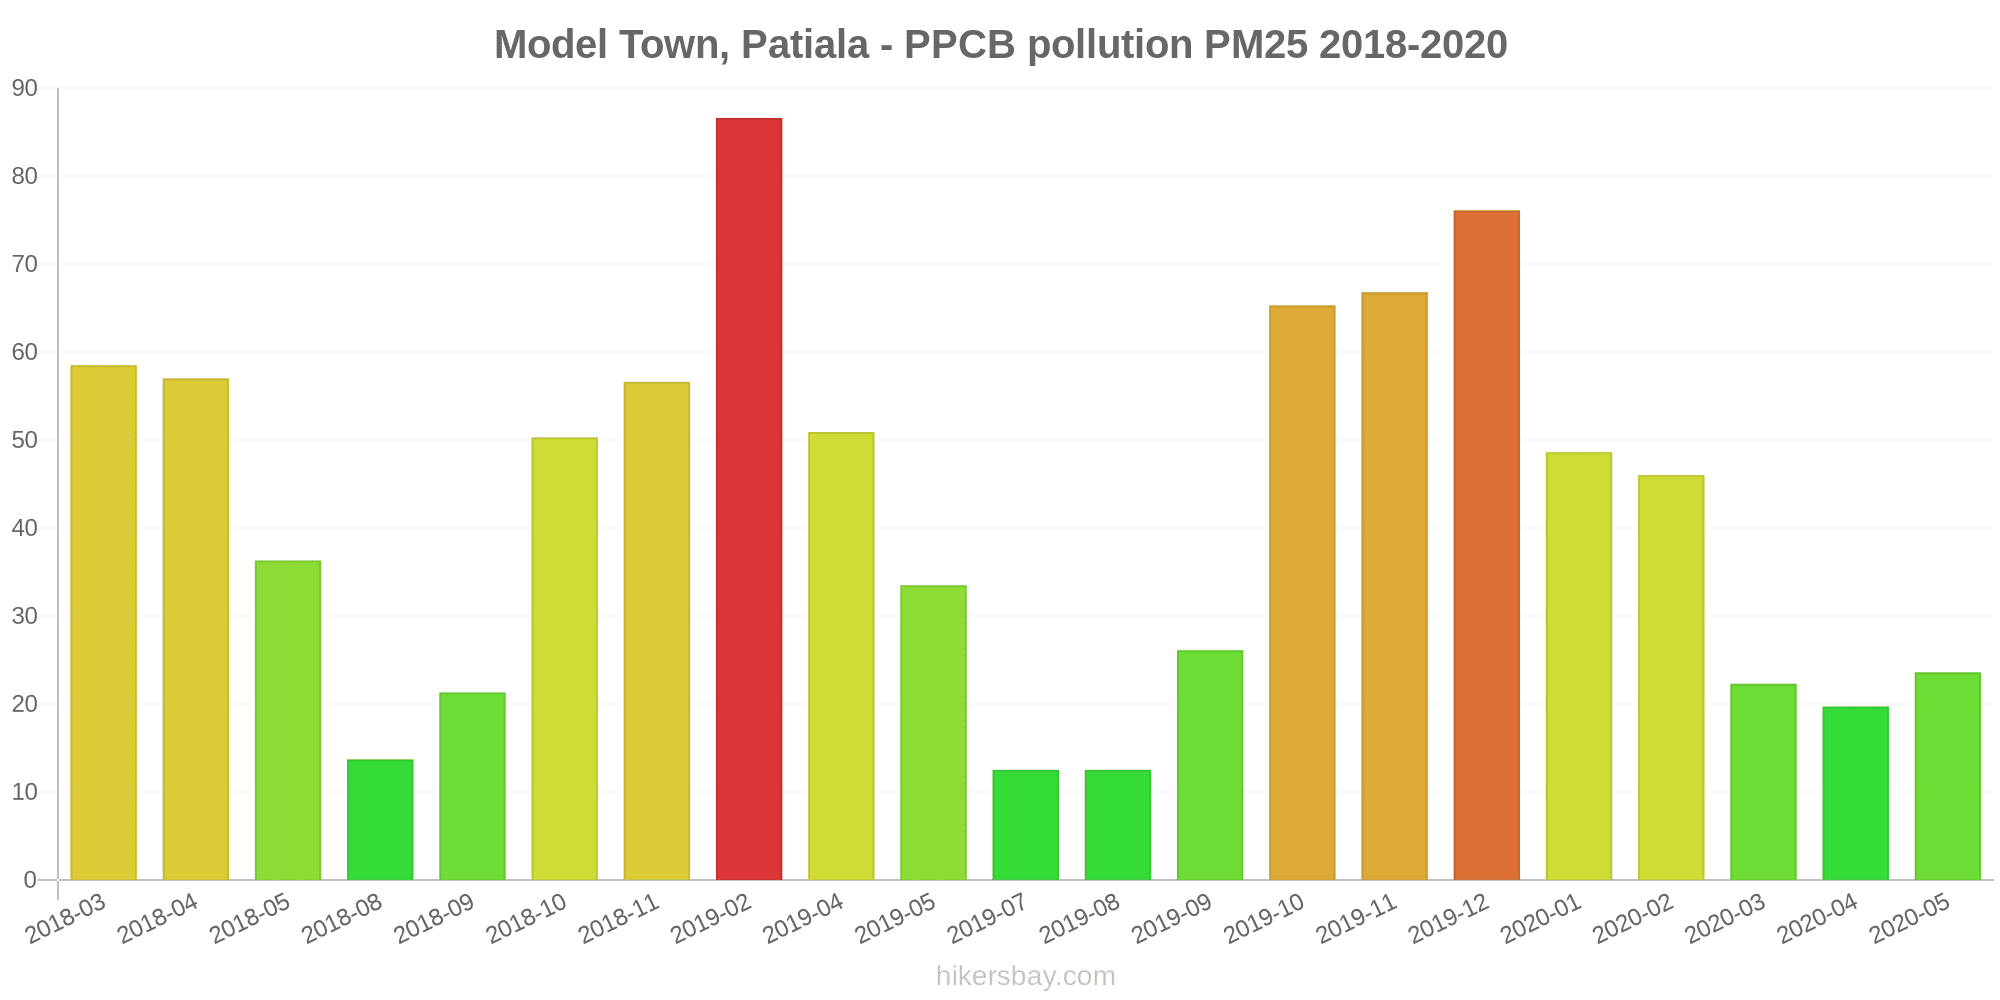
The highest PM2.5 values were recorded: 87 (February 2019).
The lowest level of particulate matter PM2.5 pollution occurs in month: August (13).
How high is the CO level? (carbon monoxide (CO))
2060 (Moderate)
How high is the level of NO2? (nitrogen dioxide (NO2))
21 (Good)
How is the O3 level today in Patiala? (ozone (O3))
28 (Good)
Current data Monday, October 31, 2022, 1:45 AM
PM10 171 (Very bad Hazardous)
SO2 9 (Good)
PM2,5 93 (Very Unhealthy)
CO 2060 (Moderate)
NO2 21 (Good)
O3 28 (Good)
Data on air pollution from recent days in Patiala
index
2022-10-31
pm10
170
Very bad Hazardous
so2
9
Good
pm25
94
Very Unhealthy
co
2045
Moderate
no2
23
Good
o3
27
Good
data source »
Air pollution in Patiala from March 2018 to May 2020

index
2020-05
2020-04
2020-03
2020-02
2020-01
2019-12
2019-11
2019-10
2019-09
2019-08
2019-07
2019-05
2019-04
2019-02
2018-11
2018-10
2018-09
2018-08
2018-05
2018-04
2018-03
pm25
24 (Moderate)
20 (Moderate)
22 (Moderate)
46 (Unhealthy for Sensitive Groups)
49 (Unhealthy for Sensitive Groups)
76 (Very Unhealthy)
67 (Unhealthy)
65 (Unhealthy)
26 (Moderate)
13 (Good)
13 (Good)
34 (Moderate)
51 (Unhealthy for Sensitive Groups)
87 (Very Unhealthy)
57 (Unhealthy)
50 (Unhealthy for Sensitive Groups)
21 (Moderate)
14 (Moderate)
36 (Unhealthy for Sensitive Groups)
57 (Unhealthy)
59 (Unhealthy)
pm10
70 (Unhealthy for Sensitive Groups)
51 (Unhealthy for Sensitive Groups)
54 (Unhealthy for Sensitive Groups)
96 (Unhealthy)
93 (Unhealthy)
138 (Very Unhealthy)
151 (Very bad Hazardous)
133 (Very Unhealthy)
74 (Unhealthy for Sensitive Groups)
44 (Moderate)
41 (Moderate)
101 (Unhealthy)
183 (Very bad Hazardous)
209 (Very bad Hazardous)
116 (Very Unhealthy)
107 (Unhealthy)
64 (Unhealthy for Sensitive Groups)
51 (Unhealthy for Sensitive Groups)
137 (Very Unhealthy)
113 (Very Unhealthy)
86 (Unhealthy)
no2
6.9 (Good)
4.3 (Good)
5.9 (Good)
6.7 (Good)
11 (Good)
18 (Good)
38 (Good)
21 (Good)
0.09 (Good)
7.5 (Good)
19 (Good)
37 (Good)
26 (Good)
23 (Good)
20 (Good)
4.8 (Good)
9.3 (Good)
11 (Good)
31 (Good)
34 (Good)
21 (Good)
so2
9.2 (Good)
5.3 (Good)
5.6 (Good)
8.2 (Good)
9.6 (Good)
18 (Good)
21 (Good)
5.9 (Good)
4.8 (Good)
3.3 (Good)
3.3 (Good)
7.7 (Good)
9.5 (Good)
5.1 (Good)
12 (Good)
7.6 (Good)
7.2 (Good)
4.5 (Good)
- (Good)
- (Good)
9.6 (Good)
co
448 (Good)
408 (Good)
694 (Good)
792 (Good)
904 (Good)
628 (Good)
454 (Good)
661 (Good)
515 (Good)
584 (Good)
430 (Good)
1 (Good)
1 (Good)
855 (Good)
1 (Good)
874 (Good)
438 (Good)
754 (Good)
945 (Good)
26 (Good)
52 (Good)
o3
22 (Good)
18 (Good)
12 (Good)
12 (Good)
7.3 (Good)
9.7 (Good)
22 (Good)
9.3 (Good)
18 (Good)
23 (Good)
27 (Good)
21 (Good)
25 (Good)
12 (Good)
5.6 (Good)
13 (Good)
17 (Good)
18 (Good)
19 (Good)
19 (Good)
21 (Good)
data source »
Quality of life in Patiala
Green and Parks in the City
Patiala
62%
Nepal: 32%
Bangladesh: 33%
Bhutan: 82%
Sri Lanka: 59%
Pakistan: 49%
particulate matter PM2.5
Patiala
100 (Very Unhealthy)
Pleasure of spending time in the city
Patiala
38%
Nepal: 32%
Bangladesh: 26%
Bhutan: 61%
Sri Lanka: 52%
Pakistan: 43%
particulate matter PM10
Patiala
180 (Very bad Hazardous)
Air Pollution
Patiala
67%
Nepal: 76%
Bangladesh: 78%
Bhutan: 45%
Sri Lanka: 53%
Pakistan: 64%
Garbage Disposal
Patiala
39%
Nepal: 25%
Bangladesh: 22%
Bhutan: 47%
Sri Lanka: 41%
Pakistan: 34%
Availability and quality of drinking water
Patiala
56%
Nepal: 36%
Bangladesh: 44%
Bhutan: 64%
Sri Lanka: 65%
Pakistan: 44%
Cleanliness and tidiness
Patiala
31%
Nepal: 27%
Bangladesh: 23%
Bhutan: 57%
Sri Lanka: 52%
Pakistan: 40%
Noise and Light pollution
Patiala
57%
Nepal: 55%
Bangladesh: 63%
Bhutan: 55%
Sri Lanka: 50%
Pakistan: 59%
Water Pollution
Patiala
69%
Nepal: 76%
Bangladesh: 74%
Bhutan: 56%
Sri Lanka: 57%
Pakistan: 70%
Source: Numbeo
Model Town, Patiala - PPCB
Monday, October 31, 2022, 1:45 AM
PM10 171 (Very bad Hazardous)
particulate matter (PM10) suspended dust
SO2 8.8 (Good)
sulfur dioxide (SO2)
PM2,5 93 (Very Unhealthy)
particulate matter (PM2.5) dust
CO 2060 (Moderate)
carbon monoxide (CO)
NO2 21 (Good)
nitrogen dioxide (NO2)
O3 28 (Good)
ozone (O3)
Model Town, Patiala - PPCB
index
2022-10-31
pm10
170
so2
8.6
pm25
94
co
2045
no2
23
o3
27
Model Town, Patiala - PPCB
2018-03 2020-05
index
2020-05
2020-04
2020-03
2020-02
2020-01
2019-12
2019-11
2019-10
2019-09
2019-08
2019-07
2019-05
2019-04
2019-02
2018-11
2018-10
2018-09
2018-08
2018-05
2018-04
2018-03
pm25
24
20
22
46
49
76
67
65
26
13
13
34
51
87
57
50
21
14
36
57
59
pm10
70
51
54
96
93
138
151
133
74
44
41
101
183
209
116
107
64
51
137
113
86
no2
6.9
4.3
5.9
6.7
11
18
38
21
0.09
7.5
19
37
26
23
20
4.8
9.3
11
31
34
21
co
448
408
694
792
904
628
454
661
515
584
430
1
1
855
1
874
438
754
945
26
52
o3
22
18
12
12
7.3
9.7
22
9.3
18
23
27
21
25
12
5.6
13
17
18
19
19
21
so2
9.2
5.3
5.6
8.2
9.6
18
21
5.9
4.8
3.3
3.3
7.7
9.5
5.1
12
7.6
7.2
4.5
-
-
9.6
* Pollution data source:
https://openaq.org
(caaqm)
The data is licensed under CC-By 4.0
PM10 171 (Very bad Hazardous)
SO2 9 (Good)
PM2,5 93 (Very Unhealthy)
CO 2060 (Moderate)
NO2 21 (Good)
O3 28 (Good)
Data on air pollution from recent days in Patiala
| index | 2022-10-31 |
|---|---|
| pm10 | 170 Very bad Hazardous |
| so2 | 9 Good |
| pm25 | 94 Very Unhealthy |
| co | 2045 Moderate |
| no2 | 23 Good |
| o3 | 27 Good |
| index | 2020-05 | 2020-04 | 2020-03 | 2020-02 | 2020-01 | 2019-12 | 2019-11 | 2019-10 | 2019-09 | 2019-08 | 2019-07 | 2019-05 | 2019-04 | 2019-02 | 2018-11 | 2018-10 | 2018-09 | 2018-08 | 2018-05 | 2018-04 | 2018-03 |
|---|---|---|---|---|---|---|---|---|---|---|---|---|---|---|---|---|---|---|---|---|---|
| pm25 | 24 (Moderate) | 20 (Moderate) | 22 (Moderate) | 46 (Unhealthy for Sensitive Groups) | 49 (Unhealthy for Sensitive Groups) | 76 (Very Unhealthy) | 67 (Unhealthy) | 65 (Unhealthy) | 26 (Moderate) | 13 (Good) | 13 (Good) | 34 (Moderate) | 51 (Unhealthy for Sensitive Groups) | 87 (Very Unhealthy) | 57 (Unhealthy) | 50 (Unhealthy for Sensitive Groups) | 21 (Moderate) | 14 (Moderate) | 36 (Unhealthy for Sensitive Groups) | 57 (Unhealthy) | 59 (Unhealthy) |
| pm10 | 70 (Unhealthy for Sensitive Groups) | 51 (Unhealthy for Sensitive Groups) | 54 (Unhealthy for Sensitive Groups) | 96 (Unhealthy) | 93 (Unhealthy) | 138 (Very Unhealthy) | 151 (Very bad Hazardous) | 133 (Very Unhealthy) | 74 (Unhealthy for Sensitive Groups) | 44 (Moderate) | 41 (Moderate) | 101 (Unhealthy) | 183 (Very bad Hazardous) | 209 (Very bad Hazardous) | 116 (Very Unhealthy) | 107 (Unhealthy) | 64 (Unhealthy for Sensitive Groups) | 51 (Unhealthy for Sensitive Groups) | 137 (Very Unhealthy) | 113 (Very Unhealthy) | 86 (Unhealthy) |
| no2 | 6.9 (Good) | 4.3 (Good) | 5.9 (Good) | 6.7 (Good) | 11 (Good) | 18 (Good) | 38 (Good) | 21 (Good) | 0.09 (Good) | 7.5 (Good) | 19 (Good) | 37 (Good) | 26 (Good) | 23 (Good) | 20 (Good) | 4.8 (Good) | 9.3 (Good) | 11 (Good) | 31 (Good) | 34 (Good) | 21 (Good) |
| so2 | 9.2 (Good) | 5.3 (Good) | 5.6 (Good) | 8.2 (Good) | 9.6 (Good) | 18 (Good) | 21 (Good) | 5.9 (Good) | 4.8 (Good) | 3.3 (Good) | 3.3 (Good) | 7.7 (Good) | 9.5 (Good) | 5.1 (Good) | 12 (Good) | 7.6 (Good) | 7.2 (Good) | 4.5 (Good) | - (Good) | - (Good) | 9.6 (Good) |
| co | 448 (Good) | 408 (Good) | 694 (Good) | 792 (Good) | 904 (Good) | 628 (Good) | 454 (Good) | 661 (Good) | 515 (Good) | 584 (Good) | 430 (Good) | 1 (Good) | 1 (Good) | 855 (Good) | 1 (Good) | 874 (Good) | 438 (Good) | 754 (Good) | 945 (Good) | 26 (Good) | 52 (Good) |
| o3 | 22 (Good) | 18 (Good) | 12 (Good) | 12 (Good) | 7.3 (Good) | 9.7 (Good) | 22 (Good) | 9.3 (Good) | 18 (Good) | 23 (Good) | 27 (Good) | 21 (Good) | 25 (Good) | 12 (Good) | 5.6 (Good) | 13 (Good) | 17 (Good) | 18 (Good) | 19 (Good) | 19 (Good) | 21 (Good) |
Green and Parks in the City
Patiala 62%
Nepal: 32% Bangladesh: 33% Bhutan: 82% Sri Lanka: 59% Pakistan: 49%particulate matter PM2.5
Patiala 100 (Very Unhealthy)
Pleasure of spending time in the city
Patiala 38%
Nepal: 32% Bangladesh: 26% Bhutan: 61% Sri Lanka: 52% Pakistan: 43%particulate matter PM10
Patiala 180 (Very bad Hazardous)
Air Pollution
Patiala 67%
Nepal: 76% Bangladesh: 78% Bhutan: 45% Sri Lanka: 53% Pakistan: 64%Garbage Disposal
Patiala 39%
Nepal: 25% Bangladesh: 22% Bhutan: 47% Sri Lanka: 41% Pakistan: 34%Availability and quality of drinking water
Patiala 56%
Nepal: 36% Bangladesh: 44% Bhutan: 64% Sri Lanka: 65% Pakistan: 44%Cleanliness and tidiness
Patiala 31%
Nepal: 27% Bangladesh: 23% Bhutan: 57% Sri Lanka: 52% Pakistan: 40%Noise and Light pollution
Patiala 57%
Nepal: 55% Bangladesh: 63% Bhutan: 55% Sri Lanka: 50% Pakistan: 59%Water Pollution
Patiala 69%
Nepal: 76% Bangladesh: 74% Bhutan: 56% Sri Lanka: 57% Pakistan: 70%PM10 171 (Very bad Hazardous)
particulate matter (PM10) suspended dustSO2 8.8 (Good)
sulfur dioxide (SO2)PM2,5 93 (Very Unhealthy)
particulate matter (PM2.5) dustCO 2060 (Moderate)
carbon monoxide (CO)NO2 21 (Good)
nitrogen dioxide (NO2)O3 28 (Good)
ozone (O3)Model Town, Patiala - PPCB
| index | 2022-10-31 |
|---|---|
| pm10 | 170 |
| so2 | 8.6 |
| pm25 | 94 |
| co | 2045 |
| no2 | 23 |
| o3 | 27 |
Model Town, Patiala - PPCB
| index | 2020-05 | 2020-04 | 2020-03 | 2020-02 | 2020-01 | 2019-12 | 2019-11 | 2019-10 | 2019-09 | 2019-08 | 2019-07 | 2019-05 | 2019-04 | 2019-02 | 2018-11 | 2018-10 | 2018-09 | 2018-08 | 2018-05 | 2018-04 | 2018-03 |
|---|---|---|---|---|---|---|---|---|---|---|---|---|---|---|---|---|---|---|---|---|---|
| pm25 | 24 | 20 | 22 | 46 | 49 | 76 | 67 | 65 | 26 | 13 | 13 | 34 | 51 | 87 | 57 | 50 | 21 | 14 | 36 | 57 | 59 |
| pm10 | 70 | 51 | 54 | 96 | 93 | 138 | 151 | 133 | 74 | 44 | 41 | 101 | 183 | 209 | 116 | 107 | 64 | 51 | 137 | 113 | 86 |
| no2 | 6.9 | 4.3 | 5.9 | 6.7 | 11 | 18 | 38 | 21 | 0.09 | 7.5 | 19 | 37 | 26 | 23 | 20 | 4.8 | 9.3 | 11 | 31 | 34 | 21 |
| co | 448 | 408 | 694 | 792 | 904 | 628 | 454 | 661 | 515 | 584 | 430 | 1 | 1 | 855 | 1 | 874 | 438 | 754 | 945 | 26 | 52 |
| o3 | 22 | 18 | 12 | 12 | 7.3 | 9.7 | 22 | 9.3 | 18 | 23 | 27 | 21 | 25 | 12 | 5.6 | 13 | 17 | 18 | 19 | 19 | 21 |
| so2 | 9.2 | 5.3 | 5.6 | 8.2 | 9.6 | 18 | 21 | 5.9 | 4.8 | 3.3 | 3.3 | 7.7 | 9.5 | 5.1 | 12 | 7.6 | 7.2 | 4.5 | - | - | 9.6 |