Air Pollution in Raisen: Real-time Air Quality Index and smog alert.
Pollution and air quality forecast for Raisen. Today is Wednesday, May 13, 2026. The following air pollution values have been recorded for Raisen:- particulate matter (PM2.5) dust - 88 (Very Unhealthy)
- particulate matter (PM10) suspended dust - 350 (Very bad Hazardous)
- nitrogen dioxide (NO2) - 109 (Unhealthy for Sensitive Groups)
- carbon monoxide (CO) - 1750 (Good)
- ozone (O3) - 14 (Good)
- sulfur dioxide (SO2) - 74 (Moderate)

What is the air quality in Raisen today? Is the air polluted in Raisen?. Is there smog?
What is the current level of PM2.5 in Raisen? (particulate matter (PM2.5) dust)
Today's PM2.5 level is:
88 (Very Unhealthy)
For comparison, the highest level of PM2.5 in Raisen in the last 7 days was: 88 (Monday, October 31, 2022) and the lowest: 88 (Monday, October 31, 2022).
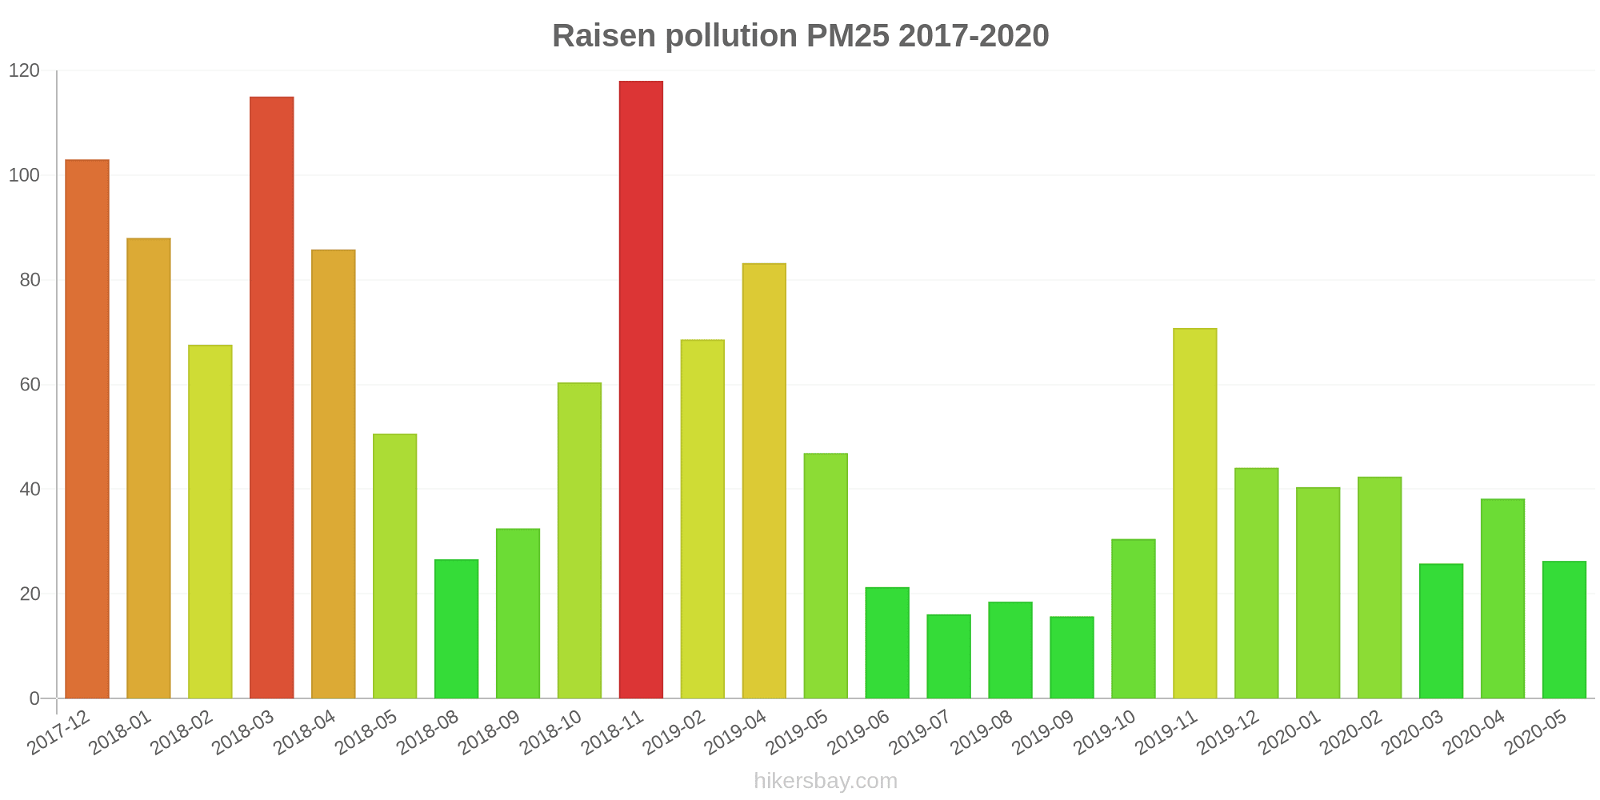
The highest PM2.5 values were recorded: 118 (November 2018).
The lowest level of particulate matter PM2.5 pollution occurs in month: September (16).
What is the level of PM10 today in Raisen? (particulate matter (PM10) suspended dust)
The current level of particulate matter PM10 in Raisen is:
350 (Very bad Hazardous)
The highest PM10 values usually occur in month: 304 (November 2019).
The lowest value of particulate matter PM10 pollution in Raisen is usually recorded in: May (46).
How high is the level of NO2? (nitrogen dioxide (NO2))
109 (Unhealthy for Sensitive Groups)
How high is the CO level? (carbon monoxide (CO))
1750 (Good)
How is the O3 level today in Raisen? (ozone (O3))
14 (Good)
What is the level of SO2 pollution? (sulfur dioxide (SO2))
74 (Moderate)
Current data Monday, October 31, 2022, 2:00 AM
PM2,5 88 (Very Unhealthy)
PM10 350 (Very bad Hazardous)
NO2 109 (Unhealthy for Sensitive Groups)
CO 1750 (Good)
O3 14 (Good)
SO2 74 (Moderate)
Data on air pollution from recent days in Raisen
index
2022-10-31
pm25
88
Very Unhealthy
pm10
350
Very bad Hazardous
no2
109
Unhealthy for Sensitive Groups
co
1750
Good
o3
14
Good
so2
74
Moderate
data source »
Air pollution in Raisen from December 2017 to May 2020
index
2020-05
2020-04
2020-03
2020-02
2020-01
2019-12
2019-11
2019-10
2019-09
2019-08
2019-07
2019-06
2019-05
2019-04
2019-02
2018-11
2018-10
2018-09
2018-08
2018-05
2018-04
2018-03
2018-02
2018-01
2017-12
pm25
26 (Moderate)
38 (Unhealthy for Sensitive Groups)
26 (Moderate)
42 (Unhealthy for Sensitive Groups)
40 (Unhealthy for Sensitive Groups)
44 (Unhealthy for Sensitive Groups)
71 (Unhealthy)
31 (Moderate)
16 (Moderate)
19 (Moderate)
16 (Moderate)
21 (Moderate)
47 (Unhealthy for Sensitive Groups)
83 (Very Unhealthy)
69 (Unhealthy)
118 (Very bad Hazardous)
60 (Unhealthy)
33 (Moderate)
27 (Moderate)
51 (Unhealthy for Sensitive Groups)
86 (Very Unhealthy)
115 (Very bad Hazardous)
68 (Unhealthy)
88 (Very Unhealthy)
103 (Very Unhealthy)
pm10
46 (Moderate)
63 (Unhealthy for Sensitive Groups)
74 (Unhealthy for Sensitive Groups)
129 (Very Unhealthy)
124 (Very Unhealthy)
176 (Very bad Hazardous)
304 (Very bad Hazardous)
144 (Very Unhealthy)
50 (Moderate)
55 (Unhealthy for Sensitive Groups)
72 (Unhealthy for Sensitive Groups)
91 (Unhealthy)
271 (Very bad Hazardous)
264 (Very bad Hazardous)
183 (Very bad Hazardous)
279 (Very bad Hazardous)
189 (Very bad Hazardous)
104 (Unhealthy)
48 (Moderate)
253 (Very bad Hazardous)
223 (Very bad Hazardous)
182 (Very bad Hazardous)
184 (Very bad Hazardous)
200 (Very bad Hazardous)
201 (Very bad Hazardous)
no2
13 (Good)
15 (Good)
18 (Good)
28 (Good)
22 (Good)
28 (Good)
40 (Good)
19 (Good)
12 (Good)
10 (Good)
13 (Good)
14 (Good)
23 (Good)
54 (Moderate)
9.9 (Good)
35 (Good)
21 (Good)
14 (Good)
7.3 (Good)
17 (Good)
25 (Good)
28 (Good)
22 (Good)
5.2 (Good)
32 (Good)
so2
9.4 (Good)
9.8 (Good)
8.6 (Good)
16 (Good)
16 (Good)
29 (Good)
34 (Good)
22 (Good)
14 (Good)
14 (Good)
14 (Good)
14 (Good)
21 (Good)
43 (Good)
46 (Good)
27 (Good)
16 (Good)
9.9 (Good)
8.8 (Good)
24 (Good)
32 (Good)
27 (Good)
27 (Good)
25 (Good)
70 (Moderate)
co
499 (Good)
658 (Good)
576 (Good)
901 (Good)
958 (Good)
955 (Good)
1 (Good)
689 (Good)
598 (Good)
538 (Good)
805 (Good)
429 (Good)
604 (Good)
1 (Good)
644 (Good)
1 (Good)
471 (Good)
442 (Good)
462 (Good)
1 (Good)
47 (Good)
85 (Good)
2 (Good)
2 (Good)
2 (Good)
o3
19 (Good)
19 (Good)
19 (Good)
18 (Good)
20 (Good)
37 (Good)
30 (Good)
25 (Good)
20 (Good)
19 (Good)
30 (Good)
47 (Good)
65 (Good)
30 (Good)
81 (Moderate)
54 (Good)
52 (Good)
44 (Good)
38 (Good)
45 (Good)
36 (Good)
33 (Good)
35 (Good)
51 (Good)
56 (Good)
data source »
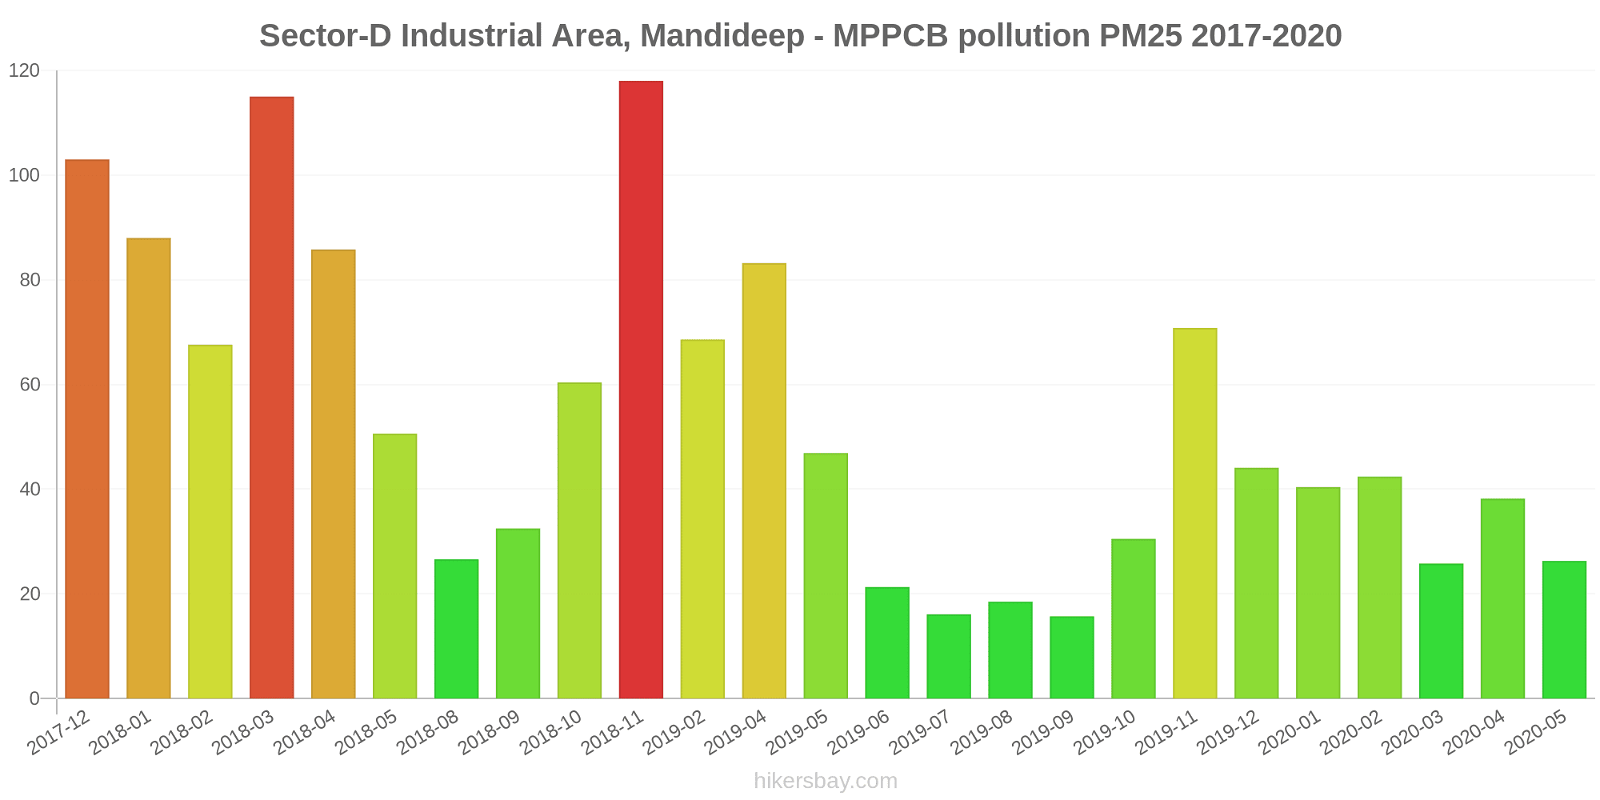
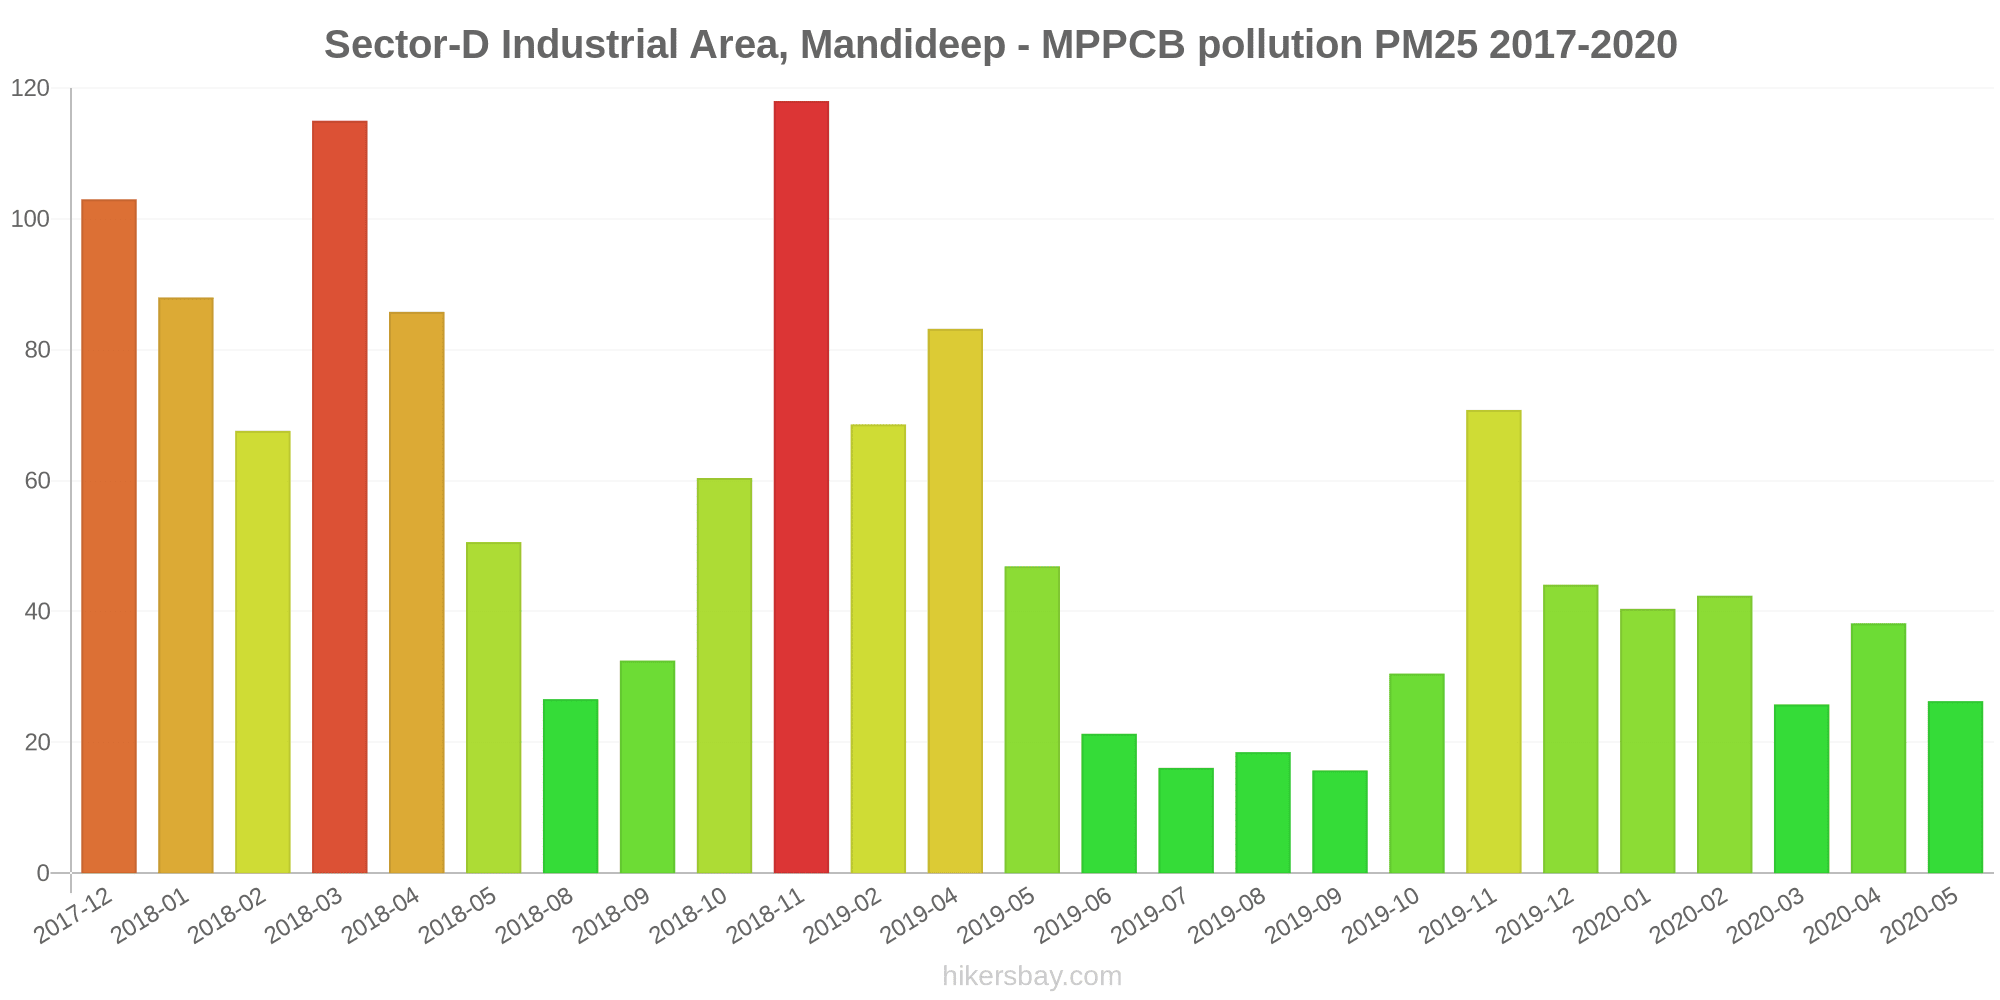
Sector-D Industrial Area, Mandideep - MPPCB
Monday, October 31, 2022, 2:00 AM
PM2,5 88 (Very Unhealthy)
particulate matter (PM2.5) dust
PM10 350 (Very bad Hazardous)
particulate matter (PM10) suspended dust
NO2 109 (Unhealthy for Sensitive Groups)
nitrogen dioxide (NO2)
CO 1750 (Good)
carbon monoxide (CO)
O3 14 (Good)
ozone (O3)
SO2 74 (Moderate)
sulfur dioxide (SO2)
Sector-D Industrial Area, Mandideep - MPPCB
index
2022-10-31
pm25
88
pm10
350
no2
109
co
1750
o3
14
so2
74
Sector-D Industrial Area, Mandideep - MPPCB
2017-12 2020-05
index
2020-05
2020-04
2020-03
2020-02
2020-01
2019-12
2019-11
2019-10
2019-09
2019-08
2019-07
2019-06
2019-05
2019-04
2019-02
2018-11
2018-10
2018-09
2018-08
2018-05
2018-04
2018-03
2018-02
2018-01
2017-12
no2
13
15
18
28
22
28
40
19
12
10
13
14
23
54
9.9
35
21
14
7.3
17
25
28
22
5.2
32
so2
9.4
9.8
8.6
16
16
29
34
22
14
14
14
14
21
43
46
27
16
9.9
8.8
24
32
27
27
25
70
co
499
658
576
901
958
955
1
689
598
538
805
429
604
1
644
1
471
442
462
1
47
85
2
2
2
o3
19
19
19
18
20
37
30
25
20
19
30
47
65
30
81
54
52
44
38
45
36
33
35
51
56
pm25
26
38
26
42
40
44
71
31
16
19
16
21
47
83
69
118
60
33
27
51
86
115
68
88
103
pm10
46
63
74
129
124
176
304
144
50
55
72
91
271
264
183
279
189
104
48
253
223
182
184
200
201
* Pollution data source:
https://openaq.org
(caaqm)
The data is licensed under CC-By 4.0
PM2,5 88 (Very Unhealthy)
PM10 350 (Very bad Hazardous)
NO2 109 (Unhealthy for Sensitive Groups)
CO 1750 (Good)
O3 14 (Good)
SO2 74 (Moderate)
Data on air pollution from recent days in Raisen
| index | 2022-10-31 |
|---|---|
| pm25 | 88 Very Unhealthy |
| pm10 | 350 Very bad Hazardous |
| no2 | 109 Unhealthy for Sensitive Groups |
| co | 1750 Good |
| o3 | 14 Good |
| so2 | 74 Moderate |

| index | 2020-05 | 2020-04 | 2020-03 | 2020-02 | 2020-01 | 2019-12 | 2019-11 | 2019-10 | 2019-09 | 2019-08 | 2019-07 | 2019-06 | 2019-05 | 2019-04 | 2019-02 | 2018-11 | 2018-10 | 2018-09 | 2018-08 | 2018-05 | 2018-04 | 2018-03 | 2018-02 | 2018-01 | 2017-12 |
|---|---|---|---|---|---|---|---|---|---|---|---|---|---|---|---|---|---|---|---|---|---|---|---|---|---|
| pm25 | 26 (Moderate) | 38 (Unhealthy for Sensitive Groups) | 26 (Moderate) | 42 (Unhealthy for Sensitive Groups) | 40 (Unhealthy for Sensitive Groups) | 44 (Unhealthy for Sensitive Groups) | 71 (Unhealthy) | 31 (Moderate) | 16 (Moderate) | 19 (Moderate) | 16 (Moderate) | 21 (Moderate) | 47 (Unhealthy for Sensitive Groups) | 83 (Very Unhealthy) | 69 (Unhealthy) | 118 (Very bad Hazardous) | 60 (Unhealthy) | 33 (Moderate) | 27 (Moderate) | 51 (Unhealthy for Sensitive Groups) | 86 (Very Unhealthy) | 115 (Very bad Hazardous) | 68 (Unhealthy) | 88 (Very Unhealthy) | 103 (Very Unhealthy) |
| pm10 | 46 (Moderate) | 63 (Unhealthy for Sensitive Groups) | 74 (Unhealthy for Sensitive Groups) | 129 (Very Unhealthy) | 124 (Very Unhealthy) | 176 (Very bad Hazardous) | 304 (Very bad Hazardous) | 144 (Very Unhealthy) | 50 (Moderate) | 55 (Unhealthy for Sensitive Groups) | 72 (Unhealthy for Sensitive Groups) | 91 (Unhealthy) | 271 (Very bad Hazardous) | 264 (Very bad Hazardous) | 183 (Very bad Hazardous) | 279 (Very bad Hazardous) | 189 (Very bad Hazardous) | 104 (Unhealthy) | 48 (Moderate) | 253 (Very bad Hazardous) | 223 (Very bad Hazardous) | 182 (Very bad Hazardous) | 184 (Very bad Hazardous) | 200 (Very bad Hazardous) | 201 (Very bad Hazardous) |
| no2 | 13 (Good) | 15 (Good) | 18 (Good) | 28 (Good) | 22 (Good) | 28 (Good) | 40 (Good) | 19 (Good) | 12 (Good) | 10 (Good) | 13 (Good) | 14 (Good) | 23 (Good) | 54 (Moderate) | 9.9 (Good) | 35 (Good) | 21 (Good) | 14 (Good) | 7.3 (Good) | 17 (Good) | 25 (Good) | 28 (Good) | 22 (Good) | 5.2 (Good) | 32 (Good) |
| so2 | 9.4 (Good) | 9.8 (Good) | 8.6 (Good) | 16 (Good) | 16 (Good) | 29 (Good) | 34 (Good) | 22 (Good) | 14 (Good) | 14 (Good) | 14 (Good) | 14 (Good) | 21 (Good) | 43 (Good) | 46 (Good) | 27 (Good) | 16 (Good) | 9.9 (Good) | 8.8 (Good) | 24 (Good) | 32 (Good) | 27 (Good) | 27 (Good) | 25 (Good) | 70 (Moderate) |
| co | 499 (Good) | 658 (Good) | 576 (Good) | 901 (Good) | 958 (Good) | 955 (Good) | 1 (Good) | 689 (Good) | 598 (Good) | 538 (Good) | 805 (Good) | 429 (Good) | 604 (Good) | 1 (Good) | 644 (Good) | 1 (Good) | 471 (Good) | 442 (Good) | 462 (Good) | 1 (Good) | 47 (Good) | 85 (Good) | 2 (Good) | 2 (Good) | 2 (Good) |
| o3 | 19 (Good) | 19 (Good) | 19 (Good) | 18 (Good) | 20 (Good) | 37 (Good) | 30 (Good) | 25 (Good) | 20 (Good) | 19 (Good) | 30 (Good) | 47 (Good) | 65 (Good) | 30 (Good) | 81 (Moderate) | 54 (Good) | 52 (Good) | 44 (Good) | 38 (Good) | 45 (Good) | 36 (Good) | 33 (Good) | 35 (Good) | 51 (Good) | 56 (Good) |
PM2,5 88 (Very Unhealthy)
particulate matter (PM2.5) dustPM10 350 (Very bad Hazardous)
particulate matter (PM10) suspended dustNO2 109 (Unhealthy for Sensitive Groups)
nitrogen dioxide (NO2)CO 1750 (Good)
carbon monoxide (CO)O3 14 (Good)
ozone (O3)SO2 74 (Moderate)
sulfur dioxide (SO2)Sector-D Industrial Area, Mandideep - MPPCB
| index | 2022-10-31 |
|---|---|
| pm25 | 88 |
| pm10 | 350 |
| no2 | 109 |
| co | 1750 |
| o3 | 14 |
| so2 | 74 |
Sector-D Industrial Area, Mandideep - MPPCB
| index | 2020-05 | 2020-04 | 2020-03 | 2020-02 | 2020-01 | 2019-12 | 2019-11 | 2019-10 | 2019-09 | 2019-08 | 2019-07 | 2019-06 | 2019-05 | 2019-04 | 2019-02 | 2018-11 | 2018-10 | 2018-09 | 2018-08 | 2018-05 | 2018-04 | 2018-03 | 2018-02 | 2018-01 | 2017-12 |
|---|---|---|---|---|---|---|---|---|---|---|---|---|---|---|---|---|---|---|---|---|---|---|---|---|---|
| no2 | 13 | 15 | 18 | 28 | 22 | 28 | 40 | 19 | 12 | 10 | 13 | 14 | 23 | 54 | 9.9 | 35 | 21 | 14 | 7.3 | 17 | 25 | 28 | 22 | 5.2 | 32 |
| so2 | 9.4 | 9.8 | 8.6 | 16 | 16 | 29 | 34 | 22 | 14 | 14 | 14 | 14 | 21 | 43 | 46 | 27 | 16 | 9.9 | 8.8 | 24 | 32 | 27 | 27 | 25 | 70 |
| co | 499 | 658 | 576 | 901 | 958 | 955 | 1 | 689 | 598 | 538 | 805 | 429 | 604 | 1 | 644 | 1 | 471 | 442 | 462 | 1 | 47 | 85 | 2 | 2 | 2 |
| o3 | 19 | 19 | 19 | 18 | 20 | 37 | 30 | 25 | 20 | 19 | 30 | 47 | 65 | 30 | 81 | 54 | 52 | 44 | 38 | 45 | 36 | 33 | 35 | 51 | 56 |
| pm25 | 26 | 38 | 26 | 42 | 40 | 44 | 71 | 31 | 16 | 19 | 16 | 21 | 47 | 83 | 69 | 118 | 60 | 33 | 27 | 51 | 86 | 115 | 68 | 88 | 103 |
| pm10 | 46 | 63 | 74 | 129 | 124 | 176 | 304 | 144 | 50 | 55 | 72 | 91 | 271 | 264 | 183 | 279 | 189 | 104 | 48 | 253 | 223 | 182 | 184 | 200 | 201 |