Air Pollution in Sonipat: Real-time Air Quality Index and smog alert.
Pollution and air quality forecast for Sonipat. Today is Wednesday, May 13, 2026. The following air pollution values have been recorded for Sonipat:- carbon monoxide (CO) - 470 (Good)
- sulfur dioxide (SO2) - 15 (Good)
- particulate matter (PM2.5) dust - 44 (Unhealthy for Sensitive Groups)
- ozone (O3) - 35 (Good)
- particulate matter (PM10) suspended dust - 218 (Very bad Hazardous)
- nitrogen dioxide (NO2) - 20 (Good)

What is the air quality in Sonipat today? Is the air polluted in Sonipat?. Is there smog?
How high is the CO level? (carbon monoxide (CO))
470 (Good)
What is the level of SO2 pollution? (sulfur dioxide (SO2))
15 (Good)
What is the current level of PM2.5 in Sonipat? (particulate matter (PM2.5) dust)
Today's PM2.5 level is:
44 (Unhealthy for Sensitive Groups)
For comparison, the highest level of PM2.5 in Sonipat in the last 7 days was: 54 (Friday, October 14, 2022) and the lowest: 5 (Monday, October 10, 2022).
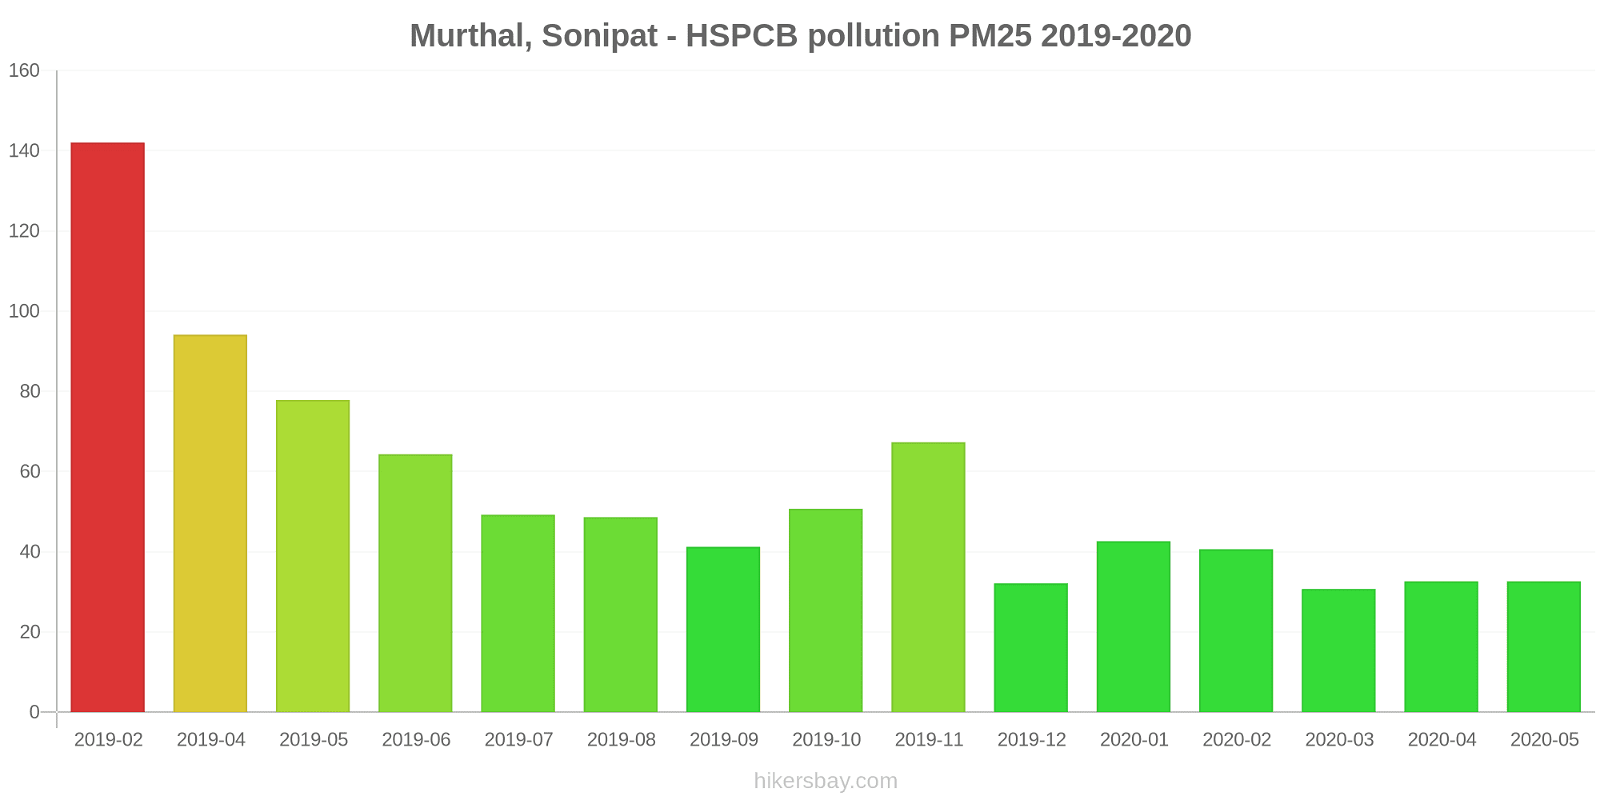
The highest PM2.5 values were recorded: 142 (February 2019).
The lowest level of particulate matter PM2.5 pollution occurs in month: March (31).
How is the O3 level today in Sonipat? (ozone (O3))
35 (Good)
What is the level of PM10 today in Sonipat? (particulate matter (PM10) suspended dust)
The current level of particulate matter PM10 in Sonipat is:
218 (Very bad Hazardous)
The highest PM10 values usually occur in month: 279 (April 2019).
The lowest value of particulate matter PM10 pollution in Sonipat is usually recorded in: August (92).
How high is the level of NO2? (nitrogen dioxide (NO2))
20 (Good)
Current data Friday, October 14, 2022, 6:00 AM
CO 470 (Good)
SO2 15 (Good)
PM2,5 44 (Unhealthy for Sensitive Groups)
O3 35 (Good)
PM10 218 (Very bad Hazardous)
NO2 20 (Good)
Data on air pollution from recent days in Sonipat
index
2022-10-07
2022-10-08
2022-10-09
2022-10-10
2022-10-11
2022-10-12
2022-10-13
2022-10-14
pm25
12
Good
8
Good
6
Good
5
Good
20
Moderate
30
Moderate
26
Moderate
54
Unhealthy for Sensitive Groups
co
32
Good
59
Good
31
Good
56
Good
281
Good
548
Good
445
Good
730
Good
no2
17
Good
16
Good
17
Good
17
Good
18
Good
17
Good
18
Good
20
Good
o3
26
Good
27
Good
26
Good
26
Good
24
Good
26
Good
26
Good
25
Good
pm10
49
Moderate
25
Moderate
24
Moderate
20
Moderate
78
Unhealthy for Sensitive Groups
95
Unhealthy
16
Good
77
Unhealthy for Sensitive Groups
so2
15
Good
16
Good
16
Good
15
Good
16
Good
15
Good
16
Good
16
Good
data source »
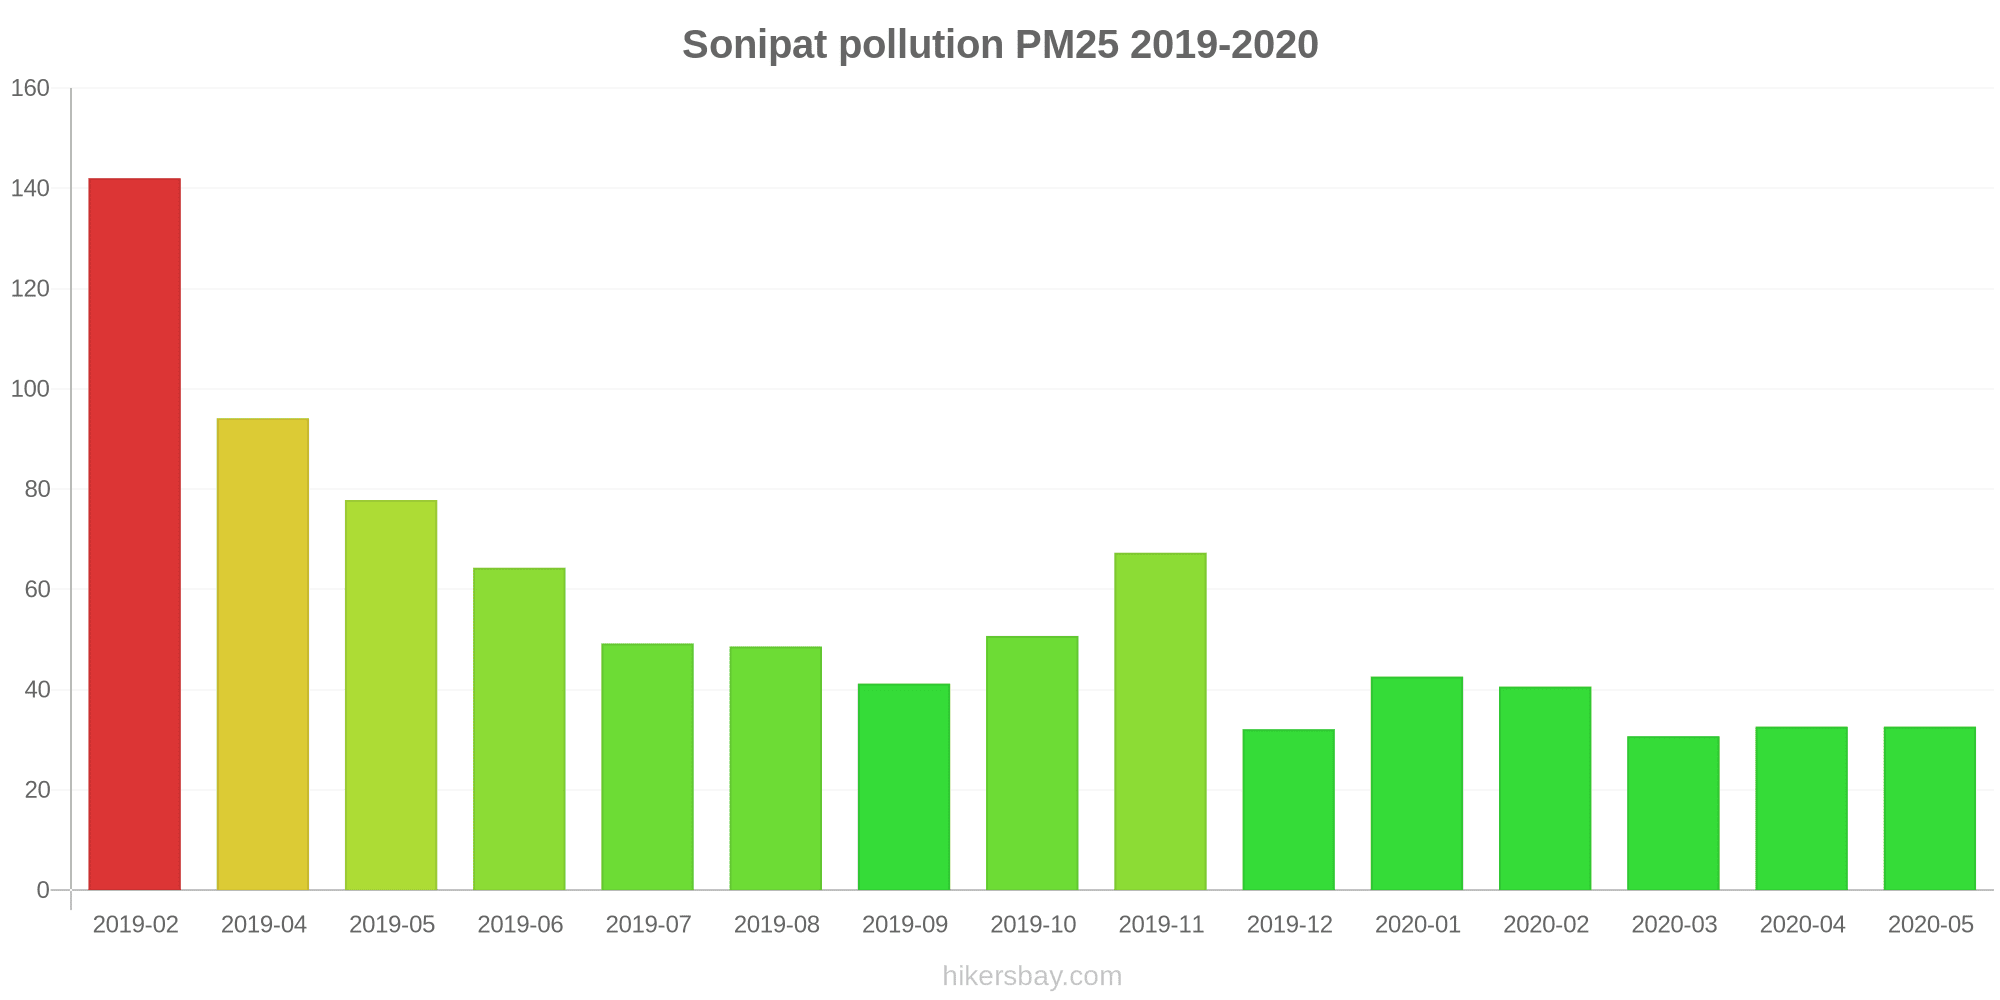
Air pollution in Sonipat from February 2019 to May 2020

index
2020-05
2020-04
2020-03
2020-02
2020-01
2019-12
2019-11
2019-10
2019-09
2019-08
2019-07
2019-06
2019-05
2019-04
2019-02
pm25
33 (Moderate)
33 (Moderate)
31 (Moderate)
41 (Unhealthy for Sensitive Groups)
43 (Unhealthy for Sensitive Groups)
32 (Moderate)
67 (Unhealthy)
51 (Unhealthy for Sensitive Groups)
41 (Unhealthy for Sensitive Groups)
49 (Unhealthy for Sensitive Groups)
49 (Unhealthy for Sensitive Groups)
64 (Unhealthy)
78 (Very Unhealthy)
94 (Very Unhealthy)
142 (Very bad Hazardous)
pm10
141 (Very Unhealthy)
127 (Very Unhealthy)
118 (Very Unhealthy)
178 (Very bad Hazardous)
170 (Very bad Hazardous)
142 (Very Unhealthy)
129 (Very Unhealthy)
153 (Very bad Hazardous)
95 (Unhealthy)
92 (Unhealthy)
142 (Very Unhealthy)
196 (Very bad Hazardous)
172 (Very bad Hazardous)
279 (Very bad Hazardous)
185 (Very bad Hazardous)
no2
97 (Moderate)
50 (Moderate)
57 (Moderate)
38 (Good)
40 (Good)
29 (Good)
18 (Good)
11 (Good)
23 (Good)
12 (Good)
12 (Good)
18 (Good)
30 (Good)
26 (Good)
41 (Moderate)
so2
80 (Moderate)
51 (Moderate)
76 (Moderate)
65 (Moderate)
55 (Moderate)
72 (Moderate)
95 (Moderate)
36 (Good)
30 (Good)
26 (Good)
31 (Good)
39 (Good)
34 (Good)
42 (Good)
13 (Good)
co
674 (Good)
888 (Good)
1 (Good)
780 (Good)
2 (Good)
2 (Good)
1 (Good)
944 (Good)
1 (Good)
1 (Good)
487 (Good)
483 (Good)
619 (Good)
540 (Good)
3 (Good)
o3
18 (Good)
15 (Good)
19 (Good)
13 (Good)
7.2 (Good)
8.6 (Good)
13 (Good)
30 (Good)
40 (Good)
50 (Good)
56 (Good)
70 (Good)
374 (Very bad Hazardous)
67 (Good)
46 (Good)
data source »
Murthal, Sonipat - HSPCB
Friday, October 14, 2022, 6:00 AM
CO 470 (Good)
carbon monoxide (CO)
SO2 15 (Good)
sulfur dioxide (SO2)
PM2,5 44 (Unhealthy for Sensitive Groups)
particulate matter (PM2.5) dust
O3 35 (Good)
ozone (O3)
PM10 218 (Very bad Hazardous)
particulate matter (PM10) suspended dust
NO2 20 (Good)
nitrogen dioxide (NO2)
Murthal, Sonipat - HSPCB
index
2022-10-14
2022-10-13
2022-10-12
2022-10-11
2022-10-10
2022-10-09
2022-10-08
2022-10-07
pm25
54
26
30
20
4.8
5.8
8.1
12
co
730
445
548
281
56
31
59
32
no2
20
18
17
18
17
17
16
17
o3
25
26
26
24
26
26
27
26
pm10
77
16
95
78
20
24
25
49
so2
16
16
15
16
15
16
16
15
Murthal, Sonipat - HSPCB
2019-02 2020-05
index
2020-05
2020-04
2020-03
2020-02
2020-01
2019-12
2019-11
2019-10
2019-09
2019-08
2019-07
2019-06
2019-05
2019-04
2019-02
pm25
33
33
31
41
43
32
67
51
41
49
49
64
78
94
142
pm10
141
127
118
178
170
142
129
153
95
92
142
196
172
279
185
no2
97
50
57
38
40
29
18
11
23
12
12
18
30
26
41
so2
80
51
76
65
55
72
95
36
30
26
31
39
34
42
13
co
674
888
1
780
2
2
1
944
1
1
487
483
619
540
3
o3
18
15
19
13
7.2
8.6
13
30
40
50
56
70
374
67
46
* Pollution data source:
https://openaq.org
(caaqm)
The data is licensed under CC-By 4.0
CO 470 (Good)
SO2 15 (Good)
PM2,5 44 (Unhealthy for Sensitive Groups)
O3 35 (Good)
PM10 218 (Very bad Hazardous)
NO2 20 (Good)
Data on air pollution from recent days in Sonipat
| index | 2022-10-07 | 2022-10-08 | 2022-10-09 | 2022-10-10 | 2022-10-11 | 2022-10-12 | 2022-10-13 | 2022-10-14 |
|---|---|---|---|---|---|---|---|---|
| pm25 | 12 Good |
8 Good |
6 Good |
5 Good |
20 Moderate |
30 Moderate |
26 Moderate |
54 Unhealthy for Sensitive Groups |
| co | 32 Good |
59 Good |
31 Good |
56 Good |
281 Good |
548 Good |
445 Good |
730 Good |
| no2 | 17 Good |
16 Good |
17 Good |
17 Good |
18 Good |
17 Good |
18 Good |
20 Good |
| o3 | 26 Good |
27 Good |
26 Good |
26 Good |
24 Good |
26 Good |
26 Good |
25 Good |
| pm10 | 49 Moderate |
25 Moderate |
24 Moderate |
20 Moderate |
78 Unhealthy for Sensitive Groups |
95 Unhealthy |
16 Good |
77 Unhealthy for Sensitive Groups |
| so2 | 15 Good |
16 Good |
16 Good |
15 Good |
16 Good |
15 Good |
16 Good |
16 Good |
| index | 2020-05 | 2020-04 | 2020-03 | 2020-02 | 2020-01 | 2019-12 | 2019-11 | 2019-10 | 2019-09 | 2019-08 | 2019-07 | 2019-06 | 2019-05 | 2019-04 | 2019-02 |
|---|---|---|---|---|---|---|---|---|---|---|---|---|---|---|---|
| pm25 | 33 (Moderate) | 33 (Moderate) | 31 (Moderate) | 41 (Unhealthy for Sensitive Groups) | 43 (Unhealthy for Sensitive Groups) | 32 (Moderate) | 67 (Unhealthy) | 51 (Unhealthy for Sensitive Groups) | 41 (Unhealthy for Sensitive Groups) | 49 (Unhealthy for Sensitive Groups) | 49 (Unhealthy for Sensitive Groups) | 64 (Unhealthy) | 78 (Very Unhealthy) | 94 (Very Unhealthy) | 142 (Very bad Hazardous) |
| pm10 | 141 (Very Unhealthy) | 127 (Very Unhealthy) | 118 (Very Unhealthy) | 178 (Very bad Hazardous) | 170 (Very bad Hazardous) | 142 (Very Unhealthy) | 129 (Very Unhealthy) | 153 (Very bad Hazardous) | 95 (Unhealthy) | 92 (Unhealthy) | 142 (Very Unhealthy) | 196 (Very bad Hazardous) | 172 (Very bad Hazardous) | 279 (Very bad Hazardous) | 185 (Very bad Hazardous) |
| no2 | 97 (Moderate) | 50 (Moderate) | 57 (Moderate) | 38 (Good) | 40 (Good) | 29 (Good) | 18 (Good) | 11 (Good) | 23 (Good) | 12 (Good) | 12 (Good) | 18 (Good) | 30 (Good) | 26 (Good) | 41 (Moderate) |
| so2 | 80 (Moderate) | 51 (Moderate) | 76 (Moderate) | 65 (Moderate) | 55 (Moderate) | 72 (Moderate) | 95 (Moderate) | 36 (Good) | 30 (Good) | 26 (Good) | 31 (Good) | 39 (Good) | 34 (Good) | 42 (Good) | 13 (Good) |
| co | 674 (Good) | 888 (Good) | 1 (Good) | 780 (Good) | 2 (Good) | 2 (Good) | 1 (Good) | 944 (Good) | 1 (Good) | 1 (Good) | 487 (Good) | 483 (Good) | 619 (Good) | 540 (Good) | 3 (Good) |
| o3 | 18 (Good) | 15 (Good) | 19 (Good) | 13 (Good) | 7.2 (Good) | 8.6 (Good) | 13 (Good) | 30 (Good) | 40 (Good) | 50 (Good) | 56 (Good) | 70 (Good) | 374 (Very bad Hazardous) | 67 (Good) | 46 (Good) |
CO 470 (Good)
carbon monoxide (CO)SO2 15 (Good)
sulfur dioxide (SO2)PM2,5 44 (Unhealthy for Sensitive Groups)
particulate matter (PM2.5) dustO3 35 (Good)
ozone (O3)PM10 218 (Very bad Hazardous)
particulate matter (PM10) suspended dustNO2 20 (Good)
nitrogen dioxide (NO2)Murthal, Sonipat - HSPCB
| index | 2022-10-14 | 2022-10-13 | 2022-10-12 | 2022-10-11 | 2022-10-10 | 2022-10-09 | 2022-10-08 | 2022-10-07 |
|---|---|---|---|---|---|---|---|---|
| pm25 | 54 | 26 | 30 | 20 | 4.8 | 5.8 | 8.1 | 12 |
| co | 730 | 445 | 548 | 281 | 56 | 31 | 59 | 32 |
| no2 | 20 | 18 | 17 | 18 | 17 | 17 | 16 | 17 |
| o3 | 25 | 26 | 26 | 24 | 26 | 26 | 27 | 26 |
| pm10 | 77 | 16 | 95 | 78 | 20 | 24 | 25 | 49 |
| so2 | 16 | 16 | 15 | 16 | 15 | 16 | 16 | 15 |
Murthal, Sonipat - HSPCB

| index | 2020-05 | 2020-04 | 2020-03 | 2020-02 | 2020-01 | 2019-12 | 2019-11 | 2019-10 | 2019-09 | 2019-08 | 2019-07 | 2019-06 | 2019-05 | 2019-04 | 2019-02 |
|---|---|---|---|---|---|---|---|---|---|---|---|---|---|---|---|
| pm25 | 33 | 33 | 31 | 41 | 43 | 32 | 67 | 51 | 41 | 49 | 49 | 64 | 78 | 94 | 142 |
| pm10 | 141 | 127 | 118 | 178 | 170 | 142 | 129 | 153 | 95 | 92 | 142 | 196 | 172 | 279 | 185 |
| no2 | 97 | 50 | 57 | 38 | 40 | 29 | 18 | 11 | 23 | 12 | 12 | 18 | 30 | 26 | 41 |
| so2 | 80 | 51 | 76 | 65 | 55 | 72 | 95 | 36 | 30 | 26 | 31 | 39 | 34 | 42 | 13 |
| co | 674 | 888 | 1 | 780 | 2 | 2 | 1 | 944 | 1 | 1 | 487 | 483 | 619 | 540 | 3 |
| o3 | 18 | 15 | 19 | 13 | 7.2 | 8.6 | 13 | 30 | 40 | 50 | 56 | 70 | 374 | 67 | 46 |