Air Pollution in Visakhapatanam: Real-time Air Quality Index and smog alert.
Pollution and air quality forecast for Visakhapatanam. Today is Wednesday, May 13, 2026. The following air pollution values have been recorded for Visakhapatanam:- particulate matter (PM10) suspended dust - 126 (Very Unhealthy)
- sulfur dioxide (SO2) - 22 (Good)
- particulate matter (PM2.5) dust - 66 (Unhealthy)
- carbon monoxide (CO) - 460 (Good)
- nitrogen dioxide (NO2) - 37 (Good)
- ozone (O3) - 16 (Good)

What is the air quality in Visakhapatanam today? Is the air polluted in Visakhapatanam?. Is there smog?
What is the level of PM10 today in Visakhapatanam? (particulate matter (PM10) suspended dust)
The current level of particulate matter PM10 in Visakhapatanam is:
126 (Very Unhealthy)
The highest PM10 values usually occur in month: 176 (February 2019).
The lowest value of particulate matter PM10 pollution in Visakhapatanam is usually recorded in: April (53).
What is the level of SO2 pollution? (sulfur dioxide (SO2))
22 (Good)
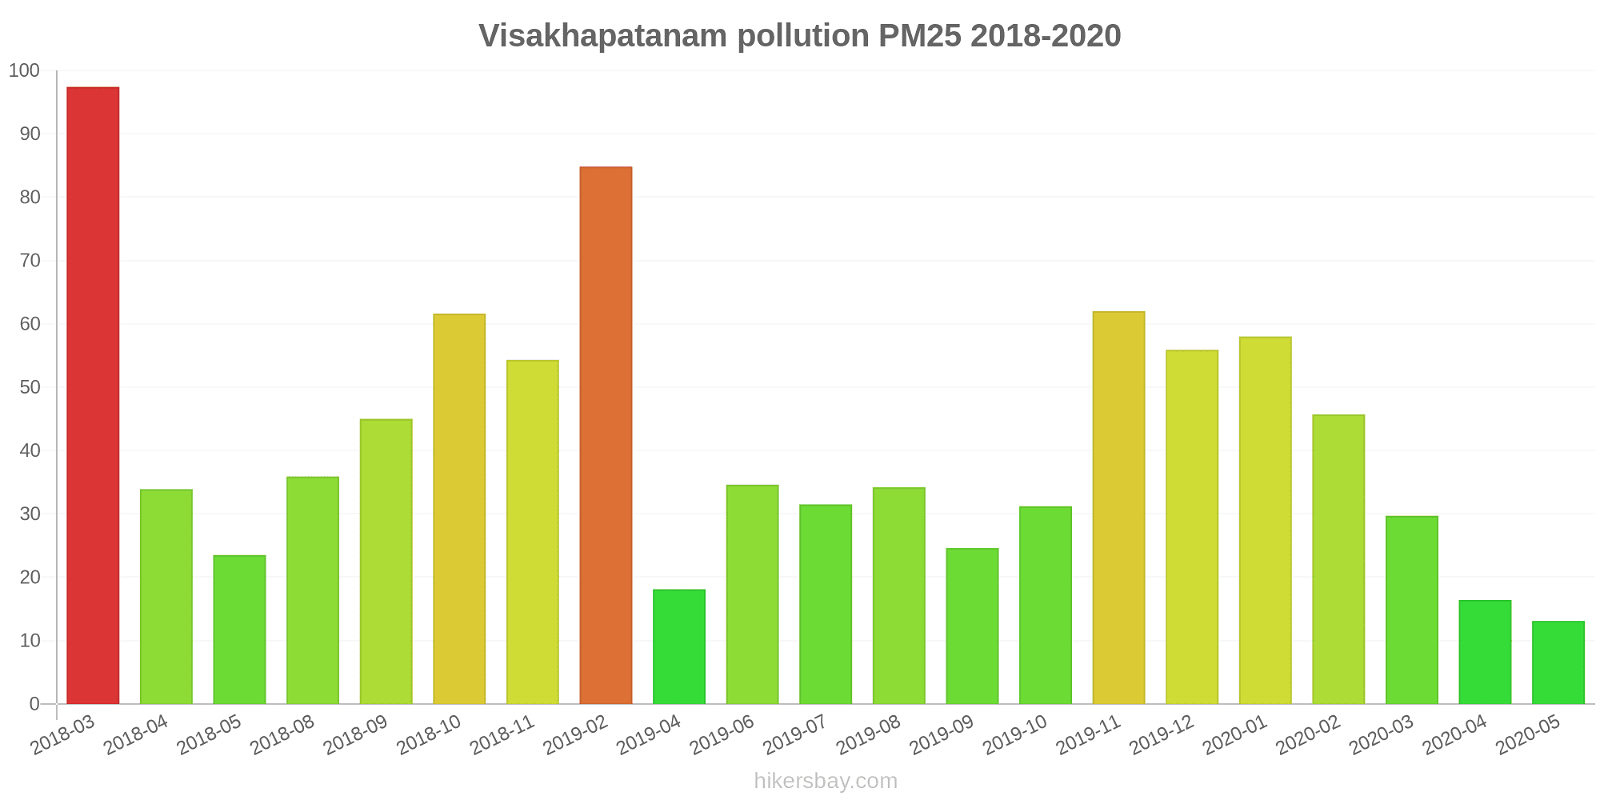
What is the current level of PM2.5 in Visakhapatanam? (particulate matter (PM2.5) dust)
Today's PM2.5 level is:
66 (Unhealthy)
For comparison, the highest level of PM2.5 in Visakhapatanam in the last 7 days was: 65 (Monday, October 31, 2022) and the lowest: 65 (Monday, October 31, 2022).
The highest PM2.5 values were recorded: 97 (March 2018).
The lowest level of particulate matter PM2.5 pollution occurs in month: May (13).
How high is the CO level? (carbon monoxide (CO))
460 (Good)
How high is the level of NO2? (nitrogen dioxide (NO2))
37 (Good)
How is the O3 level today in Visakhapatanam? (ozone (O3))
16 (Good)
Current data Monday, October 31, 2022, 2:00 AM
PM10 126 (Very Unhealthy)
SO2 22 (Good)
PM2,5 66 (Unhealthy)
CO 460 (Good)
NO2 37 (Good)
O3 16 (Good)
Data on air pollution from recent days in Visakhapatanam
index
2022-10-31
pm10
119
Very Unhealthy
so2
23
Good
pm25
65
Unhealthy
co
450
Good
no2
35
Good
o3
16
Good
data source »
Air pollution in Visakhapatanam from March 2018 to May 2020
index
2020-05
2020-04
2020-03
2020-02
2020-01
2019-12
2019-11
2019-10
2019-09
2019-08
2019-07
2019-06
2019-04
2019-02
2018-11
2018-10
2018-09
2018-08
2018-05
2018-04
2018-03
pm10
56 (Unhealthy for Sensitive Groups)
53 (Unhealthy for Sensitive Groups)
78 (Unhealthy for Sensitive Groups)
97 (Unhealthy)
119 (Very Unhealthy)
103 (Unhealthy)
108 (Unhealthy)
84 (Unhealthy)
68 (Unhealthy for Sensitive Groups)
93 (Unhealthy)
102 (Unhealthy)
105 (Unhealthy)
75 (Unhealthy for Sensitive Groups)
176 (Very bad Hazardous)
102 (Unhealthy)
142 (Very Unhealthy)
106 (Unhealthy)
78 (Unhealthy for Sensitive Groups)
84 (Unhealthy)
68 (Unhealthy for Sensitive Groups)
107 (Unhealthy)
no2
18 (Good)
27 (Good)
30 (Good)
35 (Good)
34 (Good)
33 (Good)
32 (Good)
36 (Good)
31 (Good)
24 (Good)
38 (Good)
42 (Moderate)
17 (Good)
54 (Moderate)
25 (Good)
41 (Moderate)
37 (Good)
42 (Moderate)
34 (Good)
33 (Good)
52 (Moderate)
so2
18 (Good)
21 (Good)
26 (Good)
22 (Good)
9.7 (Good)
16 (Good)
25 (Good)
52 (Moderate)
776 (Very bad Hazardous)
30 (Good)
3 (Good)
24 (Good)
19 (Good)
20 (Good)
21 (Good)
25 (Good)
66 (Moderate)
50 (Moderate)
28 (Good)
21 (Good)
18 (Good)
co
110 (Good)
110 (Good)
677 (Good)
1 (Good)
1 (Good)
971 (Good)
805 (Good)
753 (Good)
851 (Good)
863 (Good)
721 (Good)
812 (Good)
732 (Good)
1 (Good)
686 (Good)
672 (Good)
833 (Good)
874 (Good)
549 (Good)
12 (Good)
34 (Good)
o3
19 (Good)
17 (Good)
23 (Good)
30 (Good)
50 (Good)
68 (Good)
78 (Moderate)
30 (Good)
23 (Good)
14 (Good)
12 (Good)
18 (Good)
11 (Good)
62 (Good)
62 (Good)
55 (Good)
26 (Good)
12 (Good)
22 (Good)
23 (Good)
20 (Good)
pm25
13 (Moderate)
16 (Moderate)
30 (Moderate)
46 (Unhealthy for Sensitive Groups)
58 (Unhealthy)
56 (Unhealthy)
62 (Unhealthy)
31 (Moderate)
25 (Moderate)
34 (Moderate)
32 (Moderate)
35 (Moderate)
18 (Moderate)
85 (Very Unhealthy)
54 (Unhealthy for Sensitive Groups)
62 (Unhealthy)
45 (Unhealthy for Sensitive Groups)
36 (Unhealthy for Sensitive Groups)
24 (Moderate)
34 (Moderate)
97 (Very Unhealthy)
data source »
Quality of life in Visakhapatanam
Green and Parks in the City
Visakhapatanam
64%
Nepal: 32%
Bangladesh: 33%
Bhutan: 82%
Sri Lanka: 59%
Pakistan: 49%
particulate matter PM2.5
Visakhapatanam
35 (Unhealthy for Sensitive Groups)
Pleasure of spending time in the city
Visakhapatanam
47%
Nepal: 32%
Bangladesh: 26%
Bhutan: 61%
Sri Lanka: 52%
Pakistan: 43%
particulate matter PM10
Visakhapatanam
65 (Unhealthy for Sensitive Groups)
Air Pollution
Visakhapatanam
61%
Nepal: 76%
Bangladesh: 78%
Bhutan: 45%
Sri Lanka: 53%
Pakistan: 64%
Garbage Disposal
Visakhapatanam
49%
Nepal: 25%
Bangladesh: 22%
Bhutan: 47%
Sri Lanka: 41%
Pakistan: 34%
Availability and quality of drinking water
Visakhapatanam
50%
Nepal: 36%
Bangladesh: 44%
Bhutan: 64%
Sri Lanka: 65%
Pakistan: 44%
Cleanliness and tidiness
Visakhapatanam
56%
Nepal: 27%
Bangladesh: 23%
Bhutan: 57%
Sri Lanka: 52%
Pakistan: 40%
Noise and Light pollution
Visakhapatanam
62%
Nepal: 55%
Bangladesh: 63%
Bhutan: 55%
Sri Lanka: 50%
Pakistan: 59%
Water Pollution
Visakhapatanam
69%
Nepal: 76%
Bangladesh: 74%
Bhutan: 56%
Sri Lanka: 57%
Pakistan: 70%
Source: Numbeo
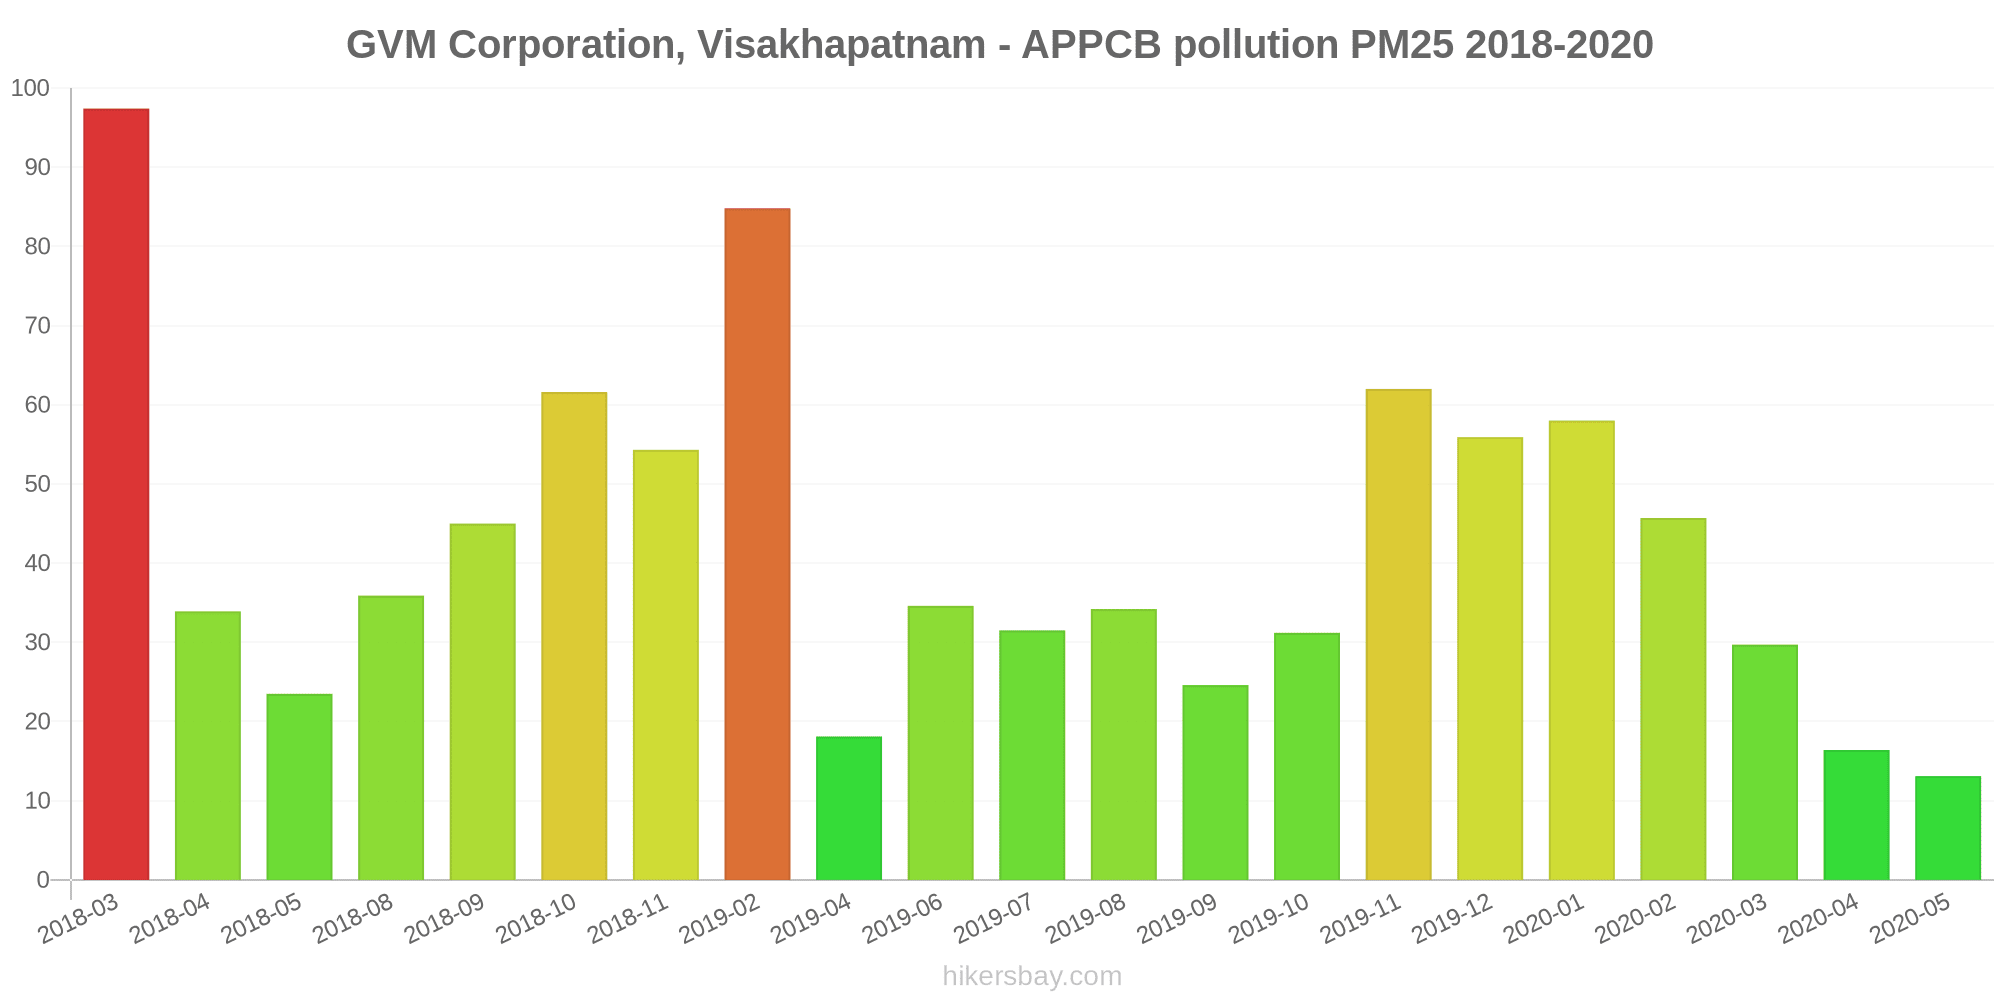
GVM Corporation, Visakhapatnam - APPCB
Monday, October 31, 2022, 2:00 AM
PM10 126 (Very Unhealthy)
particulate matter (PM10) suspended dust
SO2 22 (Good)
sulfur dioxide (SO2)
PM2,5 66 (Unhealthy)
particulate matter (PM2.5) dust
CO 460 (Good)
carbon monoxide (CO)
NO2 37 (Good)
nitrogen dioxide (NO2)
O3 16 (Good)
ozone (O3)
GVM Corporation, Visakhapatnam - APPCB
index
2022-10-31
pm10
119
so2
23
pm25
65
co
450
no2
35
o3
16
GVM Corporation, Visakhapatnam - APPCB
2018-03 2020-05

index
2020-05
2020-04
2020-03
2020-02
2020-01
2019-12
2019-11
2019-10
2019-09
2019-08
2019-07
2019-06
2019-04
2019-02
2018-11
2018-10
2018-09
2018-08
2018-05
2018-04
2018-03
pm25
13
16
30
46
58
56
62
31
25
34
32
35
18
85
54
62
45
36
24
34
97
pm10
56
53
78
97
119
103
108
84
68
93
102
105
75
176
102
142
106
78
84
68
107
no2
18
27
30
35
34
33
32
36
31
24
38
42
17
54
25
41
37
42
34
33
52
so2
18
21
26
22
9.7
16
25
52
776
30
3
24
19
20
21
25
66
50
28
21
18
co
110
110
677
1
1
971
805
753
851
863
721
812
732
1
686
672
833
874
549
12
34
o3
19
17
23
30
50
68
78
30
23
14
12
18
11
62
62
55
26
12
22
23
20
* Pollution data source:
https://openaq.org
(caaqm)
The data is licensed under CC-By 4.0
PM10 126 (Very Unhealthy)
SO2 22 (Good)
PM2,5 66 (Unhealthy)
CO 460 (Good)
NO2 37 (Good)
O3 16 (Good)
Data on air pollution from recent days in Visakhapatanam
| index | 2022-10-31 |
|---|---|
| pm10 | 119 Very Unhealthy |
| so2 | 23 Good |
| pm25 | 65 Unhealthy |
| co | 450 Good |
| no2 | 35 Good |
| o3 | 16 Good |

| index | 2020-05 | 2020-04 | 2020-03 | 2020-02 | 2020-01 | 2019-12 | 2019-11 | 2019-10 | 2019-09 | 2019-08 | 2019-07 | 2019-06 | 2019-04 | 2019-02 | 2018-11 | 2018-10 | 2018-09 | 2018-08 | 2018-05 | 2018-04 | 2018-03 |
|---|---|---|---|---|---|---|---|---|---|---|---|---|---|---|---|---|---|---|---|---|---|
| pm10 | 56 (Unhealthy for Sensitive Groups) | 53 (Unhealthy for Sensitive Groups) | 78 (Unhealthy for Sensitive Groups) | 97 (Unhealthy) | 119 (Very Unhealthy) | 103 (Unhealthy) | 108 (Unhealthy) | 84 (Unhealthy) | 68 (Unhealthy for Sensitive Groups) | 93 (Unhealthy) | 102 (Unhealthy) | 105 (Unhealthy) | 75 (Unhealthy for Sensitive Groups) | 176 (Very bad Hazardous) | 102 (Unhealthy) | 142 (Very Unhealthy) | 106 (Unhealthy) | 78 (Unhealthy for Sensitive Groups) | 84 (Unhealthy) | 68 (Unhealthy for Sensitive Groups) | 107 (Unhealthy) |
| no2 | 18 (Good) | 27 (Good) | 30 (Good) | 35 (Good) | 34 (Good) | 33 (Good) | 32 (Good) | 36 (Good) | 31 (Good) | 24 (Good) | 38 (Good) | 42 (Moderate) | 17 (Good) | 54 (Moderate) | 25 (Good) | 41 (Moderate) | 37 (Good) | 42 (Moderate) | 34 (Good) | 33 (Good) | 52 (Moderate) |
| so2 | 18 (Good) | 21 (Good) | 26 (Good) | 22 (Good) | 9.7 (Good) | 16 (Good) | 25 (Good) | 52 (Moderate) | 776 (Very bad Hazardous) | 30 (Good) | 3 (Good) | 24 (Good) | 19 (Good) | 20 (Good) | 21 (Good) | 25 (Good) | 66 (Moderate) | 50 (Moderate) | 28 (Good) | 21 (Good) | 18 (Good) |
| co | 110 (Good) | 110 (Good) | 677 (Good) | 1 (Good) | 1 (Good) | 971 (Good) | 805 (Good) | 753 (Good) | 851 (Good) | 863 (Good) | 721 (Good) | 812 (Good) | 732 (Good) | 1 (Good) | 686 (Good) | 672 (Good) | 833 (Good) | 874 (Good) | 549 (Good) | 12 (Good) | 34 (Good) |
| o3 | 19 (Good) | 17 (Good) | 23 (Good) | 30 (Good) | 50 (Good) | 68 (Good) | 78 (Moderate) | 30 (Good) | 23 (Good) | 14 (Good) | 12 (Good) | 18 (Good) | 11 (Good) | 62 (Good) | 62 (Good) | 55 (Good) | 26 (Good) | 12 (Good) | 22 (Good) | 23 (Good) | 20 (Good) |
| pm25 | 13 (Moderate) | 16 (Moderate) | 30 (Moderate) | 46 (Unhealthy for Sensitive Groups) | 58 (Unhealthy) | 56 (Unhealthy) | 62 (Unhealthy) | 31 (Moderate) | 25 (Moderate) | 34 (Moderate) | 32 (Moderate) | 35 (Moderate) | 18 (Moderate) | 85 (Very Unhealthy) | 54 (Unhealthy for Sensitive Groups) | 62 (Unhealthy) | 45 (Unhealthy for Sensitive Groups) | 36 (Unhealthy for Sensitive Groups) | 24 (Moderate) | 34 (Moderate) | 97 (Very Unhealthy) |
Green and Parks in the City
Visakhapatanam 64%
Nepal: 32% Bangladesh: 33% Bhutan: 82% Sri Lanka: 59% Pakistan: 49%particulate matter PM2.5
Visakhapatanam 35 (Unhealthy for Sensitive Groups)
Pleasure of spending time in the city
Visakhapatanam 47%
Nepal: 32% Bangladesh: 26% Bhutan: 61% Sri Lanka: 52% Pakistan: 43%particulate matter PM10
Visakhapatanam 65 (Unhealthy for Sensitive Groups)
Air Pollution
Visakhapatanam 61%
Nepal: 76% Bangladesh: 78% Bhutan: 45% Sri Lanka: 53% Pakistan: 64%Garbage Disposal
Visakhapatanam 49%
Nepal: 25% Bangladesh: 22% Bhutan: 47% Sri Lanka: 41% Pakistan: 34%Availability and quality of drinking water
Visakhapatanam 50%
Nepal: 36% Bangladesh: 44% Bhutan: 64% Sri Lanka: 65% Pakistan: 44%Cleanliness and tidiness
Visakhapatanam 56%
Nepal: 27% Bangladesh: 23% Bhutan: 57% Sri Lanka: 52% Pakistan: 40%Noise and Light pollution
Visakhapatanam 62%
Nepal: 55% Bangladesh: 63% Bhutan: 55% Sri Lanka: 50% Pakistan: 59%Water Pollution
Visakhapatanam 69%
Nepal: 76% Bangladesh: 74% Bhutan: 56% Sri Lanka: 57% Pakistan: 70%PM10 126 (Very Unhealthy)
particulate matter (PM10) suspended dustSO2 22 (Good)
sulfur dioxide (SO2)PM2,5 66 (Unhealthy)
particulate matter (PM2.5) dustCO 460 (Good)
carbon monoxide (CO)NO2 37 (Good)
nitrogen dioxide (NO2)O3 16 (Good)
ozone (O3)GVM Corporation, Visakhapatnam - APPCB
| index | 2022-10-31 |
|---|---|
| pm10 | 119 |
| so2 | 23 |
| pm25 | 65 |
| co | 450 |
| no2 | 35 |
| o3 | 16 |
GVM Corporation, Visakhapatnam - APPCB
| index | 2020-05 | 2020-04 | 2020-03 | 2020-02 | 2020-01 | 2019-12 | 2019-11 | 2019-10 | 2019-09 | 2019-08 | 2019-07 | 2019-06 | 2019-04 | 2019-02 | 2018-11 | 2018-10 | 2018-09 | 2018-08 | 2018-05 | 2018-04 | 2018-03 |
|---|---|---|---|---|---|---|---|---|---|---|---|---|---|---|---|---|---|---|---|---|---|
| pm25 | 13 | 16 | 30 | 46 | 58 | 56 | 62 | 31 | 25 | 34 | 32 | 35 | 18 | 85 | 54 | 62 | 45 | 36 | 24 | 34 | 97 |
| pm10 | 56 | 53 | 78 | 97 | 119 | 103 | 108 | 84 | 68 | 93 | 102 | 105 | 75 | 176 | 102 | 142 | 106 | 78 | 84 | 68 | 107 |
| no2 | 18 | 27 | 30 | 35 | 34 | 33 | 32 | 36 | 31 | 24 | 38 | 42 | 17 | 54 | 25 | 41 | 37 | 42 | 34 | 33 | 52 |
| so2 | 18 | 21 | 26 | 22 | 9.7 | 16 | 25 | 52 | 776 | 30 | 3 | 24 | 19 | 20 | 21 | 25 | 66 | 50 | 28 | 21 | 18 |
| co | 110 | 110 | 677 | 1 | 1 | 971 | 805 | 753 | 851 | 863 | 721 | 812 | 732 | 1 | 686 | 672 | 833 | 874 | 549 | 12 | 34 |
| o3 | 19 | 17 | 23 | 30 | 50 | 68 | 78 | 30 | 23 | 14 | 12 | 18 | 11 | 62 | 62 | 55 | 26 | 12 | 22 | 23 | 20 |