Air Pollution in Yavatmal district: Real-time Air Quality Index and smog alert.
Pollution and air quality forecast for Yavatmal district. Today is Wednesday, May 13, 2026. The following air pollution values have been recorded for Yavatmal district:- nitrogen dioxide (NO2) - 32 (Good)
- carbon monoxide (CO) - 560 (Good)
- particulate matter (PM10) suspended dust - 123 (Very Unhealthy)
- ozone (O3) - 15 (Good)
- sulfur dioxide (SO2) - 7 (Good)
- particulate matter (PM2.5) dust - 66 (Unhealthy)

What is the air quality in Yavatmal district today? Is the air polluted in Yavatmal district?. Is there smog?
How high is the level of NO2? (nitrogen dioxide (NO2))
32 (Good)
How high is the CO level? (carbon monoxide (CO))
560 (Good)
What is the level of PM10 today in Yavatmal district? (particulate matter (PM10) suspended dust)
The current level of particulate matter PM10 in Yavatmal district is:
123 (Very Unhealthy)
The highest PM10 values usually occur in month: 159 (May 2019).
The lowest value of particulate matter PM10 pollution in Yavatmal district is usually recorded in: August (48).
How is the O3 level today in Yavatmal district? (ozone (O3))
15 (Good)
What is the level of SO2 pollution? (sulfur dioxide (SO2))
7 (Good)
What is the current level of PM2.5 in Yavatmal district? (particulate matter (PM2.5) dust)
Today's PM2.5 level is:
66 (Unhealthy)
For comparison, the highest level of PM2.5 in Yavatmal district in the last 7 days was: 70 (Monday, October 31, 2022) and the lowest: 70 (Monday, October 31, 2022).
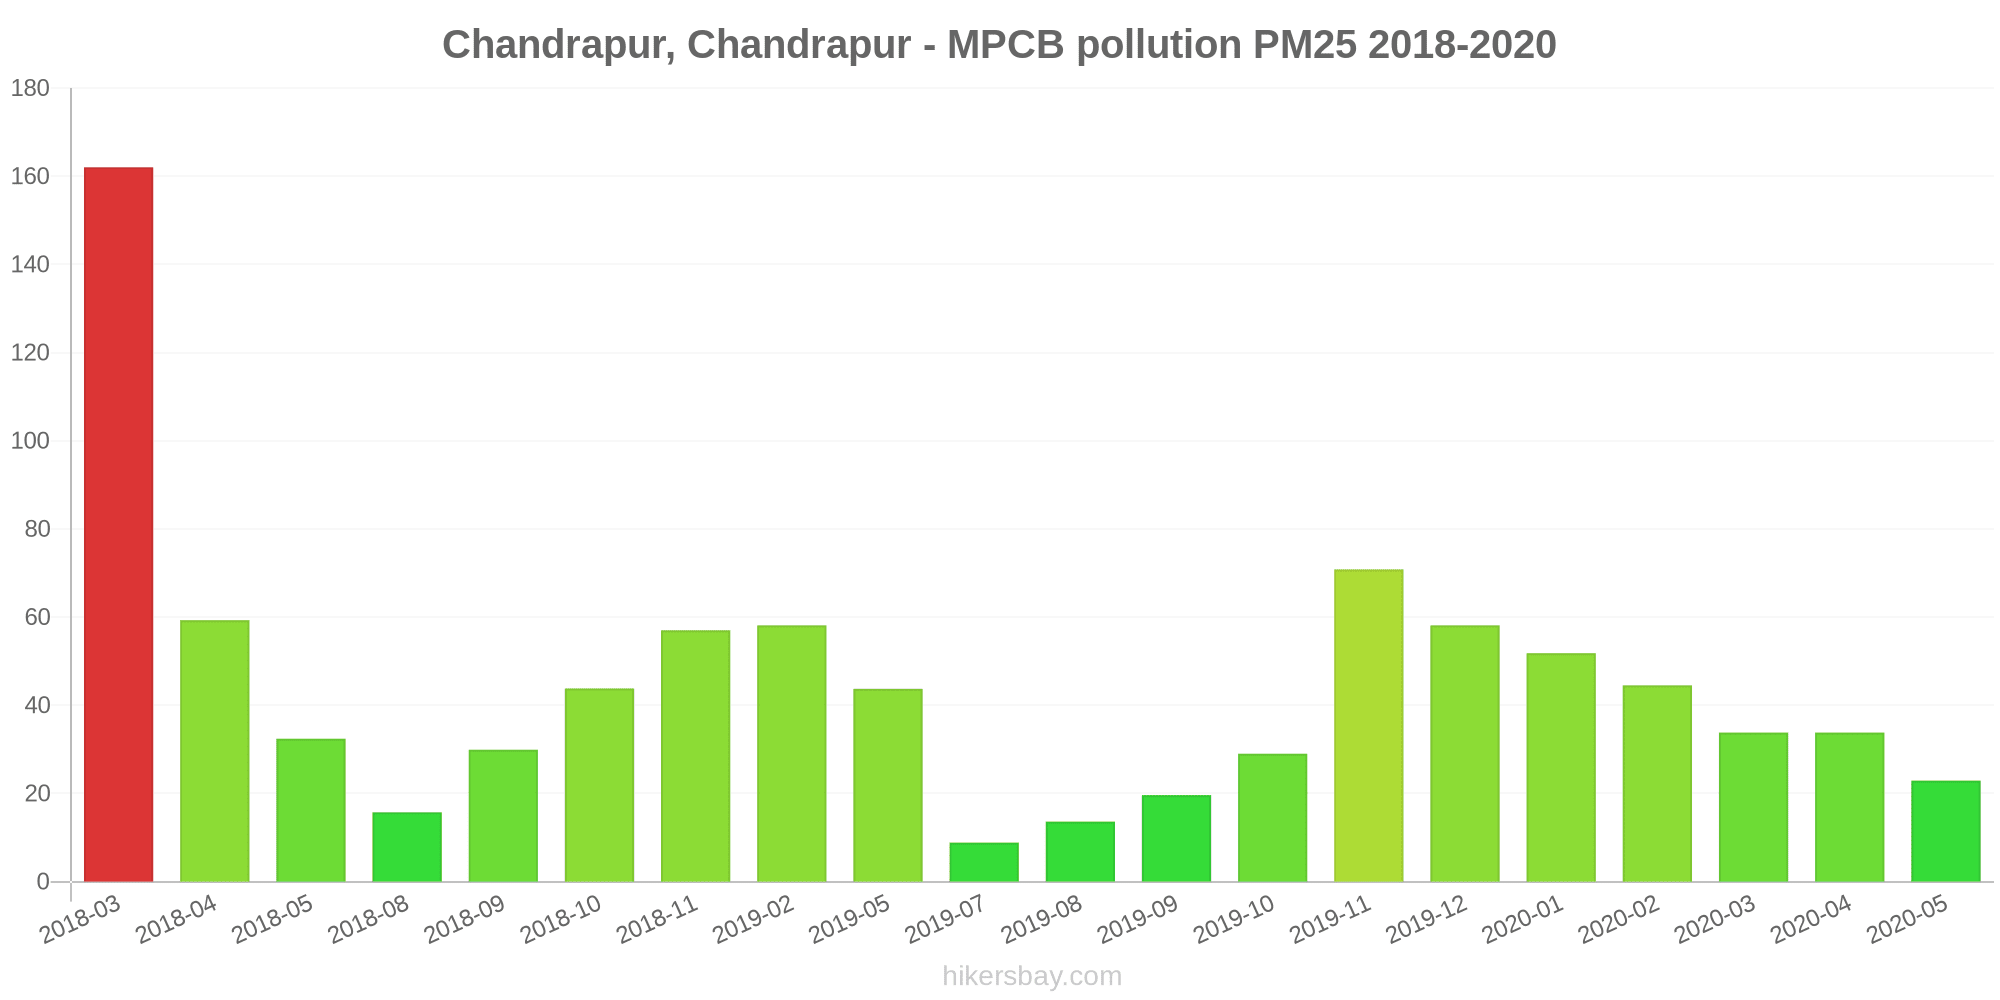
The highest PM2.5 values were recorded: 162 (March 2018).
The lowest level of particulate matter PM2.5 pollution occurs in month: July (8.8).
Current data Monday, October 31, 2022, 2:00 AM
NO2 32 (Good)
CO 560 (Good)
PM10 123 (Very Unhealthy)
O3 15 (Good)
SO2 7 (Good)
PM2,5 66 (Unhealthy)
Data on air pollution from recent days in Yavatmal district
index
2022-10-31
no2
32
Good
co
550
Good
pm10
123
Very Unhealthy
o3
15
Good
so2
7
Good
pm25
70
Unhealthy
data source »
Air pollution in Yavatmal district from March 2018 to May 2020

index
2020-05
2020-04
2020-03
2020-02
2020-01
2019-12
2019-11
2019-10
2019-09
2019-08
2019-07
2019-05
2019-02
2018-11
2018-10
2018-09
2018-08
2018-05
2018-04
2018-03
pm25
23 (Moderate)
34 (Moderate)
34 (Moderate)
45 (Unhealthy for Sensitive Groups)
52 (Unhealthy for Sensitive Groups)
58 (Unhealthy)
71 (Unhealthy)
29 (Moderate)
20 (Moderate)
14 (Moderate)
8.8 (Good)
44 (Unhealthy for Sensitive Groups)
58 (Unhealthy)
57 (Unhealthy)
44 (Unhealthy for Sensitive Groups)
30 (Moderate)
16 (Moderate)
32 (Moderate)
59 (Unhealthy)
162 (Very bad Hazardous)
pm10
51 (Unhealthy for Sensitive Groups)
68 (Unhealthy for Sensitive Groups)
83 (Unhealthy)
87 (Unhealthy)
70 (Unhealthy for Sensitive Groups)
84 (Unhealthy)
139 (Very Unhealthy)
75 (Unhealthy for Sensitive Groups)
51 (Unhealthy for Sensitive Groups)
50 (Moderate)
48 (Moderate)
159 (Very bad Hazardous)
132 (Very Unhealthy)
123 (Very Unhealthy)
115 (Very Unhealthy)
87 (Unhealthy)
48 (Moderate)
99 (Unhealthy)
120 (Very Unhealthy)
159 (Very bad Hazardous)
no2
12 (Good)
13 (Good)
11 (Good)
12 (Good)
11 (Good)
11 (Good)
17 (Good)
19 (Good)
18 (Good)
19 (Good)
13 (Good)
13 (Good)
13 (Good)
12 (Good)
13 (Good)
22 (Good)
22 (Good)
15 (Good)
20 (Good)
25 (Good)
so2
24 (Good)
24 (Good)
24 (Good)
3.8 (Good)
2.9 (Good)
8 (Good)
14 (Good)
14 (Good)
14 (Good)
14 (Good)
14 (Good)
9.3 (Good)
8.1 (Good)
8.2 (Good)
9.1 (Good)
8 (Good)
8.9 (Good)
9.5 (Good)
9.8 (Good)
12 (Good)
co
251 (Good)
305 (Good)
277 (Good)
393 (Good)
363 (Good)
345 (Good)
755 (Good)
481 (Good)
334 (Good)
311 (Good)
227 (Good)
613 (Good)
185 (Good)
490 (Good)
530 (Good)
615 (Good)
500 (Good)
220 (Good)
8 (Good)
53 (Good)
o3
24 (Good)
23 (Good)
22 (Good)
29 (Good)
19 (Good)
17 (Good)
29 (Good)
24 (Good)
17 (Good)
15 (Good)
14 (Good)
32 (Good)
8.6 (Good)
13 (Good)
10 (Good)
9.5 (Good)
10 (Good)
11 (Good)
15 (Good)
20 (Good)
data source »
Chandrapur, Chandrapur - MPCB
Monday, October 31, 2022, 2:00 AM
NO2 32 (Good)
nitrogen dioxide (NO2)
CO 560 (Good)
carbon monoxide (CO)
PM10 123 (Very Unhealthy)
particulate matter (PM10) suspended dust
O3 15 (Good)
ozone (O3)
SO2 7.1 (Good)
sulfur dioxide (SO2)
PM2,5 66 (Unhealthy)
particulate matter (PM2.5) dust
Chandrapur, Chandrapur - MPCB
index
2022-10-31
no2
32
co
550
pm10
123
o3
15
so2
7
pm25
70
Chandrapur, Chandrapur - MPCB
2018-03 2020-05

index
2020-05
2020-04
2020-03
2020-02
2020-01
2019-12
2019-11
2019-10
2019-09
2019-08
2019-07
2019-05
2019-02
2018-11
2018-10
2018-09
2018-08
2018-05
2018-04
2018-03
pm25
23
34
34
45
52
58
71
29
20
14
8.8
44
58
57
44
30
16
32
59
162
no2
12
13
11
12
11
11
17
19
18
19
13
13
13
12
13
22
22
15
20
25
so2
24
24
24
3.8
2.9
8
14
14
14
14
14
9.3
8.1
8.2
9.1
8
8.9
9.5
9.8
12
co
251
305
277
393
363
345
755
481
334
311
227
613
185
490
530
615
500
220
8
53
o3
24
23
22
29
19
17
29
24
17
15
14
32
8.6
13
10
9.5
10
11
15
20
pm10
51
68
83
87
70
84
139
75
51
50
48
159
132
123
115
87
48
99
120
159
* Pollution data source:
https://openaq.org
(caaqm)
The data is licensed under CC-By 4.0
NO2 32 (Good)
CO 560 (Good)
PM10 123 (Very Unhealthy)
O3 15 (Good)
SO2 7 (Good)
PM2,5 66 (Unhealthy)
Data on air pollution from recent days in Yavatmal district
| index | 2022-10-31 |
|---|---|
| no2 | 32 Good |
| co | 550 Good |
| pm10 | 123 Very Unhealthy |
| o3 | 15 Good |
| so2 | 7 Good |
| pm25 | 70 Unhealthy |

| index | 2020-05 | 2020-04 | 2020-03 | 2020-02 | 2020-01 | 2019-12 | 2019-11 | 2019-10 | 2019-09 | 2019-08 | 2019-07 | 2019-05 | 2019-02 | 2018-11 | 2018-10 | 2018-09 | 2018-08 | 2018-05 | 2018-04 | 2018-03 |
|---|---|---|---|---|---|---|---|---|---|---|---|---|---|---|---|---|---|---|---|---|
| pm25 | 23 (Moderate) | 34 (Moderate) | 34 (Moderate) | 45 (Unhealthy for Sensitive Groups) | 52 (Unhealthy for Sensitive Groups) | 58 (Unhealthy) | 71 (Unhealthy) | 29 (Moderate) | 20 (Moderate) | 14 (Moderate) | 8.8 (Good) | 44 (Unhealthy for Sensitive Groups) | 58 (Unhealthy) | 57 (Unhealthy) | 44 (Unhealthy for Sensitive Groups) | 30 (Moderate) | 16 (Moderate) | 32 (Moderate) | 59 (Unhealthy) | 162 (Very bad Hazardous) |
| pm10 | 51 (Unhealthy for Sensitive Groups) | 68 (Unhealthy for Sensitive Groups) | 83 (Unhealthy) | 87 (Unhealthy) | 70 (Unhealthy for Sensitive Groups) | 84 (Unhealthy) | 139 (Very Unhealthy) | 75 (Unhealthy for Sensitive Groups) | 51 (Unhealthy for Sensitive Groups) | 50 (Moderate) | 48 (Moderate) | 159 (Very bad Hazardous) | 132 (Very Unhealthy) | 123 (Very Unhealthy) | 115 (Very Unhealthy) | 87 (Unhealthy) | 48 (Moderate) | 99 (Unhealthy) | 120 (Very Unhealthy) | 159 (Very bad Hazardous) |
| no2 | 12 (Good) | 13 (Good) | 11 (Good) | 12 (Good) | 11 (Good) | 11 (Good) | 17 (Good) | 19 (Good) | 18 (Good) | 19 (Good) | 13 (Good) | 13 (Good) | 13 (Good) | 12 (Good) | 13 (Good) | 22 (Good) | 22 (Good) | 15 (Good) | 20 (Good) | 25 (Good) |
| so2 | 24 (Good) | 24 (Good) | 24 (Good) | 3.8 (Good) | 2.9 (Good) | 8 (Good) | 14 (Good) | 14 (Good) | 14 (Good) | 14 (Good) | 14 (Good) | 9.3 (Good) | 8.1 (Good) | 8.2 (Good) | 9.1 (Good) | 8 (Good) | 8.9 (Good) | 9.5 (Good) | 9.8 (Good) | 12 (Good) |
| co | 251 (Good) | 305 (Good) | 277 (Good) | 393 (Good) | 363 (Good) | 345 (Good) | 755 (Good) | 481 (Good) | 334 (Good) | 311 (Good) | 227 (Good) | 613 (Good) | 185 (Good) | 490 (Good) | 530 (Good) | 615 (Good) | 500 (Good) | 220 (Good) | 8 (Good) | 53 (Good) |
| o3 | 24 (Good) | 23 (Good) | 22 (Good) | 29 (Good) | 19 (Good) | 17 (Good) | 29 (Good) | 24 (Good) | 17 (Good) | 15 (Good) | 14 (Good) | 32 (Good) | 8.6 (Good) | 13 (Good) | 10 (Good) | 9.5 (Good) | 10 (Good) | 11 (Good) | 15 (Good) | 20 (Good) |
NO2 32 (Good)
nitrogen dioxide (NO2)CO 560 (Good)
carbon monoxide (CO)PM10 123 (Very Unhealthy)
particulate matter (PM10) suspended dustO3 15 (Good)
ozone (O3)SO2 7.1 (Good)
sulfur dioxide (SO2)PM2,5 66 (Unhealthy)
particulate matter (PM2.5) dustChandrapur, Chandrapur - MPCB
| index | 2022-10-31 |
|---|---|
| no2 | 32 |
| co | 550 |
| pm10 | 123 |
| o3 | 15 |
| so2 | 7 |
| pm25 | 70 |
Chandrapur, Chandrapur - MPCB
| index | 2020-05 | 2020-04 | 2020-03 | 2020-02 | 2020-01 | 2019-12 | 2019-11 | 2019-10 | 2019-09 | 2019-08 | 2019-07 | 2019-05 | 2019-02 | 2018-11 | 2018-10 | 2018-09 | 2018-08 | 2018-05 | 2018-04 | 2018-03 |
|---|---|---|---|---|---|---|---|---|---|---|---|---|---|---|---|---|---|---|---|---|
| pm25 | 23 | 34 | 34 | 45 | 52 | 58 | 71 | 29 | 20 | 14 | 8.8 | 44 | 58 | 57 | 44 | 30 | 16 | 32 | 59 | 162 |
| no2 | 12 | 13 | 11 | 12 | 11 | 11 | 17 | 19 | 18 | 19 | 13 | 13 | 13 | 12 | 13 | 22 | 22 | 15 | 20 | 25 |
| so2 | 24 | 24 | 24 | 3.8 | 2.9 | 8 | 14 | 14 | 14 | 14 | 14 | 9.3 | 8.1 | 8.2 | 9.1 | 8 | 8.9 | 9.5 | 9.8 | 12 |
| co | 251 | 305 | 277 | 393 | 363 | 345 | 755 | 481 | 334 | 311 | 227 | 613 | 185 | 490 | 530 | 615 | 500 | 220 | 8 | 53 |
| o3 | 24 | 23 | 22 | 29 | 19 | 17 | 29 | 24 | 17 | 15 | 14 | 32 | 8.6 | 13 | 10 | 9.5 | 10 | 11 | 15 | 20 |
| pm10 | 51 | 68 | 83 | 87 | 70 | 84 | 139 | 75 | 51 | 50 | 48 | 159 | 132 | 123 | 115 | 87 | 48 | 99 | 120 | 159 |