Air Pollution in Tippanhalli: Real-time Air Quality Index and smog alert.
Pollution and air quality forecast for Tippanhalli. Today is Wednesday, May 13, 2026. The following air pollution values have been recorded for Tippanhalli:- particulate matter (PM10) suspended dust - 65 (Unhealthy for Sensitive Groups)
- sulfur dioxide (SO2) - 6 (Good)
- ozone (O3) - 23 (Good)
- carbon monoxide (CO) - 630 (Good)
- nitrogen dioxide (NO2) - 32 (Good)
- particulate matter (PM2.5) dust - 51 (Unhealthy for Sensitive Groups)

What is the air quality in Tippanhalli today? Is the air polluted in Tippanhalli?. Is there smog?
What is the level of PM10 today in Tippanhalli? (particulate matter (PM10) suspended dust)
The current level of particulate matter PM10 in Tippanhalli is:
65 (Unhealthy for Sensitive Groups)
What is the level of SO2 pollution? (sulfur dioxide (SO2))
6 (Good)
How is the O3 level today in Tippanhalli? (ozone (O3))
23 (Good)
How high is the CO level? (carbon monoxide (CO))
630 (Good)
How high is the level of NO2? (nitrogen dioxide (NO2))
32 (Good)
What is the current level of PM2.5 in Tippanhalli? (particulate matter (PM2.5) dust)
Today's PM2.5 level is:
51 (Unhealthy for Sensitive Groups)
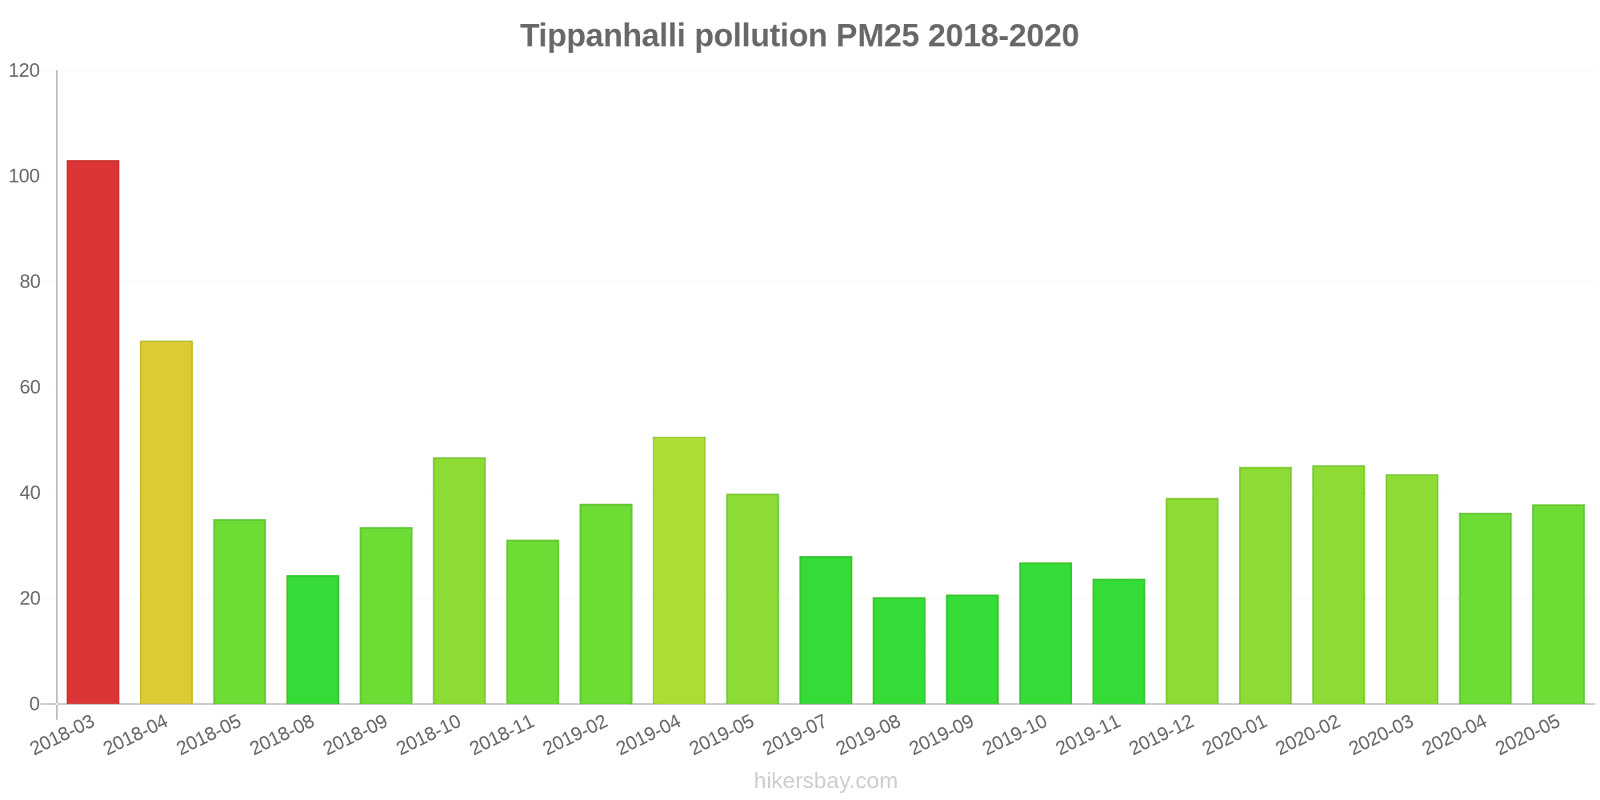
For comparison, the highest level of PM2.5 in Tippanhalli in the last 7 days was: 51 (Monday, October 31, 2022) and the lowest: 51 (Monday, October 31, 2022).
The highest PM2.5 values were recorded: 103 (March 2018).
The lowest level of particulate matter PM2.5 pollution occurs in month: August (20).
Current data Monday, October 31, 2022, 1:45 AM
PM10 65 (Unhealthy for Sensitive Groups)
SO2 6 (Good)
O3 23 (Good)
CO 630 (Good)
NO2 32 (Good)
PM2,5 51 (Unhealthy for Sensitive Groups)
Data on air pollution from recent days in Tippanhalli
index
2022-10-31
pm10
65
Unhealthy for Sensitive Groups
so2
6
Good
o3
23
Good
co
630
Good
no2
32
Good
pm25
51
Unhealthy for Sensitive Groups
data source »
Air pollution in Tippanhalli from March 2018 to May 2020
index
2020-05
2020-04
2020-03
2020-02
2020-01
2019-12
2019-11
2019-10
2019-09
2019-08
2019-07
2019-05
2019-04
2019-02
2018-11
2018-10
2018-09
2018-08
2018-05
2018-04
2018-03
pm25
38 (Unhealthy for Sensitive Groups)
36 (Unhealthy for Sensitive Groups)
44 (Unhealthy for Sensitive Groups)
45 (Unhealthy for Sensitive Groups)
45 (Unhealthy for Sensitive Groups)
39 (Unhealthy for Sensitive Groups)
24 (Moderate)
27 (Moderate)
21 (Moderate)
20 (Moderate)
28 (Moderate)
40 (Unhealthy for Sensitive Groups)
51 (Unhealthy for Sensitive Groups)
38 (Unhealthy for Sensitive Groups)
31 (Moderate)
47 (Unhealthy for Sensitive Groups)
34 (Moderate)
24 (Moderate)
35 (Unhealthy for Sensitive Groups)
69 (Unhealthy)
103 (Very Unhealthy)
no2
8.7 (Good)
6.2 (Good)
13 (Good)
26 (Good)
36 (Good)
32 (Good)
30 (Good)
29 (Good)
29 (Good)
30 (Good)
30 (Good)
16 (Good)
20 (Good)
23 (Good)
36 (Good)
26 (Good)
15 (Good)
14 (Good)
12 (Good)
16 (Good)
17 (Good)
so2
3.8 (Good)
3.6 (Good)
3.4 (Good)
3.4 (Good)
3.4 (Good)
5.1 (Good)
6.6 (Good)
4.2 (Good)
3.2 (Good)
3.3 (Good)
5.5 (Good)
3.3 (Good)
3.3 (Good)
3.1 (Good)
9.4 (Good)
11 (Good)
10 (Good)
6.6 (Good)
7.7 (Good)
7 (Good)
8.9 (Good)
co
976 (Good)
876 (Good)
965 (Good)
1 (Good)
1 (Good)
1 (Good)
1 (Good)
989 (Good)
1 (Good)
776 (Good)
735 (Good)
831 (Good)
882 (Good)
864 (Good)
733 (Good)
411 (Good)
692 (Good)
748 (Good)
760 (Good)
17 (Good)
40 (Good)
data source »
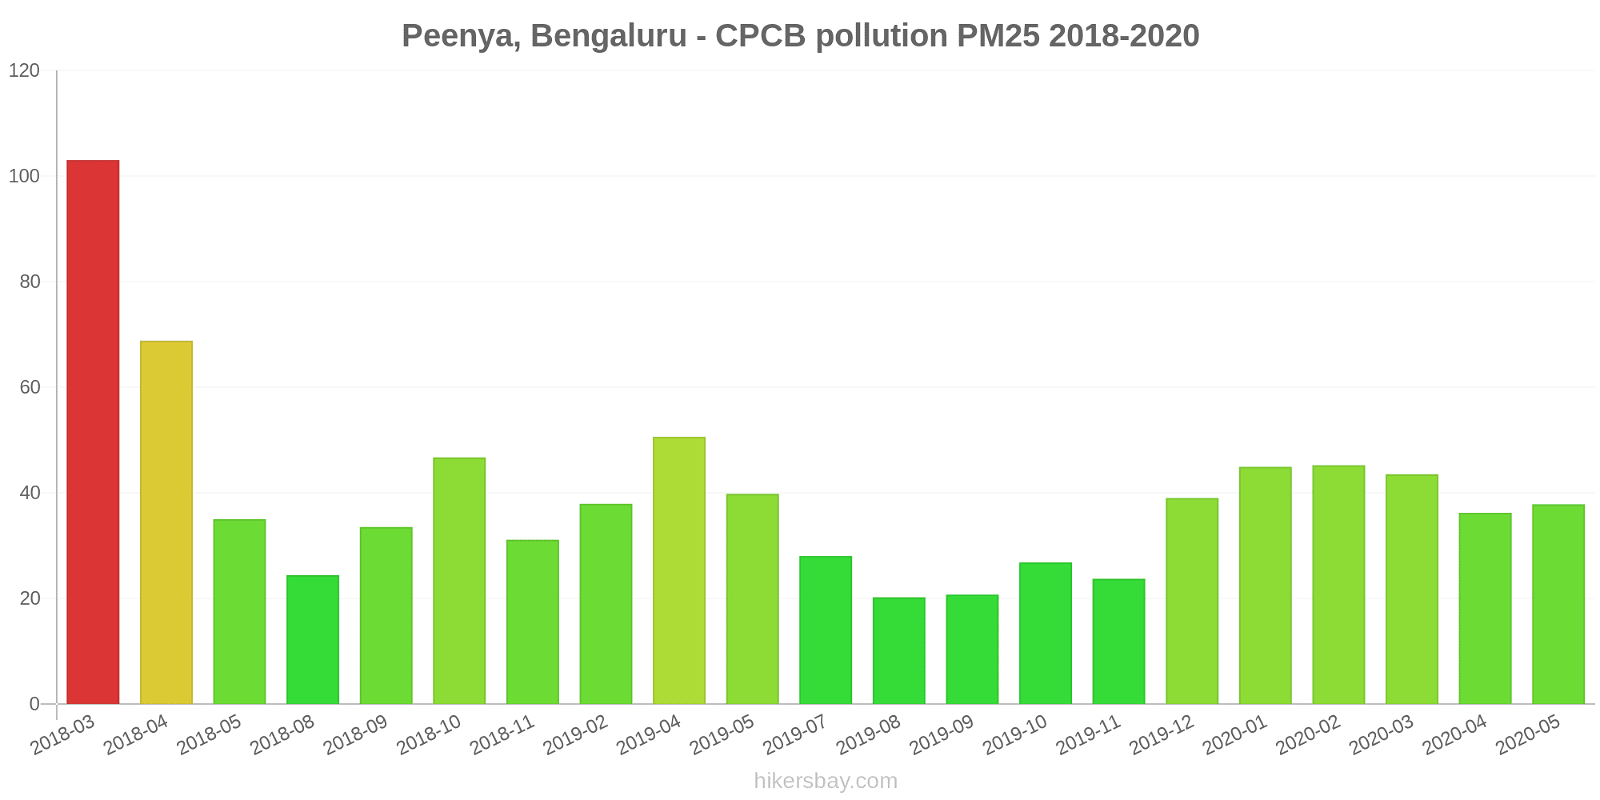
Peenya, Bengaluru - CPCB
Monday, October 31, 2022, 1:45 AM
PM10 65 (Unhealthy for Sensitive Groups)
particulate matter (PM10) suspended dust
SO2 6.2 (Good)
sulfur dioxide (SO2)
O3 23 (Good)
ozone (O3)
CO 630 (Good)
carbon monoxide (CO)
NO2 32 (Good)
nitrogen dioxide (NO2)
PM2,5 51 (Unhealthy for Sensitive Groups)
particulate matter (PM2.5) dust
Peenya, Bengaluru - CPCB
index
2022-10-31
pm10
65
so2
5.8
o3
23
co
630
no2
32
pm25
51
Peenya, Bengaluru - CPCB
2018-03 2020-05
index
2020-05
2020-04
2020-03
2020-02
2020-01
2019-12
2019-11
2019-10
2019-09
2019-08
2019-07
2019-05
2019-04
2019-02
2018-11
2018-10
2018-09
2018-08
2018-05
2018-04
2018-03
pm25
38
36
44
45
45
39
24
27
21
20
28
40
51
38
31
47
34
24
35
69
103
no2
8.7
6.2
13
26
36
32
30
29
29
30
30
16
20
23
36
26
15
14
12
16
17
so2
3.8
3.6
3.4
3.4
3.4
5.1
6.6
4.2
3.2
3.3
5.5
3.3
3.3
3.1
9.4
11
10
6.6
7.7
7
8.9
co
976
876
965
1
1
1
1
989
1
776
735
831
882
864
733
411
692
748
760
17
40
* Pollution data source:
https://openaq.org
(caaqm)
The data is licensed under CC-By 4.0
PM10 65 (Unhealthy for Sensitive Groups)
SO2 6 (Good)
O3 23 (Good)
CO 630 (Good)
NO2 32 (Good)
PM2,5 51 (Unhealthy for Sensitive Groups)
Data on air pollution from recent days in Tippanhalli
| index | 2022-10-31 |
|---|---|
| pm10 | 65 Unhealthy for Sensitive Groups |
| so2 | 6 Good |
| o3 | 23 Good |
| co | 630 Good |
| no2 | 32 Good |
| pm25 | 51 Unhealthy for Sensitive Groups |

| index | 2020-05 | 2020-04 | 2020-03 | 2020-02 | 2020-01 | 2019-12 | 2019-11 | 2019-10 | 2019-09 | 2019-08 | 2019-07 | 2019-05 | 2019-04 | 2019-02 | 2018-11 | 2018-10 | 2018-09 | 2018-08 | 2018-05 | 2018-04 | 2018-03 |
|---|---|---|---|---|---|---|---|---|---|---|---|---|---|---|---|---|---|---|---|---|---|
| pm25 | 38 (Unhealthy for Sensitive Groups) | 36 (Unhealthy for Sensitive Groups) | 44 (Unhealthy for Sensitive Groups) | 45 (Unhealthy for Sensitive Groups) | 45 (Unhealthy for Sensitive Groups) | 39 (Unhealthy for Sensitive Groups) | 24 (Moderate) | 27 (Moderate) | 21 (Moderate) | 20 (Moderate) | 28 (Moderate) | 40 (Unhealthy for Sensitive Groups) | 51 (Unhealthy for Sensitive Groups) | 38 (Unhealthy for Sensitive Groups) | 31 (Moderate) | 47 (Unhealthy for Sensitive Groups) | 34 (Moderate) | 24 (Moderate) | 35 (Unhealthy for Sensitive Groups) | 69 (Unhealthy) | 103 (Very Unhealthy) |
| no2 | 8.7 (Good) | 6.2 (Good) | 13 (Good) | 26 (Good) | 36 (Good) | 32 (Good) | 30 (Good) | 29 (Good) | 29 (Good) | 30 (Good) | 30 (Good) | 16 (Good) | 20 (Good) | 23 (Good) | 36 (Good) | 26 (Good) | 15 (Good) | 14 (Good) | 12 (Good) | 16 (Good) | 17 (Good) |
| so2 | 3.8 (Good) | 3.6 (Good) | 3.4 (Good) | 3.4 (Good) | 3.4 (Good) | 5.1 (Good) | 6.6 (Good) | 4.2 (Good) | 3.2 (Good) | 3.3 (Good) | 5.5 (Good) | 3.3 (Good) | 3.3 (Good) | 3.1 (Good) | 9.4 (Good) | 11 (Good) | 10 (Good) | 6.6 (Good) | 7.7 (Good) | 7 (Good) | 8.9 (Good) |
| co | 976 (Good) | 876 (Good) | 965 (Good) | 1 (Good) | 1 (Good) | 1 (Good) | 1 (Good) | 989 (Good) | 1 (Good) | 776 (Good) | 735 (Good) | 831 (Good) | 882 (Good) | 864 (Good) | 733 (Good) | 411 (Good) | 692 (Good) | 748 (Good) | 760 (Good) | 17 (Good) | 40 (Good) |
PM10 65 (Unhealthy for Sensitive Groups)
particulate matter (PM10) suspended dustSO2 6.2 (Good)
sulfur dioxide (SO2)O3 23 (Good)
ozone (O3)CO 630 (Good)
carbon monoxide (CO)NO2 32 (Good)
nitrogen dioxide (NO2)PM2,5 51 (Unhealthy for Sensitive Groups)
particulate matter (PM2.5) dustPeenya, Bengaluru - CPCB
| index | 2022-10-31 |
|---|---|
| pm10 | 65 |
| so2 | 5.8 |
| o3 | 23 |
| co | 630 |
| no2 | 32 |
| pm25 | 51 |
Peenya, Bengaluru - CPCB

| index | 2020-05 | 2020-04 | 2020-03 | 2020-02 | 2020-01 | 2019-12 | 2019-11 | 2019-10 | 2019-09 | 2019-08 | 2019-07 | 2019-05 | 2019-04 | 2019-02 | 2018-11 | 2018-10 | 2018-09 | 2018-08 | 2018-05 | 2018-04 | 2018-03 |
|---|---|---|---|---|---|---|---|---|---|---|---|---|---|---|---|---|---|---|---|---|---|
| pm25 | 38 | 36 | 44 | 45 | 45 | 39 | 24 | 27 | 21 | 20 | 28 | 40 | 51 | 38 | 31 | 47 | 34 | 24 | 35 | 69 | 103 |
| no2 | 8.7 | 6.2 | 13 | 26 | 36 | 32 | 30 | 29 | 29 | 30 | 30 | 16 | 20 | 23 | 36 | 26 | 15 | 14 | 12 | 16 | 17 |
| so2 | 3.8 | 3.6 | 3.4 | 3.4 | 3.4 | 5.1 | 6.6 | 4.2 | 3.2 | 3.3 | 5.5 | 3.3 | 3.3 | 3.1 | 9.4 | 11 | 10 | 6.6 | 7.7 | 7 | 8.9 |
| co | 976 | 876 | 965 | 1 | 1 | 1 | 1 | 989 | 1 | 776 | 735 | 831 | 882 | 864 | 733 | 411 | 692 | 748 | 760 | 17 | 40 |