Air Pollution in Tārāpur: Real-time Air Quality Index and smog alert.
Pollution and air quality forecast for Tārāpur. Today is Wednesday, May 13, 2026. The following air pollution values have been recorded for Tārāpur:- particulate matter (PM10) suspended dust - 289 (Very bad Hazardous)
- ozone (O3) - 24 (Good)
- particulate matter (PM2.5) dust - 120 (Very bad Hazardous)
- sulfur dioxide (SO2) - 14 (Good)
- carbon monoxide (CO) - 1050 (Good)
- nitrogen dioxide (NO2) - 11 (Good)

What is the air quality in Tārāpur today? Is the air polluted in Tārāpur?. Is there smog?
What is the level of PM10 today in Tārāpur? (particulate matter (PM10) suspended dust)
The current level of particulate matter PM10 in Tārāpur is:
289 (Very bad Hazardous)
The highest PM10 values usually occur in month: 241 (May 2019).
The lowest value of particulate matter PM10 pollution in Tārāpur is usually recorded in: September (51).
How is the O3 level today in Tārāpur? (ozone (O3))
24 (Good)
What is the current level of PM2.5 in Tārāpur? (particulate matter (PM2.5) dust)
Today's PM2.5 level is:
120 (Very bad Hazardous)
For comparison, the highest level of PM2.5 in Tārāpur in the last 7 days was: 116 (Monday, October 31, 2022) and the lowest: 116 (Monday, October 31, 2022).
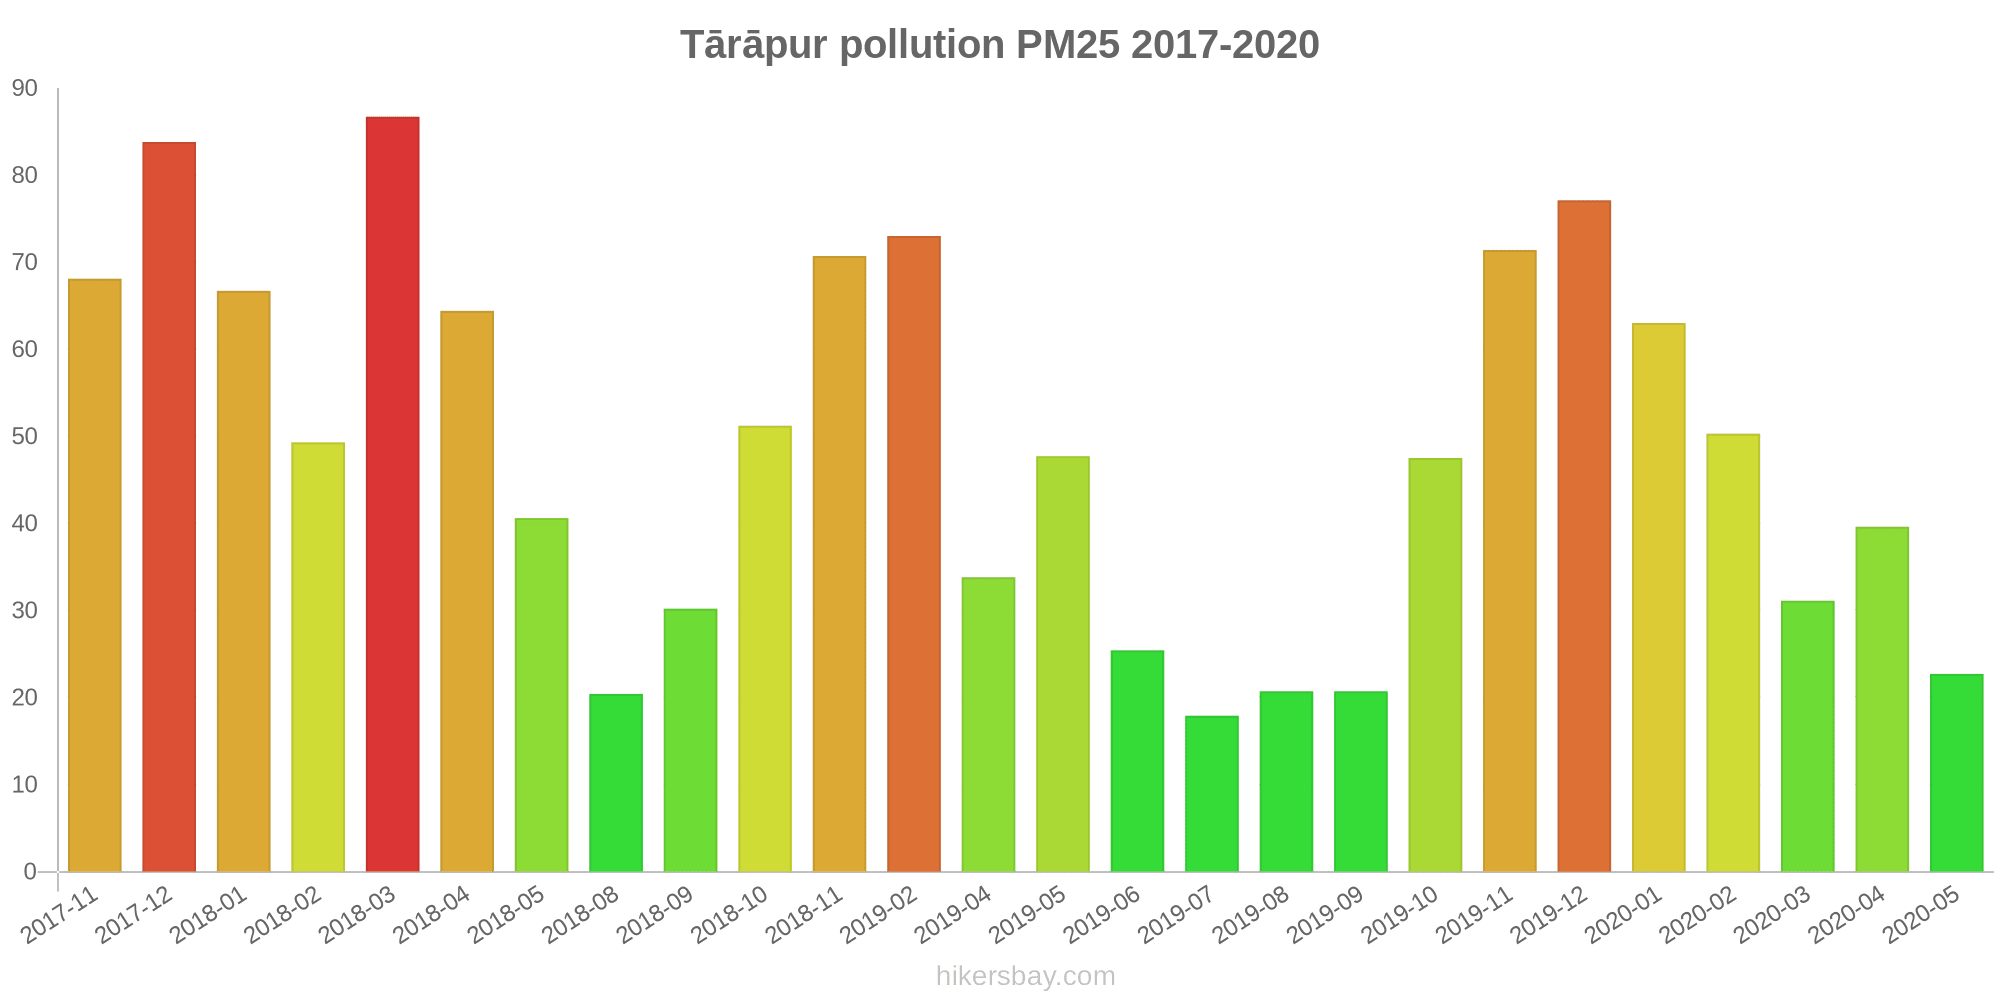
The highest PM2.5 values were recorded: 87 (March 2018).
The lowest level of particulate matter PM2.5 pollution occurs in month: July (18).
What is the level of SO2 pollution? (sulfur dioxide (SO2))
14 (Good)
How high is the CO level? (carbon monoxide (CO))
1050 (Good)
How high is the level of NO2? (nitrogen dioxide (NO2))
11 (Good)
Current data Monday, October 31, 2022, 2:00 AM
PM10 289 (Very bad Hazardous)
O3 24 (Good)
PM2,5 120 (Very bad Hazardous)
SO2 14 (Good)
CO 1050 (Good)
NO2 11 (Good)
Data on air pollution from recent days in Tārāpur
index
2022-10-31
pm10
322
Very bad Hazardous
o3
24
Good
pm25
116
Very bad Hazardous
so2
14
Good
co
1050
Good
no2
10
Good
data source »
Air pollution in Tārāpur from November 2017 to May 2020

index
2020-05
2020-04
2020-03
2020-02
2020-01
2019-12
2019-11
2019-10
2019-09
2019-08
2019-07
2019-06
2019-05
2019-04
2019-02
2018-11
2018-10
2018-09
2018-08
2018-05
2018-04
2018-03
2018-02
2018-01
2017-12
2017-11
pm25
23 (Moderate)
40 (Unhealthy for Sensitive Groups)
31 (Moderate)
50 (Unhealthy for Sensitive Groups)
63 (Unhealthy)
77 (Very Unhealthy)
71 (Unhealthy)
48 (Unhealthy for Sensitive Groups)
21 (Moderate)
21 (Moderate)
18 (Moderate)
25 (Moderate)
48 (Unhealthy for Sensitive Groups)
34 (Moderate)
73 (Unhealthy)
71 (Unhealthy)
51 (Unhealthy for Sensitive Groups)
30 (Moderate)
20 (Moderate)
41 (Unhealthy for Sensitive Groups)
64 (Unhealthy)
87 (Very Unhealthy)
49 (Unhealthy for Sensitive Groups)
67 (Unhealthy)
84 (Very Unhealthy)
68 (Unhealthy)
pm10
117 (Very Unhealthy)
119 (Very Unhealthy)
115 (Very Unhealthy)
126 (Very Unhealthy)
127 (Very Unhealthy)
137 (Very Unhealthy)
137 (Very Unhealthy)
107 (Unhealthy)
51 (Unhealthy for Sensitive Groups)
58 (Unhealthy for Sensitive Groups)
60 (Unhealthy for Sensitive Groups)
72 (Unhealthy for Sensitive Groups)
241 (Very bad Hazardous)
160 (Very bad Hazardous)
161 (Very bad Hazardous)
153 (Very bad Hazardous)
156 (Very bad Hazardous)
101 (Unhealthy)
59 (Unhealthy for Sensitive Groups)
159 (Very bad Hazardous)
150 (Very bad Hazardous)
132 (Very Unhealthy)
137 (Very Unhealthy)
137 (Very Unhealthy)
148 (Very Unhealthy)
145 (Very Unhealthy)
no2
8.5 (Good)
9.6 (Good)
12 (Good)
18 (Good)
17 (Good)
18 (Good)
17 (Good)
11 (Good)
8.4 (Good)
4.4 (Good)
6.5 (Good)
8.5 (Good)
7.2 (Good)
7.5 (Good)
21 (Good)
15 (Good)
14 (Good)
7.2 (Good)
5.1 (Good)
7.2 (Good)
8 (Good)
15 (Good)
19 (Good)
18 (Good)
20 (Good)
18 (Good)
so2
12 (Good)
10 (Good)
11 (Good)
18 (Good)
15 (Good)
14 (Good)
24 (Good)
13 (Good)
5.7 (Good)
4.9 (Good)
3.9 (Good)
5.5 (Good)
15 (Good)
12 (Good)
43 (Good)
20 (Good)
18 (Good)
9 (Good)
8.8 (Good)
16 (Good)
14 (Good)
20 (Good)
22 (Good)
23 (Good)
33 (Good)
40 (Good)
co
633 (Good)
1 (Good)
1 (Good)
1 (Good)
921 (Good)
547 (Good)
642 (Good)
499 (Good)
395 (Good)
276 (Good)
313 (Good)
352 (Good)
267 (Good)
273 (Good)
659 (Good)
599 (Good)
522 (Good)
314 (Good)
283 (Good)
1 (Good)
29 (Good)
51 (Good)
1 (Good)
813 (Good)
1 (Good)
988 (Good)
o3
12 (Good)
12 (Good)
12 (Good)
14 (Good)
14 (Good)
12 (Good)
13 (Good)
13 (Good)
8.1 (Good)
8.4 (Good)
12 (Good)
19 (Good)
23 (Good)
24 (Good)
39 (Good)
99 (Moderate)
77 (Moderate)
41 (Good)
27 (Good)
52 (Good)
59 (Good)
70 (Moderate)
97 (Moderate)
102 (Moderate)
100 (Moderate)
134 (Unhealthy for Sensitive Groups)
data source »
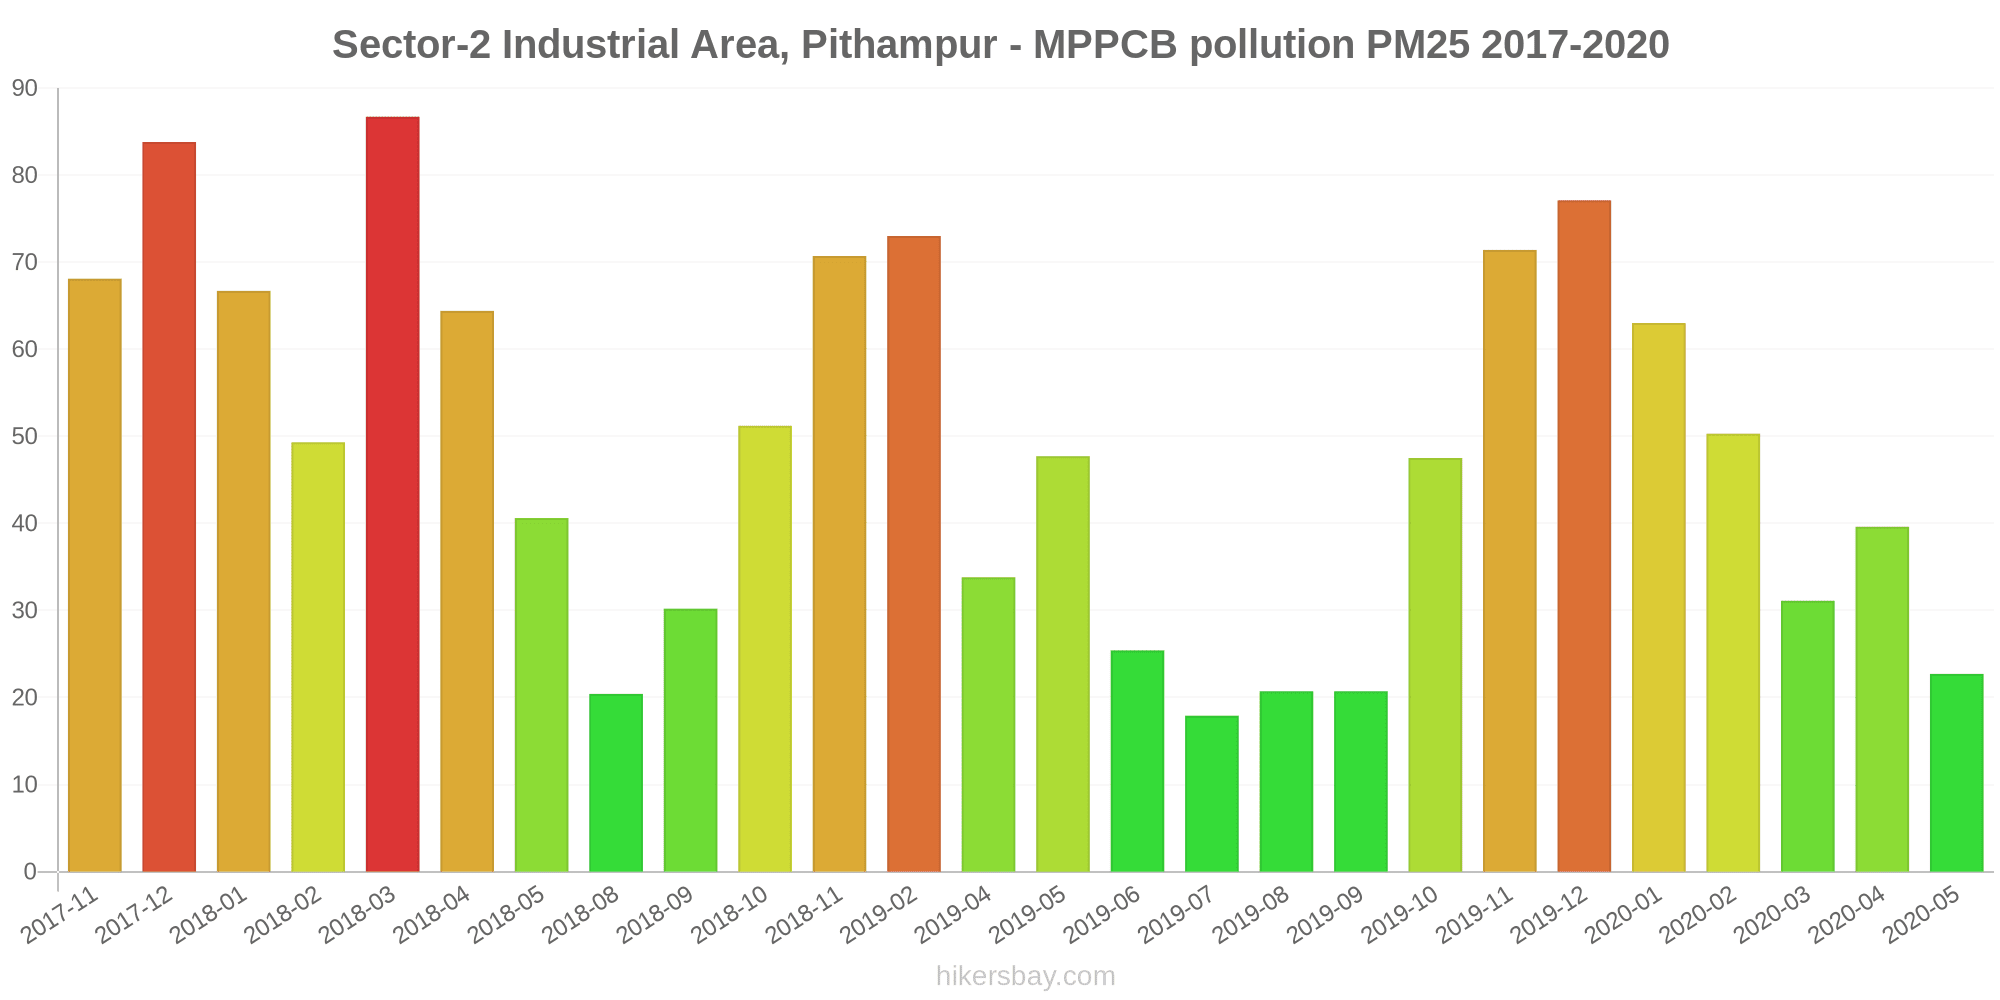
Sector-2 Industrial Area, Pithampur - MPPCB
Monday, October 31, 2022, 2:00 AM
PM10 289 (Very bad Hazardous)
particulate matter (PM10) suspended dust
O3 24 (Good)
ozone (O3)
PM2,5 120 (Very bad Hazardous)
particulate matter (PM2.5) dust
SO2 14 (Good)
sulfur dioxide (SO2)
CO 1050 (Good)
carbon monoxide (CO)
NO2 11 (Good)
nitrogen dioxide (NO2)
Sector-2 Industrial Area, Pithampur - MPPCB
index
2022-10-31
pm10
322
o3
24
pm25
116
so2
14
co
1050
no2
10
Sector-2 Industrial Area, Pithampur - MPPCB
2017-11 2020-05

index
2020-05
2020-04
2020-03
2020-02
2020-01
2019-12
2019-11
2019-10
2019-09
2019-08
2019-07
2019-06
2019-05
2019-04
2019-02
2018-11
2018-10
2018-09
2018-08
2018-05
2018-04
2018-03
2018-02
2018-01
2017-12
2017-11
no2
8.5
9.6
12
18
17
18
17
11
8.4
4.4
6.5
8.5
7.2
7.5
21
15
14
7.2
5.1
7.2
8
15
19
18
20
18
so2
12
10
11
18
15
14
24
13
5.7
4.9
3.9
5.5
15
12
43
20
18
9
8.8
16
14
20
22
23
33
40
co
633
1
1
1
921
547
642
499
395
276
313
352
267
273
659
599
522
314
283
1
29
51
1
813
1
988
o3
12
12
12
14
14
12
13
13
8.1
8.4
12
19
23
24
39
99
77
41
27
52
59
70
97
102
100
134
pm10
117
119
115
126
127
137
137
107
51
58
60
72
241
160
161
153
156
101
59
159
150
132
137
137
148
145
pm25
23
40
31
50
63
77
71
48
21
21
18
25
48
34
73
71
51
30
20
41
64
87
49
67
84
68
* Pollution data source:
https://openaq.org
(caaqm)
The data is licensed under CC-By 4.0
PM10 289 (Very bad Hazardous)
O3 24 (Good)
PM2,5 120 (Very bad Hazardous)
SO2 14 (Good)
CO 1050 (Good)
NO2 11 (Good)
Data on air pollution from recent days in Tārāpur
| index | 2022-10-31 |
|---|---|
| pm10 | 322 Very bad Hazardous |
| o3 | 24 Good |
| pm25 | 116 Very bad Hazardous |
| so2 | 14 Good |
| co | 1050 Good |
| no2 | 10 Good |
| index | 2020-05 | 2020-04 | 2020-03 | 2020-02 | 2020-01 | 2019-12 | 2019-11 | 2019-10 | 2019-09 | 2019-08 | 2019-07 | 2019-06 | 2019-05 | 2019-04 | 2019-02 | 2018-11 | 2018-10 | 2018-09 | 2018-08 | 2018-05 | 2018-04 | 2018-03 | 2018-02 | 2018-01 | 2017-12 | 2017-11 |
|---|---|---|---|---|---|---|---|---|---|---|---|---|---|---|---|---|---|---|---|---|---|---|---|---|---|---|
| pm25 | 23 (Moderate) | 40 (Unhealthy for Sensitive Groups) | 31 (Moderate) | 50 (Unhealthy for Sensitive Groups) | 63 (Unhealthy) | 77 (Very Unhealthy) | 71 (Unhealthy) | 48 (Unhealthy for Sensitive Groups) | 21 (Moderate) | 21 (Moderate) | 18 (Moderate) | 25 (Moderate) | 48 (Unhealthy for Sensitive Groups) | 34 (Moderate) | 73 (Unhealthy) | 71 (Unhealthy) | 51 (Unhealthy for Sensitive Groups) | 30 (Moderate) | 20 (Moderate) | 41 (Unhealthy for Sensitive Groups) | 64 (Unhealthy) | 87 (Very Unhealthy) | 49 (Unhealthy for Sensitive Groups) | 67 (Unhealthy) | 84 (Very Unhealthy) | 68 (Unhealthy) |
| pm10 | 117 (Very Unhealthy) | 119 (Very Unhealthy) | 115 (Very Unhealthy) | 126 (Very Unhealthy) | 127 (Very Unhealthy) | 137 (Very Unhealthy) | 137 (Very Unhealthy) | 107 (Unhealthy) | 51 (Unhealthy for Sensitive Groups) | 58 (Unhealthy for Sensitive Groups) | 60 (Unhealthy for Sensitive Groups) | 72 (Unhealthy for Sensitive Groups) | 241 (Very bad Hazardous) | 160 (Very bad Hazardous) | 161 (Very bad Hazardous) | 153 (Very bad Hazardous) | 156 (Very bad Hazardous) | 101 (Unhealthy) | 59 (Unhealthy for Sensitive Groups) | 159 (Very bad Hazardous) | 150 (Very bad Hazardous) | 132 (Very Unhealthy) | 137 (Very Unhealthy) | 137 (Very Unhealthy) | 148 (Very Unhealthy) | 145 (Very Unhealthy) |
| no2 | 8.5 (Good) | 9.6 (Good) | 12 (Good) | 18 (Good) | 17 (Good) | 18 (Good) | 17 (Good) | 11 (Good) | 8.4 (Good) | 4.4 (Good) | 6.5 (Good) | 8.5 (Good) | 7.2 (Good) | 7.5 (Good) | 21 (Good) | 15 (Good) | 14 (Good) | 7.2 (Good) | 5.1 (Good) | 7.2 (Good) | 8 (Good) | 15 (Good) | 19 (Good) | 18 (Good) | 20 (Good) | 18 (Good) |
| so2 | 12 (Good) | 10 (Good) | 11 (Good) | 18 (Good) | 15 (Good) | 14 (Good) | 24 (Good) | 13 (Good) | 5.7 (Good) | 4.9 (Good) | 3.9 (Good) | 5.5 (Good) | 15 (Good) | 12 (Good) | 43 (Good) | 20 (Good) | 18 (Good) | 9 (Good) | 8.8 (Good) | 16 (Good) | 14 (Good) | 20 (Good) | 22 (Good) | 23 (Good) | 33 (Good) | 40 (Good) |
| co | 633 (Good) | 1 (Good) | 1 (Good) | 1 (Good) | 921 (Good) | 547 (Good) | 642 (Good) | 499 (Good) | 395 (Good) | 276 (Good) | 313 (Good) | 352 (Good) | 267 (Good) | 273 (Good) | 659 (Good) | 599 (Good) | 522 (Good) | 314 (Good) | 283 (Good) | 1 (Good) | 29 (Good) | 51 (Good) | 1 (Good) | 813 (Good) | 1 (Good) | 988 (Good) |
| o3 | 12 (Good) | 12 (Good) | 12 (Good) | 14 (Good) | 14 (Good) | 12 (Good) | 13 (Good) | 13 (Good) | 8.1 (Good) | 8.4 (Good) | 12 (Good) | 19 (Good) | 23 (Good) | 24 (Good) | 39 (Good) | 99 (Moderate) | 77 (Moderate) | 41 (Good) | 27 (Good) | 52 (Good) | 59 (Good) | 70 (Moderate) | 97 (Moderate) | 102 (Moderate) | 100 (Moderate) | 134 (Unhealthy for Sensitive Groups) |
PM10 289 (Very bad Hazardous)
particulate matter (PM10) suspended dustO3 24 (Good)
ozone (O3)PM2,5 120 (Very bad Hazardous)
particulate matter (PM2.5) dustSO2 14 (Good)
sulfur dioxide (SO2)CO 1050 (Good)
carbon monoxide (CO)NO2 11 (Good)
nitrogen dioxide (NO2)Sector-2 Industrial Area, Pithampur - MPPCB
| index | 2022-10-31 |
|---|---|
| pm10 | 322 |
| o3 | 24 |
| pm25 | 116 |
| so2 | 14 |
| co | 1050 |
| no2 | 10 |
Sector-2 Industrial Area, Pithampur - MPPCB
| index | 2020-05 | 2020-04 | 2020-03 | 2020-02 | 2020-01 | 2019-12 | 2019-11 | 2019-10 | 2019-09 | 2019-08 | 2019-07 | 2019-06 | 2019-05 | 2019-04 | 2019-02 | 2018-11 | 2018-10 | 2018-09 | 2018-08 | 2018-05 | 2018-04 | 2018-03 | 2018-02 | 2018-01 | 2017-12 | 2017-11 |
|---|---|---|---|---|---|---|---|---|---|---|---|---|---|---|---|---|---|---|---|---|---|---|---|---|---|---|
| no2 | 8.5 | 9.6 | 12 | 18 | 17 | 18 | 17 | 11 | 8.4 | 4.4 | 6.5 | 8.5 | 7.2 | 7.5 | 21 | 15 | 14 | 7.2 | 5.1 | 7.2 | 8 | 15 | 19 | 18 | 20 | 18 |
| so2 | 12 | 10 | 11 | 18 | 15 | 14 | 24 | 13 | 5.7 | 4.9 | 3.9 | 5.5 | 15 | 12 | 43 | 20 | 18 | 9 | 8.8 | 16 | 14 | 20 | 22 | 23 | 33 | 40 |
| co | 633 | 1 | 1 | 1 | 921 | 547 | 642 | 499 | 395 | 276 | 313 | 352 | 267 | 273 | 659 | 599 | 522 | 314 | 283 | 1 | 29 | 51 | 1 | 813 | 1 | 988 |
| o3 | 12 | 12 | 12 | 14 | 14 | 12 | 13 | 13 | 8.1 | 8.4 | 12 | 19 | 23 | 24 | 39 | 99 | 77 | 41 | 27 | 52 | 59 | 70 | 97 | 102 | 100 | 134 |
| pm10 | 117 | 119 | 115 | 126 | 127 | 137 | 137 | 107 | 51 | 58 | 60 | 72 | 241 | 160 | 161 | 153 | 156 | 101 | 59 | 159 | 150 | 132 | 137 | 137 | 148 | 145 |
| pm25 | 23 | 40 | 31 | 50 | 63 | 77 | 71 | 48 | 21 | 21 | 18 | 25 | 48 | 34 | 73 | 71 | 51 | 30 | 20 | 41 | 64 | 87 | 49 | 67 | 84 | 68 |