Air Pollution in Kharkhari Raund: Real-time Air Quality Index and smog alert.
Pollution and air quality forecast for Kharkhari Raund. Today is Wednesday, May 13, 2026. The following air pollution values have been recorded for Kharkhari Raund:- particulate matter (PM2.5) dust - 204 (Very bad Hazardous)
- particulate matter (PM10) suspended dust - 282 (Very bad Hazardous)
- nitrogen dioxide (NO2) - 24 (Good)
- sulfur dioxide (SO2) - 1 (Good)
- carbon monoxide (CO) - 1400 (Good)
- ozone (O3) - 0 (Good)

What is the air quality in Kharkhari Raund today? Is the air polluted in Kharkhari Raund?. Is there smog?
What is the current level of PM2.5 in Kharkhari Raund? (particulate matter (PM2.5) dust)
Today's PM2.5 level is:
204 (Very bad Hazardous)
For comparison, the highest level of PM2.5 in Kharkhari Raund in the last 7 days was: 204 (Monday, October 31, 2022) and the lowest: 204 (Monday, October 31, 2022).
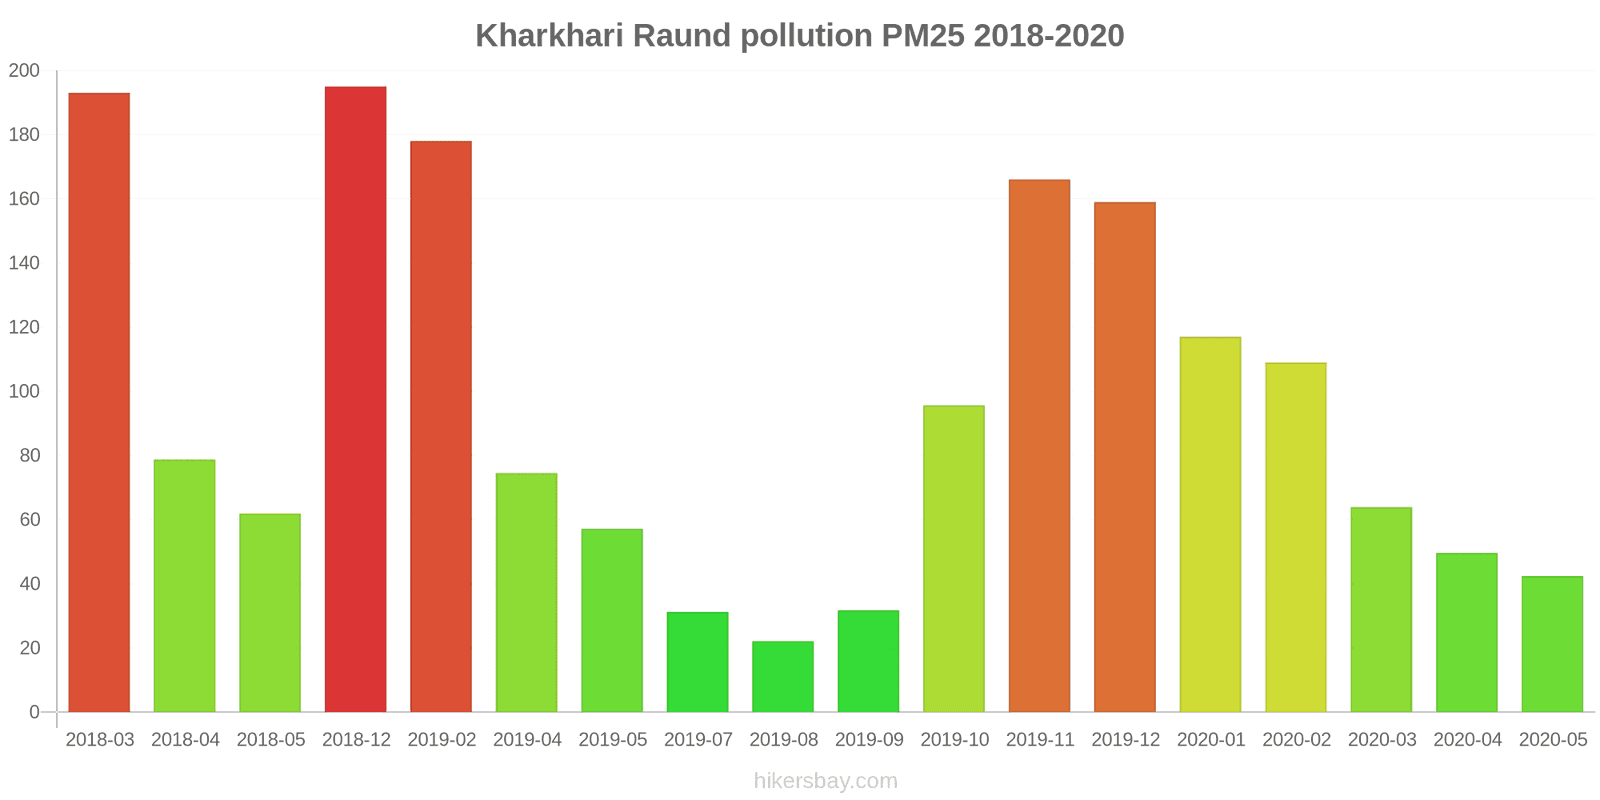
The highest PM2.5 values were recorded: 195 (December 2018).
The lowest level of particulate matter PM2.5 pollution occurs in month: August (22).
What is the level of PM10 today in Kharkhari Raund? (particulate matter (PM10) suspended dust)
The current level of particulate matter PM10 in Kharkhari Raund is:
282 (Very bad Hazardous)
The highest PM10 values usually occur in month: 260 (April 2019).
The lowest value of particulate matter PM10 pollution in Kharkhari Raund is usually recorded in: August (50).
How high is the level of NO2? (nitrogen dioxide (NO2))
24 (Good)
What is the level of SO2 pollution? (sulfur dioxide (SO2))
1 (Good)
How high is the CO level? (carbon monoxide (CO))
1400 (Good)
How is the O3 level today in Kharkhari Raund? (ozone (O3))
0 (Good)
Current data Monday, October 31, 2022, 12:45 AM
PM2,5 204 (Very bad Hazardous)
PM10 282 (Very bad Hazardous)
NO2 24 (Good)
SO2 1 (Good)
CO 1400 (Good)
O3 0 (Good)
Data on air pollution from recent days in Kharkhari Raund
index
2022-10-30
2022-10-31
o3
0
Good
-
Good
pm25
-
Good
204
Very bad Hazardous
pm10
-
Good
282
Very bad Hazardous
no2
-
Good
24
Good
so2
-
Good
1
Good
co
-
Good
1400
Good
data source »
Air pollution in Kharkhari Raund from March 2018 to May 2020
index
2020-05
2020-04
2020-03
2020-02
2020-01
2019-12
2019-11
2019-10
2019-09
2019-08
2019-07
2019-05
2019-04
2019-02
2018-12
2018-05
2018-04
2018-03
pm25
42 (Unhealthy for Sensitive Groups)
50 (Unhealthy for Sensitive Groups)
64 (Unhealthy)
109 (Very Unhealthy)
117 (Very bad Hazardous)
159 (Very bad Hazardous)
166 (Very bad Hazardous)
96 (Very Unhealthy)
32 (Moderate)
22 (Moderate)
31 (Moderate)
57 (Unhealthy)
75 (Unhealthy)
178 (Very bad Hazardous)
195 (Very bad Hazardous)
62 (Unhealthy)
79 (Very Unhealthy)
193 (Very bad Hazardous)
pm10
113 (Very Unhealthy)
142 (Very Unhealthy)
135 (Very Unhealthy)
171 (Very bad Hazardous)
157 (Very bad Hazardous)
222 (Very bad Hazardous)
235 (Very bad Hazardous)
176 (Very bad Hazardous)
70 (Unhealthy for Sensitive Groups)
50 (Moderate)
76 (Unhealthy for Sensitive Groups)
163 (Very bad Hazardous)
260 (Very bad Hazardous)
248 (Very bad Hazardous)
260 (Very bad Hazardous)
205 (Very bad Hazardous)
213 (Very bad Hazardous)
205 (Very bad Hazardous)
no2
10 (Good)
15 (Good)
23 (Good)
29 (Good)
29 (Good)
29 (Good)
14 (Good)
26 (Good)
25 (Good)
26 (Good)
26 (Good)
34 (Good)
43 (Moderate)
62 (Moderate)
54 (Moderate)
20 (Good)
27 (Good)
26 (Good)
so2
12 (Good)
13 (Good)
13 (Good)
11 (Good)
6.1 (Good)
6.8 (Good)
6.6 (Good)
9.1 (Good)
10 (Good)
9.5 (Good)
11 (Good)
20 (Good)
24 (Good)
13 (Good)
6.1 (Good)
4.2 (Good)
4.7 (Good)
9.9 (Good)
co
553 (Good)
495 (Good)
599 (Good)
804 (Good)
912 (Good)
996 (Good)
911 (Good)
1 (Good)
651 (Good)
1 (Good)
839 (Good)
367 (Good)
414 (Good)
801 (Good)
1 (Good)
1 (Good)
26 (Good)
29 (Good)
o3
26 (Good)
34 (Good)
46 (Good)
42 (Good)
21 (Good)
29 (Good)
12 (Good)
50 (Good)
33 (Good)
33 (Good)
41 (Good)
90 (Moderate)
66 (Good)
61 (Good)
32 (Good)
131 (Unhealthy for Sensitive Groups)
105 (Moderate)
55 (Good)
data source »
Najafgarh, Delhi - DPCC
Monday, October 31, 2022, 12:45 AM
PM2,5 204 (Very bad Hazardous)
particulate matter (PM2.5) dust
PM10 282 (Very bad Hazardous)
particulate matter (PM10) suspended dust
NO2 24 (Good)
nitrogen dioxide (NO2)
SO2 0.9 (Good)
sulfur dioxide (SO2)
CO 1400 (Good)
carbon monoxide (CO)
O3 0.2 (Good)
ozone (O3)
Najafgarh, Delhi - DPCC
index
2022-10-31
2022-10-30
o3
-
0.2
pm25
204
-
pm10
282
-
no2
24
-
so2
0.9
-
co
1400
-
Najafgarh, Delhi - DPCC
2018-03 2020-05

index
2020-05
2020-04
2020-03
2020-02
2020-01
2019-12
2019-11
2019-10
2019-09
2019-08
2019-07
2019-05
2019-04
2019-02
2018-12
2018-05
2018-04
2018-03
pm25
42
50
64
109
117
159
166
96
32
22
31
57
75
178
195
62
79
193
pm10
113
142
135
171
157
222
235
176
70
50
76
163
260
248
260
205
213
205
no2
10
15
23
29
29
29
14
26
25
26
26
34
43
62
54
20
27
26
so2
12
13
13
11
6.1
6.8
6.6
9.1
10
9.5
11
20
24
13
6.1
4.2
4.7
9.9
co
553
495
599
804
912
996
911
1
651
1
839
367
414
801
1
1
26
29
o3
26
34
46
42
21
29
12
50
33
33
41
90
66
61
32
131
105
55
* Pollution data source:
https://openaq.org
(caaqm)
The data is licensed under CC-By 4.0
PM2,5 204 (Very bad Hazardous)
PM10 282 (Very bad Hazardous)
NO2 24 (Good)
SO2 1 (Good)
CO 1400 (Good)
O3 0 (Good)
Data on air pollution from recent days in Kharkhari Raund
| index | 2022-10-30 | 2022-10-31 |
|---|---|---|
| o3 | 0 Good |
- Good |
| pm25 | - Good |
204 Very bad Hazardous |
| pm10 | - Good |
282 Very bad Hazardous |
| no2 | - Good |
24 Good |
| so2 | - Good |
1 Good |
| co | - Good |
1400 Good |

| index | 2020-05 | 2020-04 | 2020-03 | 2020-02 | 2020-01 | 2019-12 | 2019-11 | 2019-10 | 2019-09 | 2019-08 | 2019-07 | 2019-05 | 2019-04 | 2019-02 | 2018-12 | 2018-05 | 2018-04 | 2018-03 |
|---|---|---|---|---|---|---|---|---|---|---|---|---|---|---|---|---|---|---|
| pm25 | 42 (Unhealthy for Sensitive Groups) | 50 (Unhealthy for Sensitive Groups) | 64 (Unhealthy) | 109 (Very Unhealthy) | 117 (Very bad Hazardous) | 159 (Very bad Hazardous) | 166 (Very bad Hazardous) | 96 (Very Unhealthy) | 32 (Moderate) | 22 (Moderate) | 31 (Moderate) | 57 (Unhealthy) | 75 (Unhealthy) | 178 (Very bad Hazardous) | 195 (Very bad Hazardous) | 62 (Unhealthy) | 79 (Very Unhealthy) | 193 (Very bad Hazardous) |
| pm10 | 113 (Very Unhealthy) | 142 (Very Unhealthy) | 135 (Very Unhealthy) | 171 (Very bad Hazardous) | 157 (Very bad Hazardous) | 222 (Very bad Hazardous) | 235 (Very bad Hazardous) | 176 (Very bad Hazardous) | 70 (Unhealthy for Sensitive Groups) | 50 (Moderate) | 76 (Unhealthy for Sensitive Groups) | 163 (Very bad Hazardous) | 260 (Very bad Hazardous) | 248 (Very bad Hazardous) | 260 (Very bad Hazardous) | 205 (Very bad Hazardous) | 213 (Very bad Hazardous) | 205 (Very bad Hazardous) |
| no2 | 10 (Good) | 15 (Good) | 23 (Good) | 29 (Good) | 29 (Good) | 29 (Good) | 14 (Good) | 26 (Good) | 25 (Good) | 26 (Good) | 26 (Good) | 34 (Good) | 43 (Moderate) | 62 (Moderate) | 54 (Moderate) | 20 (Good) | 27 (Good) | 26 (Good) |
| so2 | 12 (Good) | 13 (Good) | 13 (Good) | 11 (Good) | 6.1 (Good) | 6.8 (Good) | 6.6 (Good) | 9.1 (Good) | 10 (Good) | 9.5 (Good) | 11 (Good) | 20 (Good) | 24 (Good) | 13 (Good) | 6.1 (Good) | 4.2 (Good) | 4.7 (Good) | 9.9 (Good) |
| co | 553 (Good) | 495 (Good) | 599 (Good) | 804 (Good) | 912 (Good) | 996 (Good) | 911 (Good) | 1 (Good) | 651 (Good) | 1 (Good) | 839 (Good) | 367 (Good) | 414 (Good) | 801 (Good) | 1 (Good) | 1 (Good) | 26 (Good) | 29 (Good) |
| o3 | 26 (Good) | 34 (Good) | 46 (Good) | 42 (Good) | 21 (Good) | 29 (Good) | 12 (Good) | 50 (Good) | 33 (Good) | 33 (Good) | 41 (Good) | 90 (Moderate) | 66 (Good) | 61 (Good) | 32 (Good) | 131 (Unhealthy for Sensitive Groups) | 105 (Moderate) | 55 (Good) |
PM2,5 204 (Very bad Hazardous)
particulate matter (PM2.5) dustPM10 282 (Very bad Hazardous)
particulate matter (PM10) suspended dustNO2 24 (Good)
nitrogen dioxide (NO2)SO2 0.9 (Good)
sulfur dioxide (SO2)CO 1400 (Good)
carbon monoxide (CO)O3 0.2 (Good)
ozone (O3)Najafgarh, Delhi - DPCC
| index | 2022-10-31 | 2022-10-30 |
|---|---|---|
| o3 | - | 0.2 |
| pm25 | 204 | - |
| pm10 | 282 | - |
| no2 | 24 | - |
| so2 | 0.9 | - |
| co | 1400 | - |
Najafgarh, Delhi - DPCC

| index | 2020-05 | 2020-04 | 2020-03 | 2020-02 | 2020-01 | 2019-12 | 2019-11 | 2019-10 | 2019-09 | 2019-08 | 2019-07 | 2019-05 | 2019-04 | 2019-02 | 2018-12 | 2018-05 | 2018-04 | 2018-03 |
|---|---|---|---|---|---|---|---|---|---|---|---|---|---|---|---|---|---|---|
| pm25 | 42 | 50 | 64 | 109 | 117 | 159 | 166 | 96 | 32 | 22 | 31 | 57 | 75 | 178 | 195 | 62 | 79 | 193 |
| pm10 | 113 | 142 | 135 | 171 | 157 | 222 | 235 | 176 | 70 | 50 | 76 | 163 | 260 | 248 | 260 | 205 | 213 | 205 |
| no2 | 10 | 15 | 23 | 29 | 29 | 29 | 14 | 26 | 25 | 26 | 26 | 34 | 43 | 62 | 54 | 20 | 27 | 26 |
| so2 | 12 | 13 | 13 | 11 | 6.1 | 6.8 | 6.6 | 9.1 | 10 | 9.5 | 11 | 20 | 24 | 13 | 6.1 | 4.2 | 4.7 | 9.9 |
| co | 553 | 495 | 599 | 804 | 912 | 996 | 911 | 1 | 651 | 1 | 839 | 367 | 414 | 801 | 1 | 1 | 26 | 29 |
| o3 | 26 | 34 | 46 | 42 | 21 | 29 | 12 | 50 | 33 | 33 | 41 | 90 | 66 | 61 | 32 | 131 | 105 | 55 |