Air Pollution in Barega: Real-time Air Quality Index and smog alert.
Pollution and air quality forecast for Barega. Today is Wednesday, May 13, 2026. The following air pollution values have been recorded for Barega:- nitrogen dioxide (NO2) - 12 (Good)
- particulate matter (PM10) suspended dust - 37 (Moderate)
- ozone (O3) - 10 (Good)
- sulfur dioxide (SO2) - 6 (Good)
- particulate matter (PM2.5) dust - 10 (Good)
- carbon monoxide (CO) - 560 (Good)

What is the air quality in Barega today? Is the air polluted in Barega?. Is there smog?
How high is the level of NO2? (nitrogen dioxide (NO2))
12 (Good)
What is the level of PM10 today in Barega? (particulate matter (PM10) suspended dust)
The current level of particulate matter PM10 in Barega is:
37 (Moderate)
The highest PM10 values usually occur in month: 173 (November 2019).
The lowest value of particulate matter PM10 pollution in Barega is usually recorded in: August (41).
How is the O3 level today in Barega? (ozone (O3))
10 (Good)
What is the level of SO2 pollution? (sulfur dioxide (SO2))
6 (Good)
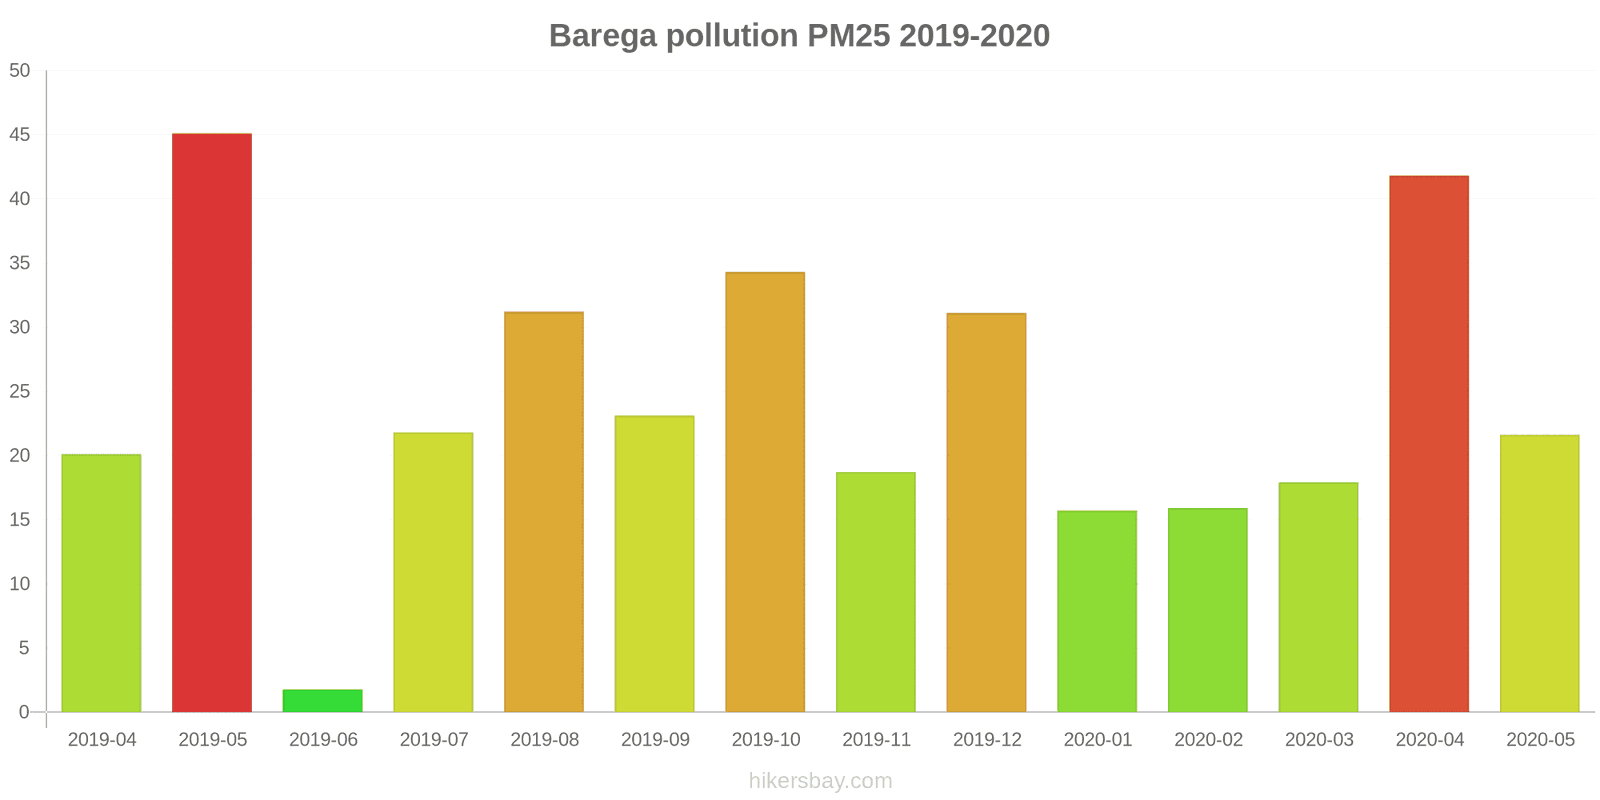
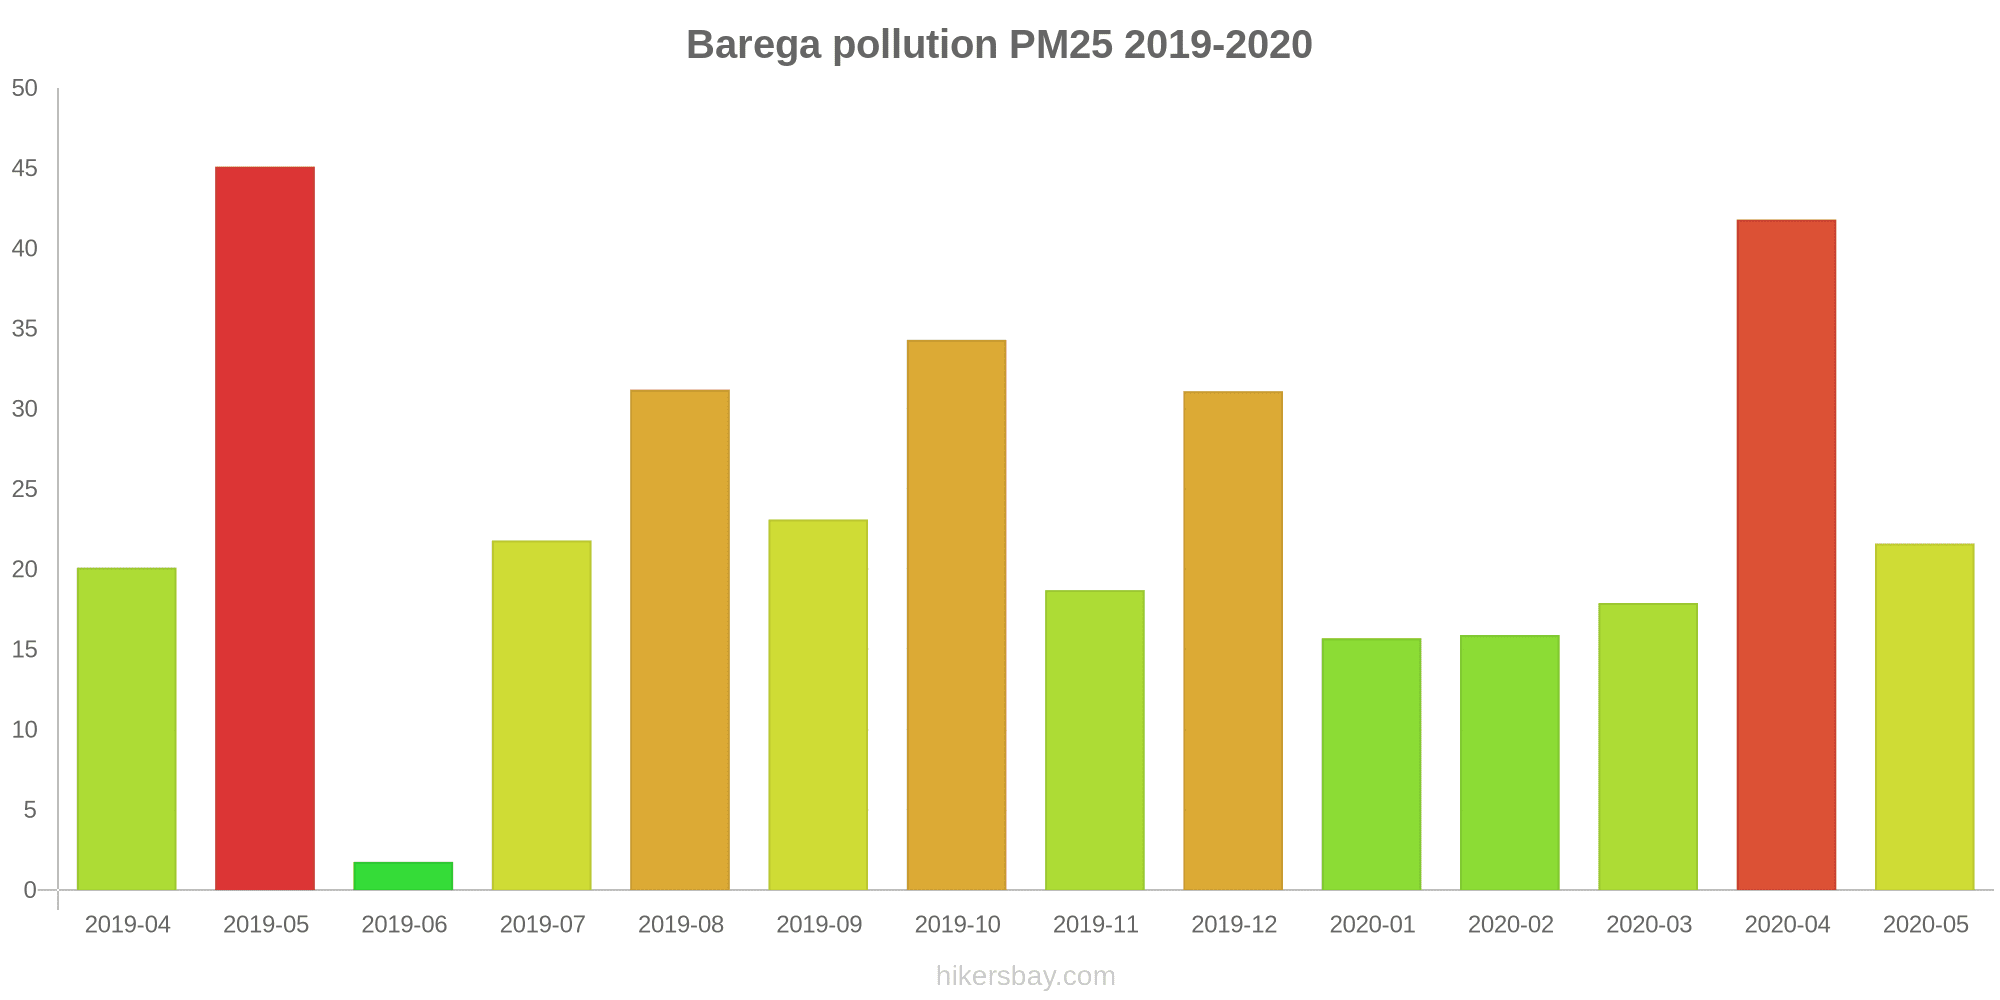
What is the current level of PM2.5 in Barega? (particulate matter (PM2.5) dust)
Today's PM2.5 level is:
10 (Good)
For comparison, the highest level of PM2.5 in Barega in the last 7 days was: 10 (Monday, October 31, 2022) and the lowest: 10 (Monday, October 31, 2022).
The highest PM2.5 values were recorded: 45 (May 2019).
The lowest level of particulate matter PM2.5 pollution occurs in month: June (1.8).
How high is the CO level? (carbon monoxide (CO))
560 (Good)
Current data Monday, October 31, 2022, 2:00 AM
NO2 12 (Good)
PM10 37 (Moderate)
O3 10 (Good)
SO2 6 (Good)
PM2,5 10 (Good)
CO 560 (Good)
Data on air pollution from recent days in Barega
index
2022-10-31
no2
12
Good
pm10
38
Moderate
o3
8
Good
so2
5
Good
pm25
10
Good
co
490
Good
data source »
Air pollution in Barega from April 2019 to May 2020
index
2020-05
2020-04
2020-03
2020-02
2020-01
2019-12
2019-11
2019-10
2019-09
2019-08
2019-07
2019-06
2019-05
2019-04
pm25
22 (Moderate)
42 (Unhealthy for Sensitive Groups)
18 (Moderate)
16 (Moderate)
16 (Moderate)
31 (Moderate)
19 (Moderate)
34 (Moderate)
23 (Moderate)
31 (Moderate)
22 (Moderate)
1.8 (Good)
45 (Unhealthy for Sensitive Groups)
20 (Moderate)
pm10
63 (Unhealthy for Sensitive Groups)
71 (Unhealthy for Sensitive Groups)
81 (Unhealthy)
132 (Very Unhealthy)
112 (Very Unhealthy)
131 (Very Unhealthy)
173 (Very bad Hazardous)
153 (Very bad Hazardous)
54 (Unhealthy for Sensitive Groups)
41 (Moderate)
85 (Unhealthy)
52 (Unhealthy for Sensitive Groups)
125 (Very Unhealthy)
133 (Very Unhealthy)
so2
8 (Good)
8.4 (Good)
9.6 (Good)
18 (Good)
20 (Good)
40 (Good)
40 (Good)
33 (Good)
32 (Good)
30 (Good)
27 (Good)
21 (Good)
19 (Good)
21 (Good)
co
159 (Good)
311 (Good)
319 (Good)
695 (Good)
437 (Good)
346 (Good)
658 (Good)
944 (Good)
888 (Good)
1 (Good)
1 (Good)
1 (Good)
1 (Good)
1 (Good)
data source »
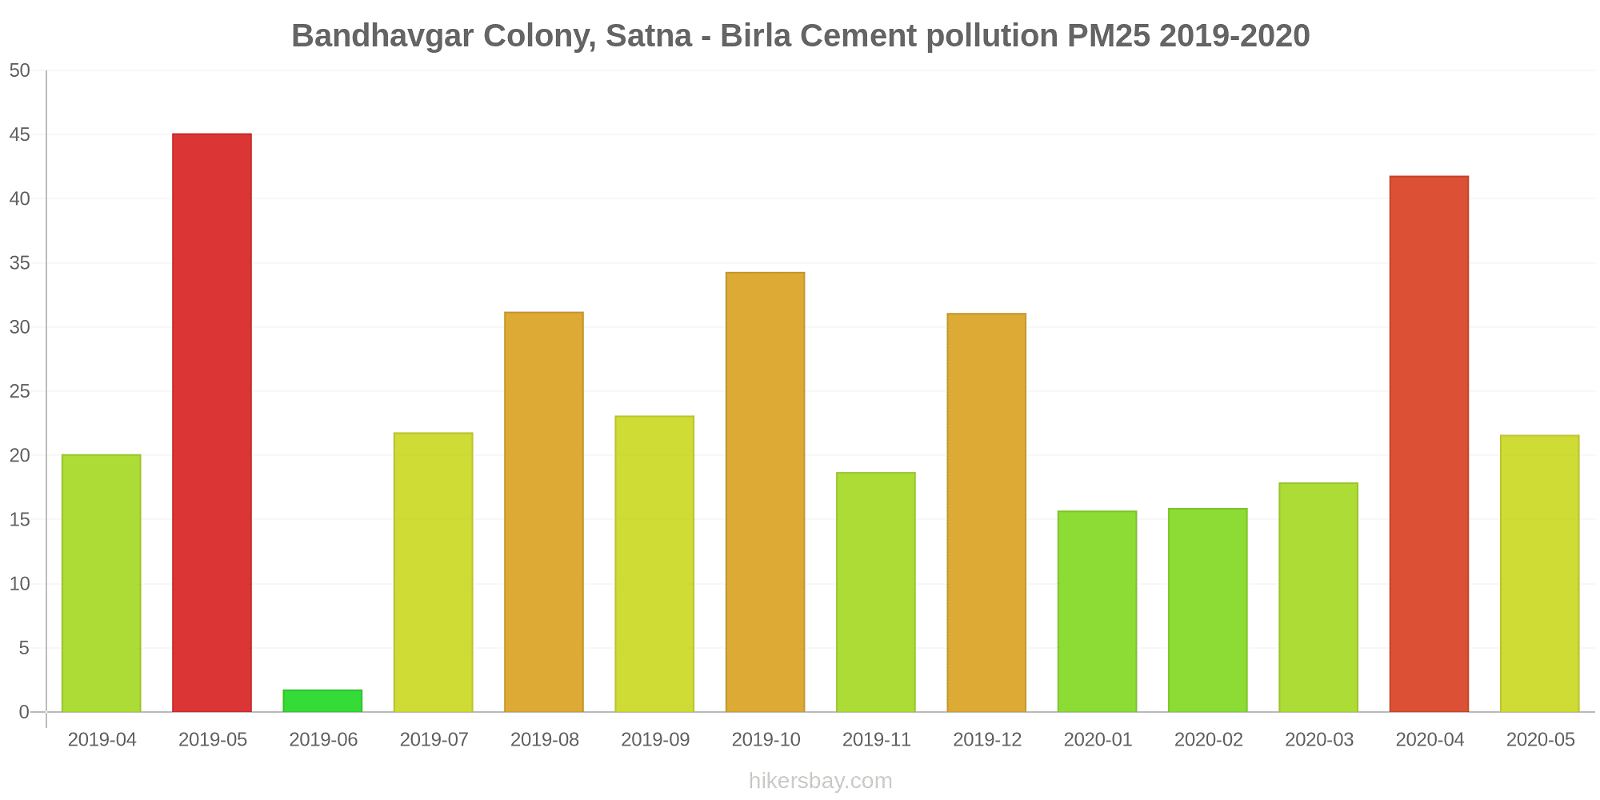
Bandhavgar Colony, Satna - Birla Cement
Monday, October 31, 2022, 2:00 AM
NO2 12 (Good)
nitrogen dioxide (NO2)
PM10 37 (Moderate)
particulate matter (PM10) suspended dust
O3 9.5 (Good)
ozone (O3)
SO2 5.8 (Good)
sulfur dioxide (SO2)
PM2,5 10 (Good)
particulate matter (PM2.5) dust
CO 560 (Good)
carbon monoxide (CO)
Bandhavgar Colony, Satna - Birla Cement
index
2022-10-31
no2
12
pm10
38
o3
7.9
so2
5.1
pm25
10
co
490
Bandhavgar Colony, Satna - Birla Cement
2019-04 2020-05
index
2020-05
2020-04
2020-03
2020-02
2020-01
2019-12
2019-11
2019-10
2019-09
2019-08
2019-07
2019-06
2019-05
2019-04
pm25
22
42
18
16
16
31
19
34
23
31
22
1.8
45
20
pm10
63
71
81
132
112
131
173
153
54
41
85
52
125
133
so2
8
8.4
9.6
18
20
40
40
33
32
30
27
21
19
21
co
159
311
319
695
437
346
658
944
888
1
1
1
1
1
* Pollution data source:
https://openaq.org
(caaqm)
The data is licensed under CC-By 4.0
NO2 12 (Good)
PM10 37 (Moderate)
O3 10 (Good)
SO2 6 (Good)
PM2,5 10 (Good)
CO 560 (Good)
Data on air pollution from recent days in Barega
| index | 2022-10-31 |
|---|---|
| no2 | 12 Good |
| pm10 | 38 Moderate |
| o3 | 8 Good |
| so2 | 5 Good |
| pm25 | 10 Good |
| co | 490 Good |
| index | 2020-05 | 2020-04 | 2020-03 | 2020-02 | 2020-01 | 2019-12 | 2019-11 | 2019-10 | 2019-09 | 2019-08 | 2019-07 | 2019-06 | 2019-05 | 2019-04 |
|---|---|---|---|---|---|---|---|---|---|---|---|---|---|---|
| pm25 | 22 (Moderate) | 42 (Unhealthy for Sensitive Groups) | 18 (Moderate) | 16 (Moderate) | 16 (Moderate) | 31 (Moderate) | 19 (Moderate) | 34 (Moderate) | 23 (Moderate) | 31 (Moderate) | 22 (Moderate) | 1.8 (Good) | 45 (Unhealthy for Sensitive Groups) | 20 (Moderate) |
| pm10 | 63 (Unhealthy for Sensitive Groups) | 71 (Unhealthy for Sensitive Groups) | 81 (Unhealthy) | 132 (Very Unhealthy) | 112 (Very Unhealthy) | 131 (Very Unhealthy) | 173 (Very bad Hazardous) | 153 (Very bad Hazardous) | 54 (Unhealthy for Sensitive Groups) | 41 (Moderate) | 85 (Unhealthy) | 52 (Unhealthy for Sensitive Groups) | 125 (Very Unhealthy) | 133 (Very Unhealthy) |
| so2 | 8 (Good) | 8.4 (Good) | 9.6 (Good) | 18 (Good) | 20 (Good) | 40 (Good) | 40 (Good) | 33 (Good) | 32 (Good) | 30 (Good) | 27 (Good) | 21 (Good) | 19 (Good) | 21 (Good) |
| co | 159 (Good) | 311 (Good) | 319 (Good) | 695 (Good) | 437 (Good) | 346 (Good) | 658 (Good) | 944 (Good) | 888 (Good) | 1 (Good) | 1 (Good) | 1 (Good) | 1 (Good) | 1 (Good) |
NO2 12 (Good)
nitrogen dioxide (NO2)PM10 37 (Moderate)
particulate matter (PM10) suspended dustO3 9.5 (Good)
ozone (O3)SO2 5.8 (Good)
sulfur dioxide (SO2)PM2,5 10 (Good)
particulate matter (PM2.5) dustCO 560 (Good)
carbon monoxide (CO)Bandhavgar Colony, Satna - Birla Cement
| index | 2022-10-31 |
|---|---|
| no2 | 12 |
| pm10 | 38 |
| o3 | 7.9 |
| so2 | 5.1 |
| pm25 | 10 |
| co | 490 |
Bandhavgar Colony, Satna - Birla Cement

| index | 2020-05 | 2020-04 | 2020-03 | 2020-02 | 2020-01 | 2019-12 | 2019-11 | 2019-10 | 2019-09 | 2019-08 | 2019-07 | 2019-06 | 2019-05 | 2019-04 |
|---|---|---|---|---|---|---|---|---|---|---|---|---|---|---|
| pm25 | 22 | 42 | 18 | 16 | 16 | 31 | 19 | 34 | 23 | 31 | 22 | 1.8 | 45 | 20 |
| pm10 | 63 | 71 | 81 | 132 | 112 | 131 | 173 | 153 | 54 | 41 | 85 | 52 | 125 | 133 |
| so2 | 8 | 8.4 | 9.6 | 18 | 20 | 40 | 40 | 33 | 32 | 30 | 27 | 21 | 19 | 21 |
| co | 159 | 311 | 319 | 695 | 437 | 346 | 658 | 944 | 888 | 1 | 1 | 1 | 1 | 1 |