Air Pollution in Tādbund Hyderābād: Real-time Air Quality Index and smog alert.
Pollution and air quality forecast for Tādbund Hyderābād. Today is Wednesday, May 13, 2026. The following air pollution values have been recorded for Tādbund Hyderābād:- carbon monoxide (CO) - 920 (Good)
- particulate matter (PM2.5) dust - 83 (Very Unhealthy)
- sulfur dioxide (SO2) - 0 (Good)
- particulate matter (PM10) suspended dust - 126 (Very Unhealthy)
- ozone (O3) - 14 (Good)
- nitrogen dioxide (NO2) - 19 (Good)

What is the air quality in Tādbund Hyderābād today? Is the air polluted in Tādbund Hyderābād?. Is there smog?
How high is the CO level? (carbon monoxide (CO))
920 (Good)
What is the current level of PM2.5 in Tādbund Hyderābād? (particulate matter (PM2.5) dust)
Today's PM2.5 level is:
83 (Very Unhealthy)
For comparison, the highest level of PM2.5 in Tādbund Hyderābād in the last 7 days was: 85 (Monday, October 31, 2022) and the lowest: 85 (Monday, October 31, 2022).
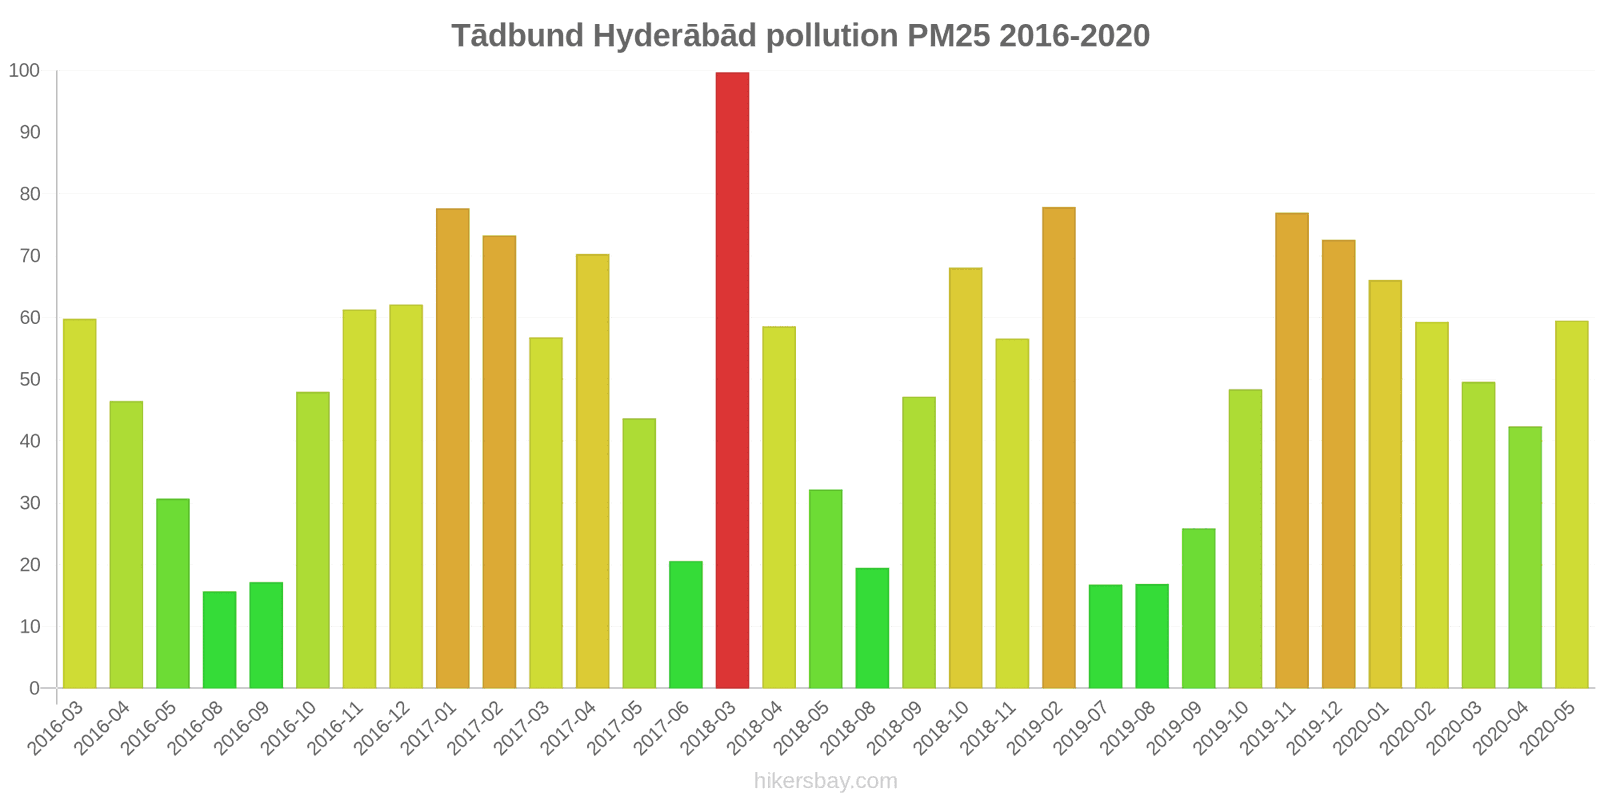
The highest PM2.5 values were recorded: 100 (March 2018).
The lowest level of particulate matter PM2.5 pollution occurs in month: August (16).
What is the level of SO2 pollution? (sulfur dioxide (SO2))
0 (Good)
What is the level of PM10 today in Tādbund Hyderābād? (particulate matter (PM10) suspended dust)
The current level of particulate matter PM10 in Tādbund Hyderābād is:
126 (Very Unhealthy)
The highest PM10 values usually occur in month: 163 (April 2017).
The lowest value of particulate matter PM10 pollution in Tādbund Hyderābād is usually recorded in: August (33).
How is the O3 level today in Tādbund Hyderābād? (ozone (O3))
14 (Good)
How high is the level of NO2? (nitrogen dioxide (NO2))
19 (Good)
Current data Monday, October 31, 2022, 2:00 AM
CO 920 (Good)
PM2,5 83 (Very Unhealthy)
SO2 0 (Good)
PM10 126 (Very Unhealthy)
O3 14 (Good)
NO2 19 (Good)
Data on air pollution from recent days in Tādbund Hyderābād
index
2022-10-31
co
940
Good
pm25
85
Very Unhealthy
so2
0
Good
pm10
136
Very Unhealthy
o3
14
Good
no2
19
Good
data source »
Air pollution in Tādbund Hyderābād from March 2016 to May 2020
index
2020-05
2020-04
2020-03
2020-02
2020-01
2019-12
2019-11
2019-10
2019-09
2019-08
2019-07
2019-02
2018-11
2018-10
2018-09
2018-08
2018-05
2018-04
2018-03
2017-06
2017-05
2017-04
2017-03
2017-02
2017-01
2016-12
2016-11
2016-10
2016-09
2016-08
2016-05
2016-04
2016-03
pm25
60 (Unhealthy)
42 (Unhealthy for Sensitive Groups)
50 (Unhealthy for Sensitive Groups)
59 (Unhealthy)
66 (Unhealthy)
73 (Unhealthy)
77 (Very Unhealthy)
48 (Unhealthy for Sensitive Groups)
26 (Moderate)
17 (Moderate)
17 (Moderate)
78 (Very Unhealthy)
57 (Unhealthy)
68 (Unhealthy)
47 (Unhealthy for Sensitive Groups)
20 (Moderate)
32 (Moderate)
59 (Unhealthy)
100 (Very Unhealthy)
21 (Moderate)
44 (Unhealthy for Sensitive Groups)
70 (Unhealthy)
57 (Unhealthy)
73 (Unhealthy)
78 (Very Unhealthy)
62 (Unhealthy)
61 (Unhealthy)
48 (Unhealthy for Sensitive Groups)
17 (Moderate)
16 (Moderate)
31 (Moderate)
47 (Unhealthy for Sensitive Groups)
60 (Unhealthy)
no2
48 (Moderate)
69 (Moderate)
34 (Good)
166 (Unhealthy)
52 (Moderate)
58 (Moderate)
49 (Moderate)
120 (Unhealthy for Sensitive Groups)
23 (Good)
15 (Good)
75 (Moderate)
120 (Unhealthy for Sensitive Groups)
54 (Moderate)
50 (Moderate)
37 (Good)
21 (Good)
43 (Moderate)
55 (Moderate)
71 (Moderate)
15 (Good)
30 (Good)
46 (Moderate)
32 (Good)
47 (Moderate)
51 (Moderate)
59 (Moderate)
51 (Moderate)
32 (Good)
13 (Good)
14 (Good)
44 (Moderate)
42 (Moderate)
3 (Good)
so2
3.6 (Good)
3.8 (Good)
11 (Good)
23 (Good)
9.8 (Good)
11 (Good)
12 (Good)
410 (Very Unhealthy)
2.6 (Good)
12 (Good)
8.6 (Good)
1.4 (Good)
14 (Good)
15 (Good)
22 (Good)
4.8 (Good)
9.5 (Good)
9.1 (Good)
8.8 (Good)
8.8 (Good)
15 (Good)
22 (Good)
20 (Good)
27 (Good)
26 (Good)
21 (Good)
16 (Good)
6.9 (Good)
7.1 (Good)
9.5 (Good)
4.6 (Good)
6.1 (Good)
8.1 (Good)
co
600 (Good)
490 (Good)
740 (Good)
918 (Good)
872 (Good)
1 (Good)
978 (Good)
625 (Good)
338 (Good)
393 (Good)
310 (Good)
884 (Good)
852 (Good)
776 (Good)
595 (Good)
1 (Good)
714 (Good)
30 (Good)
63 (Good)
897 (Good)
941 (Good)
1 (Good)
984 (Good)
1 (Good)
1 (Good)
1 (Good)
1 (Good)
765 (Good)
468 (Good)
497 (Good)
652 (Good)
741 (Good)
1 (Good)
o3
18 (Good)
22 (Good)
30 (Good)
23 (Good)
27 (Good)
26 (Good)
30 (Good)
120 (Unhealthy for Sensitive Groups)
171 (Unhealthy)
28 (Good)
31 (Good)
33 (Good)
35 (Good)
42 (Good)
36 (Good)
31 (Good)
46 (Good)
38 (Good)
25 (Good)
61 (Good)
88 (Moderate)
85 (Moderate)
78 (Moderate)
34 (Good)
32 (Good)
33 (Good)
36 (Good)
- (Good)
- (Good)
9.8 (Good)
36 (Good)
44 (Good)
48 (Good)
pm10
66 (Unhealthy for Sensitive Groups)
78 (Unhealthy for Sensitive Groups)
95 (Unhealthy)
113 (Very Unhealthy)
121 (Very Unhealthy)
132 (Very Unhealthy)
147 (Very Unhealthy)
81 (Unhealthy)
42 (Moderate)
40 (Moderate)
37 (Moderate)
148 (Very Unhealthy)
112 (Very Unhealthy)
129 (Very Unhealthy)
69 (Unhealthy for Sensitive Groups)
35 (Moderate)
84 (Unhealthy)
93 (Unhealthy)
110 (Very Unhealthy)
43 (Moderate)
114 (Very Unhealthy)
163 (Very bad Hazardous)
138 (Very Unhealthy)
156 (Very bad Hazardous)
140 (Very Unhealthy)
103 (Unhealthy)
104 (Unhealthy)
81 (Unhealthy)
35 (Moderate)
33 (Moderate)
72 (Unhealthy for Sensitive Groups)
96 (Unhealthy)
102 (Unhealthy)
data source »
Zoo Park, Hyderabad - TSPCB
Monday, October 31, 2022, 2:00 AM
CO 920 (Good)
carbon monoxide (CO)
PM2,5 83 (Very Unhealthy)
particulate matter (PM2.5) dust
SO2 0 (Good)
sulfur dioxide (SO2)
PM10 126 (Very Unhealthy)
particulate matter (PM10) suspended dust
O3 14 (Good)
ozone (O3)
NO2 19 (Good)
nitrogen dioxide (NO2)
Zoo Park, Hyderabad - TSPCB
index
2022-10-31
co
940
pm25
85
so2
0
pm10
136
o3
14
no2
19
Zoo Park, Hyderabad - TSPCB
2018-03 2020-05

index
2020-05
2020-04
2020-03
2020-02
2020-01
2019-12
2019-11
2019-10
2019-09
2019-08
2019-07
2019-02
2018-11
2018-10
2018-09
2018-08
2018-05
2018-04
2018-03
pm25
60
42
50
59
66
73
77
48
26
17
17
78
57
68
47
20
32
59
100
pm10
66
78
95
113
121
132
147
81
42
40
37
148
112
129
69
35
84
93
110
no2
48
69
34
166
52
58
49
120
23
15
75
120
54
50
37
21
43
55
71
so2
3.6
3.8
11
23
9.8
11
12
410
2.6
12
8.6
1.4
14
15
22
4.8
9.5
9.1
8.8
co
600
490
740
918
872
1
978
625
338
393
310
884
852
776
595
1
714
30
63
o3
18
22
30
23
27
26
30
120
171
28
31
33
35
42
36
31
46
38
25
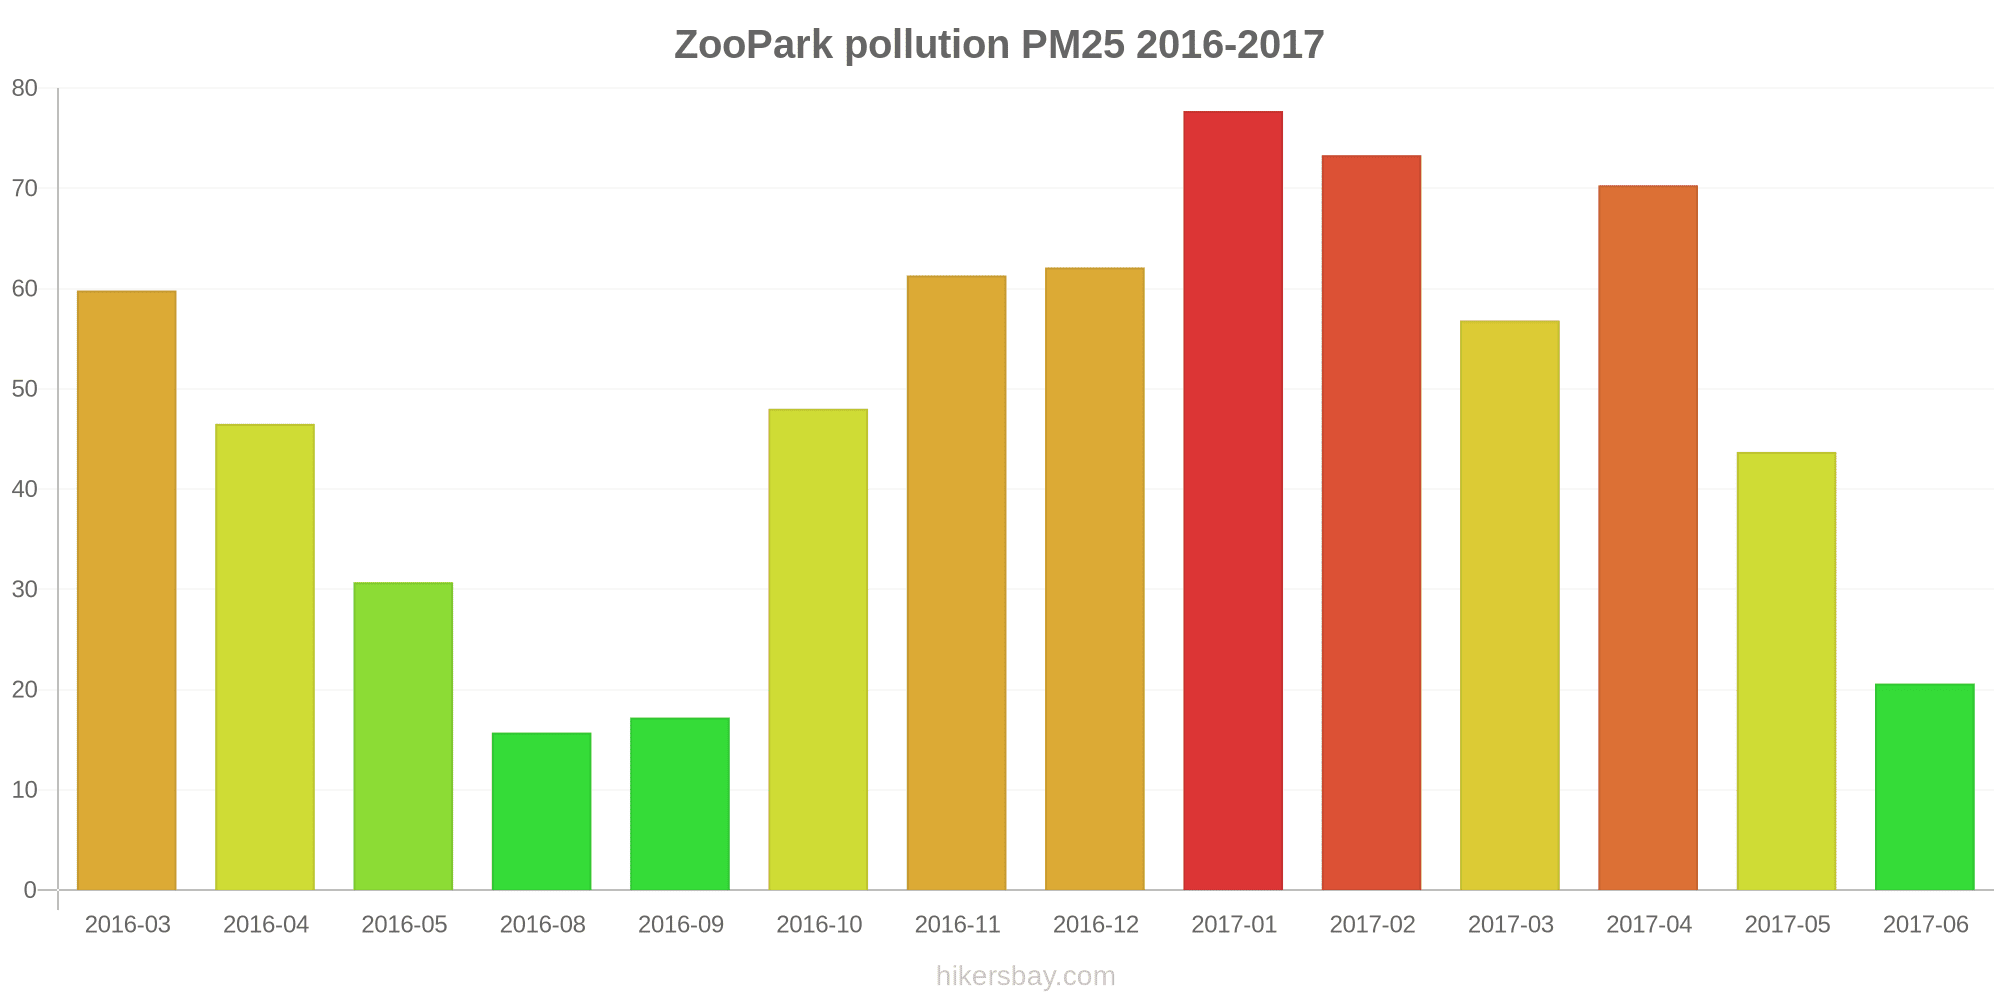
ZooPark
2016-03 2017-06
index
2017-06
2017-05
2017-04
2017-03
2017-02
2017-01
2016-12
2016-11
2016-10
2016-09
2016-08
2016-05
2016-04
2016-03
pm25
21
44
70
57
73
78
62
61
48
17
16
31
47
60
o3
61
88
85
78
34
32
33
36
-
-
9.8
36
44
48
so2
8.8
15
22
20
27
26
21
16
6.9
7.1
9.5
4.6
6.1
8.1
co
897
941
1
984
1
1
1
1
765
468
497
652
741
1
no2
15
30
46
32
47
51
59
51
32
13
14
44
42
3
pm10
43
114
163
138
156
140
103
104
81
35
33
72
96
102
* Pollution data source:
https://openaq.org
(caaqm)
The data is licensed under CC-By 4.0
CO 920 (Good)
PM2,5 83 (Very Unhealthy)
SO2 0 (Good)
PM10 126 (Very Unhealthy)
O3 14 (Good)
NO2 19 (Good)
Data on air pollution from recent days in Tādbund Hyderābād
| index | 2022-10-31 |
|---|---|
| co | 940 Good |
| pm25 | 85 Very Unhealthy |
| so2 | 0 Good |
| pm10 | 136 Very Unhealthy |
| o3 | 14 Good |
| no2 | 19 Good |

| index | 2020-05 | 2020-04 | 2020-03 | 2020-02 | 2020-01 | 2019-12 | 2019-11 | 2019-10 | 2019-09 | 2019-08 | 2019-07 | 2019-02 | 2018-11 | 2018-10 | 2018-09 | 2018-08 | 2018-05 | 2018-04 | 2018-03 | 2017-06 | 2017-05 | 2017-04 | 2017-03 | 2017-02 | 2017-01 | 2016-12 | 2016-11 | 2016-10 | 2016-09 | 2016-08 | 2016-05 | 2016-04 | 2016-03 |
|---|---|---|---|---|---|---|---|---|---|---|---|---|---|---|---|---|---|---|---|---|---|---|---|---|---|---|---|---|---|---|---|---|---|
| pm25 | 60 (Unhealthy) | 42 (Unhealthy for Sensitive Groups) | 50 (Unhealthy for Sensitive Groups) | 59 (Unhealthy) | 66 (Unhealthy) | 73 (Unhealthy) | 77 (Very Unhealthy) | 48 (Unhealthy for Sensitive Groups) | 26 (Moderate) | 17 (Moderate) | 17 (Moderate) | 78 (Very Unhealthy) | 57 (Unhealthy) | 68 (Unhealthy) | 47 (Unhealthy for Sensitive Groups) | 20 (Moderate) | 32 (Moderate) | 59 (Unhealthy) | 100 (Very Unhealthy) | 21 (Moderate) | 44 (Unhealthy for Sensitive Groups) | 70 (Unhealthy) | 57 (Unhealthy) | 73 (Unhealthy) | 78 (Very Unhealthy) | 62 (Unhealthy) | 61 (Unhealthy) | 48 (Unhealthy for Sensitive Groups) | 17 (Moderate) | 16 (Moderate) | 31 (Moderate) | 47 (Unhealthy for Sensitive Groups) | 60 (Unhealthy) |
| no2 | 48 (Moderate) | 69 (Moderate) | 34 (Good) | 166 (Unhealthy) | 52 (Moderate) | 58 (Moderate) | 49 (Moderate) | 120 (Unhealthy for Sensitive Groups) | 23 (Good) | 15 (Good) | 75 (Moderate) | 120 (Unhealthy for Sensitive Groups) | 54 (Moderate) | 50 (Moderate) | 37 (Good) | 21 (Good) | 43 (Moderate) | 55 (Moderate) | 71 (Moderate) | 15 (Good) | 30 (Good) | 46 (Moderate) | 32 (Good) | 47 (Moderate) | 51 (Moderate) | 59 (Moderate) | 51 (Moderate) | 32 (Good) | 13 (Good) | 14 (Good) | 44 (Moderate) | 42 (Moderate) | 3 (Good) |
| so2 | 3.6 (Good) | 3.8 (Good) | 11 (Good) | 23 (Good) | 9.8 (Good) | 11 (Good) | 12 (Good) | 410 (Very Unhealthy) | 2.6 (Good) | 12 (Good) | 8.6 (Good) | 1.4 (Good) | 14 (Good) | 15 (Good) | 22 (Good) | 4.8 (Good) | 9.5 (Good) | 9.1 (Good) | 8.8 (Good) | 8.8 (Good) | 15 (Good) | 22 (Good) | 20 (Good) | 27 (Good) | 26 (Good) | 21 (Good) | 16 (Good) | 6.9 (Good) | 7.1 (Good) | 9.5 (Good) | 4.6 (Good) | 6.1 (Good) | 8.1 (Good) |
| co | 600 (Good) | 490 (Good) | 740 (Good) | 918 (Good) | 872 (Good) | 1 (Good) | 978 (Good) | 625 (Good) | 338 (Good) | 393 (Good) | 310 (Good) | 884 (Good) | 852 (Good) | 776 (Good) | 595 (Good) | 1 (Good) | 714 (Good) | 30 (Good) | 63 (Good) | 897 (Good) | 941 (Good) | 1 (Good) | 984 (Good) | 1 (Good) | 1 (Good) | 1 (Good) | 1 (Good) | 765 (Good) | 468 (Good) | 497 (Good) | 652 (Good) | 741 (Good) | 1 (Good) |
| o3 | 18 (Good) | 22 (Good) | 30 (Good) | 23 (Good) | 27 (Good) | 26 (Good) | 30 (Good) | 120 (Unhealthy for Sensitive Groups) | 171 (Unhealthy) | 28 (Good) | 31 (Good) | 33 (Good) | 35 (Good) | 42 (Good) | 36 (Good) | 31 (Good) | 46 (Good) | 38 (Good) | 25 (Good) | 61 (Good) | 88 (Moderate) | 85 (Moderate) | 78 (Moderate) | 34 (Good) | 32 (Good) | 33 (Good) | 36 (Good) | - (Good) | - (Good) | 9.8 (Good) | 36 (Good) | 44 (Good) | 48 (Good) |
| pm10 | 66 (Unhealthy for Sensitive Groups) | 78 (Unhealthy for Sensitive Groups) | 95 (Unhealthy) | 113 (Very Unhealthy) | 121 (Very Unhealthy) | 132 (Very Unhealthy) | 147 (Very Unhealthy) | 81 (Unhealthy) | 42 (Moderate) | 40 (Moderate) | 37 (Moderate) | 148 (Very Unhealthy) | 112 (Very Unhealthy) | 129 (Very Unhealthy) | 69 (Unhealthy for Sensitive Groups) | 35 (Moderate) | 84 (Unhealthy) | 93 (Unhealthy) | 110 (Very Unhealthy) | 43 (Moderate) | 114 (Very Unhealthy) | 163 (Very bad Hazardous) | 138 (Very Unhealthy) | 156 (Very bad Hazardous) | 140 (Very Unhealthy) | 103 (Unhealthy) | 104 (Unhealthy) | 81 (Unhealthy) | 35 (Moderate) | 33 (Moderate) | 72 (Unhealthy for Sensitive Groups) | 96 (Unhealthy) | 102 (Unhealthy) |
CO 920 (Good)
carbon monoxide (CO)PM2,5 83 (Very Unhealthy)
particulate matter (PM2.5) dustSO2 0 (Good)
sulfur dioxide (SO2)PM10 126 (Very Unhealthy)
particulate matter (PM10) suspended dustO3 14 (Good)
ozone (O3)NO2 19 (Good)
nitrogen dioxide (NO2)Zoo Park, Hyderabad - TSPCB
| index | 2022-10-31 |
|---|---|
| co | 940 |
| pm25 | 85 |
| so2 | 0 |
| pm10 | 136 |
| o3 | 14 |
| no2 | 19 |
Zoo Park, Hyderabad - TSPCB
| index | 2020-05 | 2020-04 | 2020-03 | 2020-02 | 2020-01 | 2019-12 | 2019-11 | 2019-10 | 2019-09 | 2019-08 | 2019-07 | 2019-02 | 2018-11 | 2018-10 | 2018-09 | 2018-08 | 2018-05 | 2018-04 | 2018-03 |
|---|---|---|---|---|---|---|---|---|---|---|---|---|---|---|---|---|---|---|---|
| pm25 | 60 | 42 | 50 | 59 | 66 | 73 | 77 | 48 | 26 | 17 | 17 | 78 | 57 | 68 | 47 | 20 | 32 | 59 | 100 |
| pm10 | 66 | 78 | 95 | 113 | 121 | 132 | 147 | 81 | 42 | 40 | 37 | 148 | 112 | 129 | 69 | 35 | 84 | 93 | 110 |
| no2 | 48 | 69 | 34 | 166 | 52 | 58 | 49 | 120 | 23 | 15 | 75 | 120 | 54 | 50 | 37 | 21 | 43 | 55 | 71 |
| so2 | 3.6 | 3.8 | 11 | 23 | 9.8 | 11 | 12 | 410 | 2.6 | 12 | 8.6 | 1.4 | 14 | 15 | 22 | 4.8 | 9.5 | 9.1 | 8.8 |
| co | 600 | 490 | 740 | 918 | 872 | 1 | 978 | 625 | 338 | 393 | 310 | 884 | 852 | 776 | 595 | 1 | 714 | 30 | 63 |
| o3 | 18 | 22 | 30 | 23 | 27 | 26 | 30 | 120 | 171 | 28 | 31 | 33 | 35 | 42 | 36 | 31 | 46 | 38 | 25 |
ZooPark
| index | 2017-06 | 2017-05 | 2017-04 | 2017-03 | 2017-02 | 2017-01 | 2016-12 | 2016-11 | 2016-10 | 2016-09 | 2016-08 | 2016-05 | 2016-04 | 2016-03 |
|---|---|---|---|---|---|---|---|---|---|---|---|---|---|---|
| pm25 | 21 | 44 | 70 | 57 | 73 | 78 | 62 | 61 | 48 | 17 | 16 | 31 | 47 | 60 |
| o3 | 61 | 88 | 85 | 78 | 34 | 32 | 33 | 36 | - | - | 9.8 | 36 | 44 | 48 |
| so2 | 8.8 | 15 | 22 | 20 | 27 | 26 | 21 | 16 | 6.9 | 7.1 | 9.5 | 4.6 | 6.1 | 8.1 |
| co | 897 | 941 | 1 | 984 | 1 | 1 | 1 | 1 | 765 | 468 | 497 | 652 | 741 | 1 |
| no2 | 15 | 30 | 46 | 32 | 47 | 51 | 59 | 51 | 32 | 13 | 14 | 44 | 42 | 3 |
| pm10 | 43 | 114 | 163 | 138 | 156 | 140 | 103 | 104 | 81 | 35 | 33 | 72 | 96 | 102 |