Air Pollution in Gulla Bāwdi: Real-time Air Quality Index and smog alert.
Pollution and air quality forecast for Gulla Bāwdi. Today is Thursday, May 14, 2026. The following air pollution values have been recorded for Gulla Bāwdi:- sulfur dioxide (SO2) - 31 (Good)
- carbon monoxide (CO) - 350 (Good)
- ozone (O3) - 7 (Good)
- particulate matter (PM2.5) dust - 54 (Unhealthy for Sensitive Groups)

What is the air quality in Gulla Bāwdi today? Is the air polluted in Gulla Bāwdi?. Is there smog?
What is the level of SO2 pollution? (sulfur dioxide (SO2))
31 (Good)
How high is the CO level? (carbon monoxide (CO))
350 (Good)
How is the O3 level today in Gulla Bāwdi? (ozone (O3))
7 (Good)
What is the current level of PM2.5 in Gulla Bāwdi? (particulate matter (PM2.5) dust)
Today's PM2.5 level is:
54 (Unhealthy for Sensitive Groups)
For comparison, the highest level of PM2.5 in Gulla Bāwdi in the last 7 days was: 54 (Monday, October 31, 2022) and the lowest: 54 (Monday, October 31, 2022).
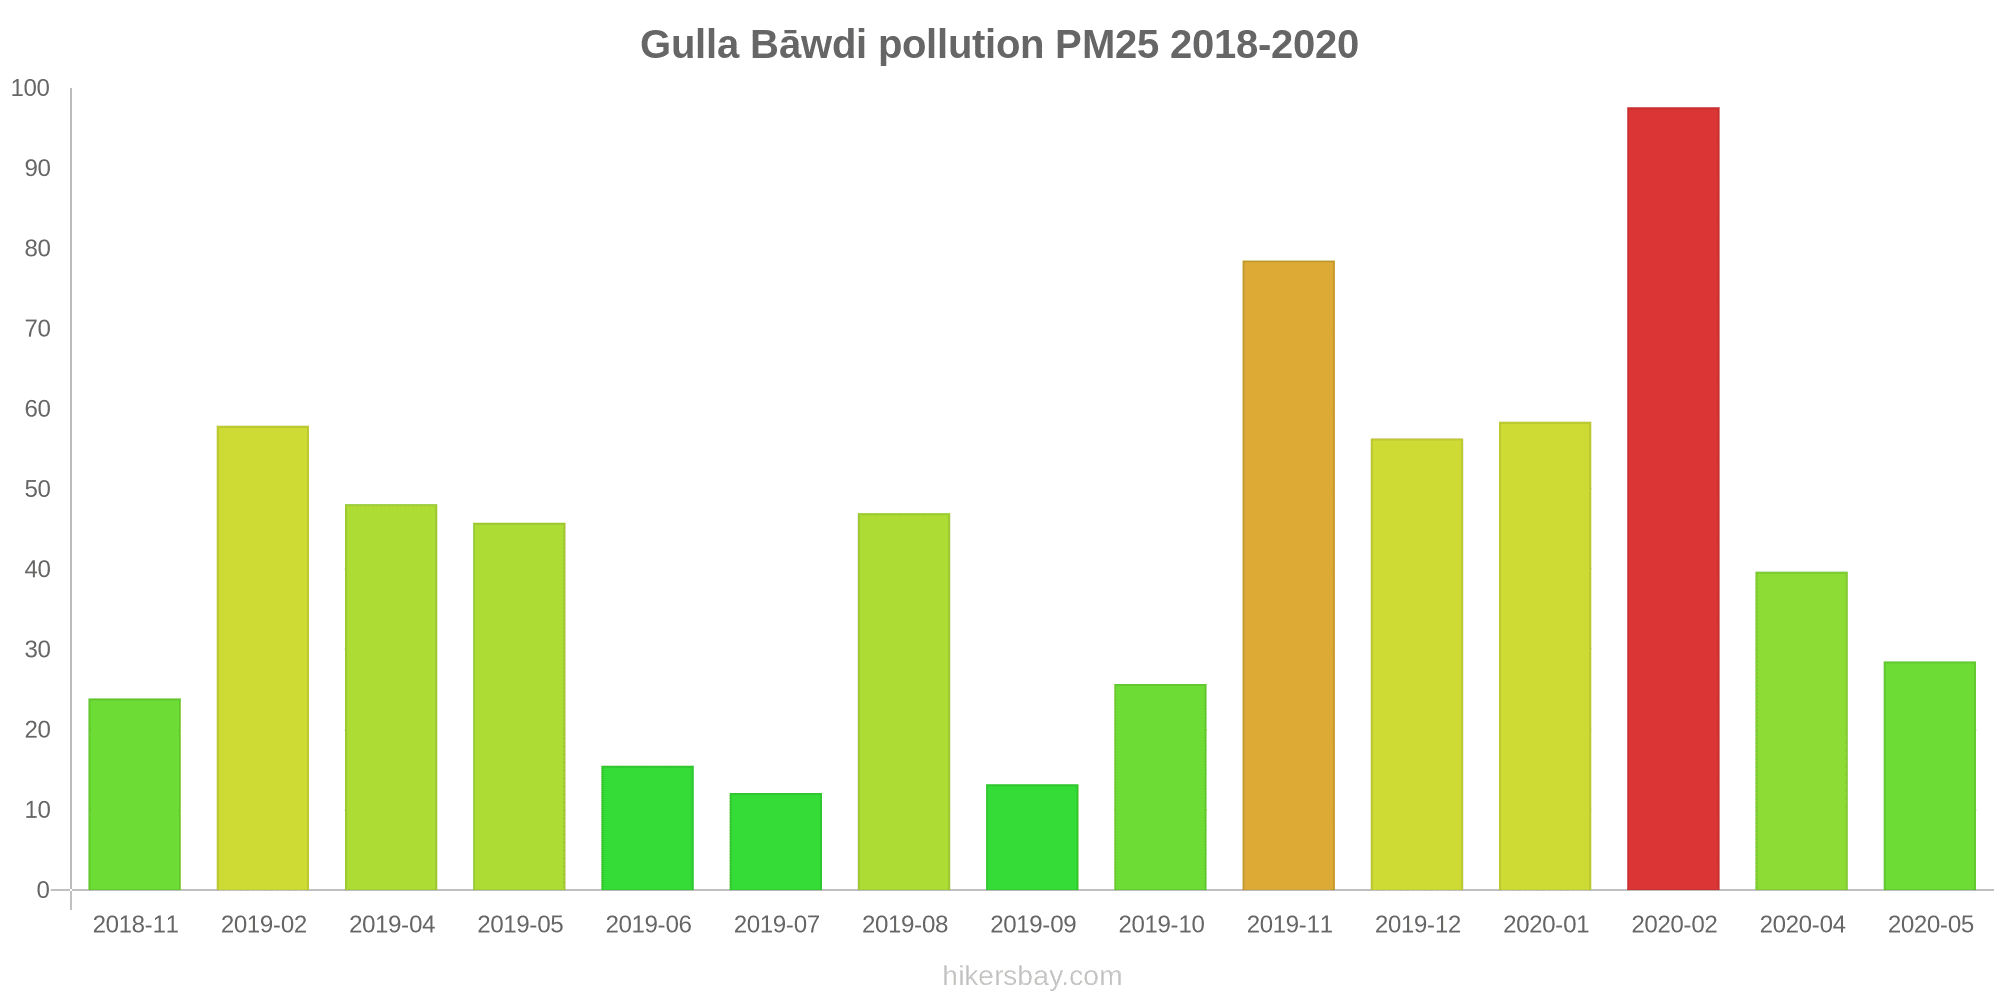
The highest PM2.5 values were recorded: 98 (February 2020).
The lowest level of particulate matter PM2.5 pollution occurs in month: July (12).
Current data Monday, October 31, 2022, 1:00 AM
SO2 31 (Good)
CO 350 (Good)
O3 7 (Good)
PM2,5 54 (Unhealthy for Sensitive Groups)
Data on air pollution from recent days in Gulla Bāwdi
index
2022-10-31
so2
31
Good
co
350
Good
o3
7
Good
pm25
54
Unhealthy for Sensitive Groups
data source »
Air pollution in Gulla Bāwdi from November 2018 to May 2020
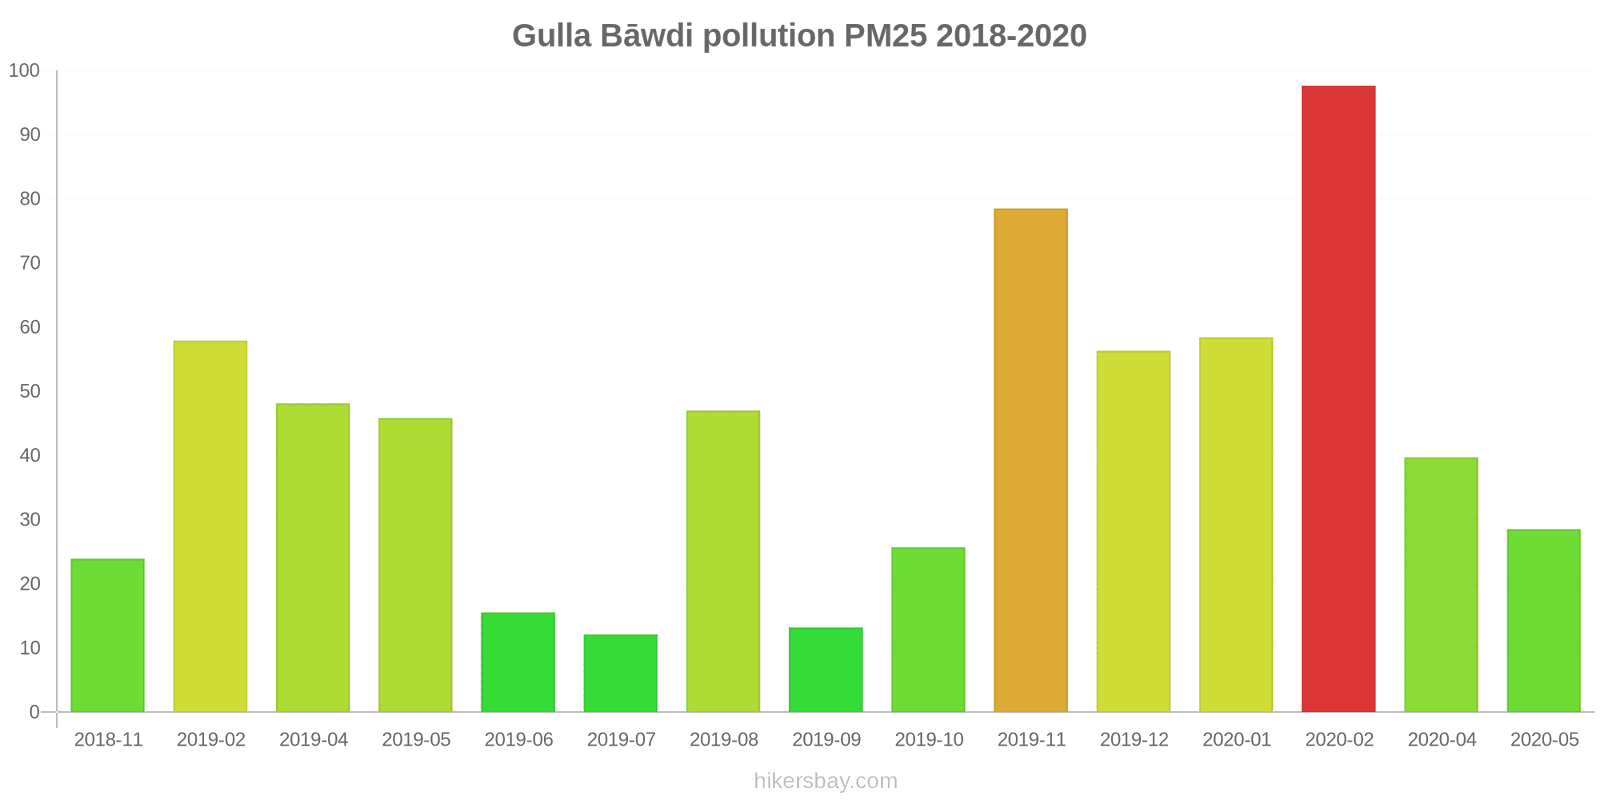
index
2020-05
2020-04
2020-02
2020-01
2019-12
2019-11
2019-10
2019-09
2019-08
2019-07
2019-06
2019-05
2019-04
2019-02
2018-11
pm25
29 (Moderate)
40 (Unhealthy for Sensitive Groups)
98 (Very Unhealthy)
58 (Unhealthy)
56 (Unhealthy)
79 (Very Unhealthy)
26 (Moderate)
13 (Moderate)
47 (Unhealthy for Sensitive Groups)
12 (Good)
16 (Moderate)
46 (Unhealthy for Sensitive Groups)
48 (Unhealthy for Sensitive Groups)
58 (Unhealthy)
24 (Moderate)
no2
5.7 (Good)
6.3 (Good)
35 (Good)
32 (Good)
36 (Good)
48 (Moderate)
29 (Good)
14 (Good)
10 (Good)
7.6 (Good)
8.8 (Good)
6.6 (Good)
20 (Good)
14 (Good)
19 (Good)
co
- (Good)
389 (Good)
519 (Good)
490 (Good)
424 (Good)
1 (Good)
788 (Good)
443 (Good)
419 (Good)
251 (Good)
174 (Good)
- (Good)
100 (Good)
932 (Good)
518 (Good)
pm10
- (Good)
198 (Very bad Hazardous)
97 (Unhealthy)
122 (Very Unhealthy)
95 (Unhealthy)
117 (Very Unhealthy)
50 (Moderate)
29 (Moderate)
38 (Moderate)
52 (Unhealthy for Sensitive Groups)
42 (Moderate)
139 (Very Unhealthy)
131 (Very Unhealthy)
128 (Very Unhealthy)
- (Good)
so2
- (Good)
14 (Good)
21 (Good)
18 (Good)
8.4 (Good)
13 (Good)
6.5 (Good)
6 (Good)
7.8 (Good)
1.9 (Good)
0.46 (Good)
1.6 (Good)
- (Good)
5.3 (Good)
1.6 (Good)
o3
- (Good)
1.5 (Good)
15 (Good)
9.9 (Good)
16 (Good)
20 (Good)
15 (Good)
12 (Good)
11 (Good)
16 (Good)
40 (Good)
33 (Good)
43 (Good)
56 (Good)
17 (Good)
data source »
Lal Bahadur Shastri Nagar, Kalaburagi - KSPCB
Monday, October 31, 2022, 1:00 AM
SO2 31 (Good)
sulfur dioxide (SO2)
CO 350 (Good)
carbon monoxide (CO)
O3 6.9 (Good)
ozone (O3)
PM2,5 54 (Unhealthy for Sensitive Groups)
particulate matter (PM2.5) dust
Lal Bahadur Shastri Nagar, Kalaburagi - KSPCB
index
2022-10-31
so2
31
co
350
o3
6.9
pm25
54
Lal Bahadur Shastri Nagar, Kalaburagi - KSPCB
2018-11 2020-05
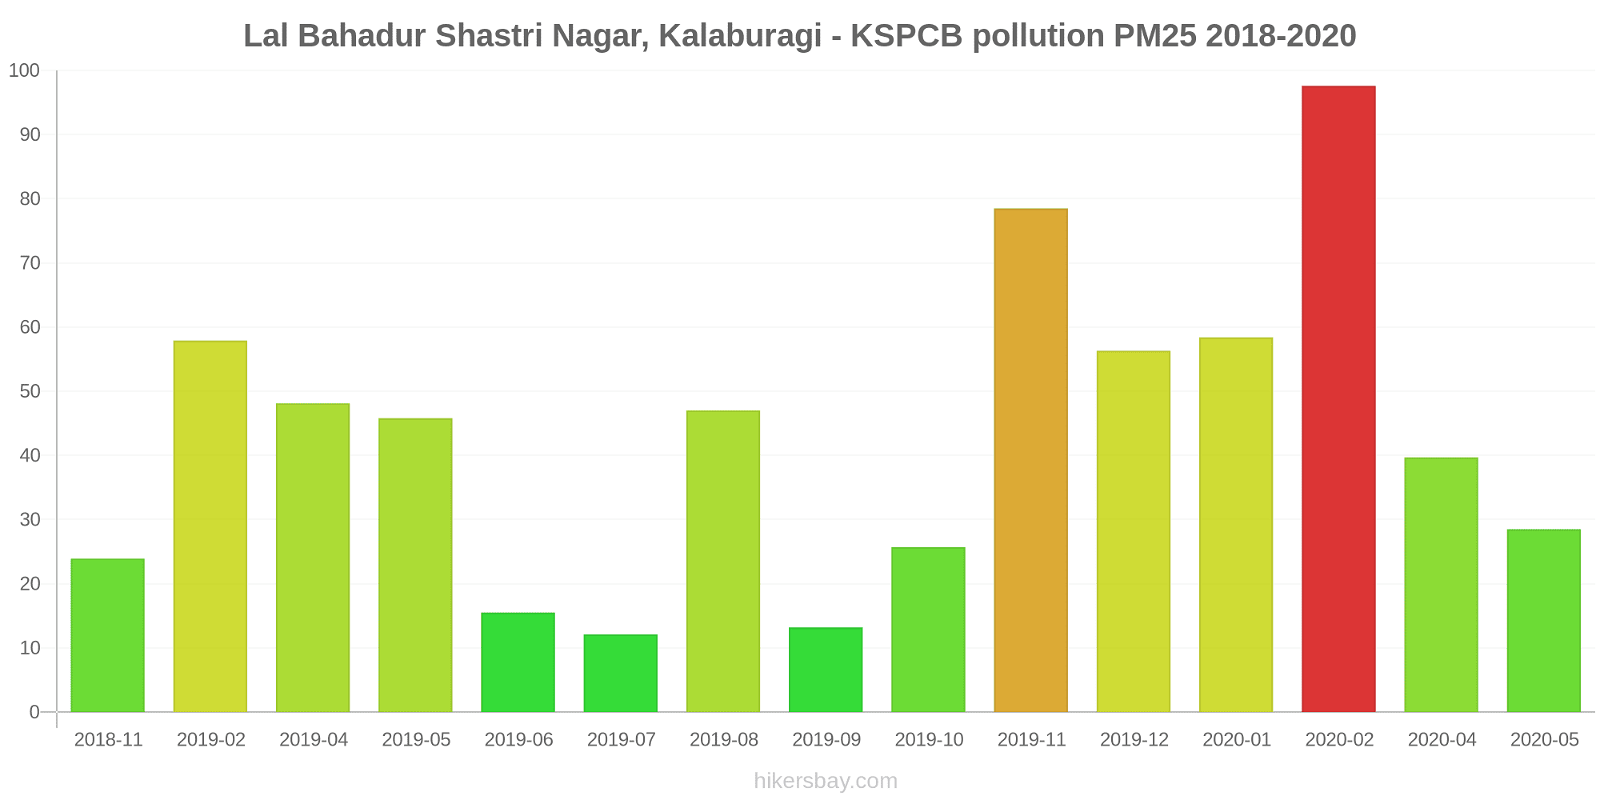
index
2020-05
2020-04
2020-02
2020-01
2019-12
2019-11
2019-10
2019-09
2019-08
2019-07
2019-06
2019-05
2019-04
2019-02
2018-11
pm25
29
40
98
58
56
79
26
13
47
12
16
46
48
58
24
no2
5.7
6.3
35
32
36
48
29
14
10
7.6
8.8
6.6
20
14
19
so2
-
14
21
18
8.4
13
6.5
6
7.8
1.9
0.46
1.6
-
5.3
1.6
co
-
389
519
490
424
1
788
443
419
251
174
-
100
932
518
o3
-
1.5
15
9.9
16
20
15
12
11
16
40
33
43
56
17
pm10
-
198
97
122
95
117
50
29
38
52
42
139
131
128
-
* Pollution data source:
https://openaq.org
(caaqm)
The data is licensed under CC-By 4.0
SO2 31 (Good)
CO 350 (Good)
O3 7 (Good)
PM2,5 54 (Unhealthy for Sensitive Groups)
Data on air pollution from recent days in Gulla Bāwdi
| index | 2022-10-31 |
|---|---|
| so2 | 31 Good |
| co | 350 Good |
| o3 | 7 Good |
| pm25 | 54 Unhealthy for Sensitive Groups |
| index | 2020-05 | 2020-04 | 2020-02 | 2020-01 | 2019-12 | 2019-11 | 2019-10 | 2019-09 | 2019-08 | 2019-07 | 2019-06 | 2019-05 | 2019-04 | 2019-02 | 2018-11 |
|---|---|---|---|---|---|---|---|---|---|---|---|---|---|---|---|
| pm25 | 29 (Moderate) | 40 (Unhealthy for Sensitive Groups) | 98 (Very Unhealthy) | 58 (Unhealthy) | 56 (Unhealthy) | 79 (Very Unhealthy) | 26 (Moderate) | 13 (Moderate) | 47 (Unhealthy for Sensitive Groups) | 12 (Good) | 16 (Moderate) | 46 (Unhealthy for Sensitive Groups) | 48 (Unhealthy for Sensitive Groups) | 58 (Unhealthy) | 24 (Moderate) |
| no2 | 5.7 (Good) | 6.3 (Good) | 35 (Good) | 32 (Good) | 36 (Good) | 48 (Moderate) | 29 (Good) | 14 (Good) | 10 (Good) | 7.6 (Good) | 8.8 (Good) | 6.6 (Good) | 20 (Good) | 14 (Good) | 19 (Good) |
| co | - (Good) | 389 (Good) | 519 (Good) | 490 (Good) | 424 (Good) | 1 (Good) | 788 (Good) | 443 (Good) | 419 (Good) | 251 (Good) | 174 (Good) | - (Good) | 100 (Good) | 932 (Good) | 518 (Good) |
| pm10 | - (Good) | 198 (Very bad Hazardous) | 97 (Unhealthy) | 122 (Very Unhealthy) | 95 (Unhealthy) | 117 (Very Unhealthy) | 50 (Moderate) | 29 (Moderate) | 38 (Moderate) | 52 (Unhealthy for Sensitive Groups) | 42 (Moderate) | 139 (Very Unhealthy) | 131 (Very Unhealthy) | 128 (Very Unhealthy) | - (Good) |
| so2 | - (Good) | 14 (Good) | 21 (Good) | 18 (Good) | 8.4 (Good) | 13 (Good) | 6.5 (Good) | 6 (Good) | 7.8 (Good) | 1.9 (Good) | 0.46 (Good) | 1.6 (Good) | - (Good) | 5.3 (Good) | 1.6 (Good) |
| o3 | - (Good) | 1.5 (Good) | 15 (Good) | 9.9 (Good) | 16 (Good) | 20 (Good) | 15 (Good) | 12 (Good) | 11 (Good) | 16 (Good) | 40 (Good) | 33 (Good) | 43 (Good) | 56 (Good) | 17 (Good) |
SO2 31 (Good)
sulfur dioxide (SO2)CO 350 (Good)
carbon monoxide (CO)O3 6.9 (Good)
ozone (O3)PM2,5 54 (Unhealthy for Sensitive Groups)
particulate matter (PM2.5) dustLal Bahadur Shastri Nagar, Kalaburagi - KSPCB
| index | 2022-10-31 |
|---|---|
| so2 | 31 |
| co | 350 |
| o3 | 6.9 |
| pm25 | 54 |
Lal Bahadur Shastri Nagar, Kalaburagi - KSPCB

| index | 2020-05 | 2020-04 | 2020-02 | 2020-01 | 2019-12 | 2019-11 | 2019-10 | 2019-09 | 2019-08 | 2019-07 | 2019-06 | 2019-05 | 2019-04 | 2019-02 | 2018-11 |
|---|---|---|---|---|---|---|---|---|---|---|---|---|---|---|---|
| pm25 | 29 | 40 | 98 | 58 | 56 | 79 | 26 | 13 | 47 | 12 | 16 | 46 | 48 | 58 | 24 |
| no2 | 5.7 | 6.3 | 35 | 32 | 36 | 48 | 29 | 14 | 10 | 7.6 | 8.8 | 6.6 | 20 | 14 | 19 |
| so2 | - | 14 | 21 | 18 | 8.4 | 13 | 6.5 | 6 | 7.8 | 1.9 | 0.46 | 1.6 | - | 5.3 | 1.6 |
| co | - | 389 | 519 | 490 | 424 | 1 | 788 | 443 | 419 | 251 | 174 | - | 100 | 932 | 518 |
| o3 | - | 1.5 | 15 | 9.9 | 16 | 20 | 15 | 12 | 11 | 16 | 40 | 33 | 43 | 56 | 17 |
| pm10 | - | 198 | 97 | 122 | 95 | 117 | 50 | 29 | 38 | 52 | 42 | 139 | 131 | 128 | - |