Air Pollution in Nagla Bhawān: Real-time Air Quality Index and smog alert.
Pollution and air quality forecast for Nagla Bhawān. Today is Wednesday, May 13, 2026. The following air pollution values have been recorded for Nagla Bhawān:- particulate matter (PM2.5) dust - 160 (Very bad Hazardous)
- particulate matter (PM10) suspended dust - 302 (Very bad Hazardous)
- nitrogen dioxide (NO2) - 18 (Good)
- ozone (O3) - 2 (Good)

What is the air quality in Nagla Bhawān today? Is the air polluted in Nagla Bhawān?. Is there smog?
What is the current level of PM2.5 in Nagla Bhawān? (particulate matter (PM2.5) dust)
Today's PM2.5 level is:
160 (Very bad Hazardous)
For comparison, the highest level of PM2.5 in Nagla Bhawān in the last 7 days was: 160 (Monday, October 31, 2022) and the lowest: 160 (Monday, October 31, 2022).
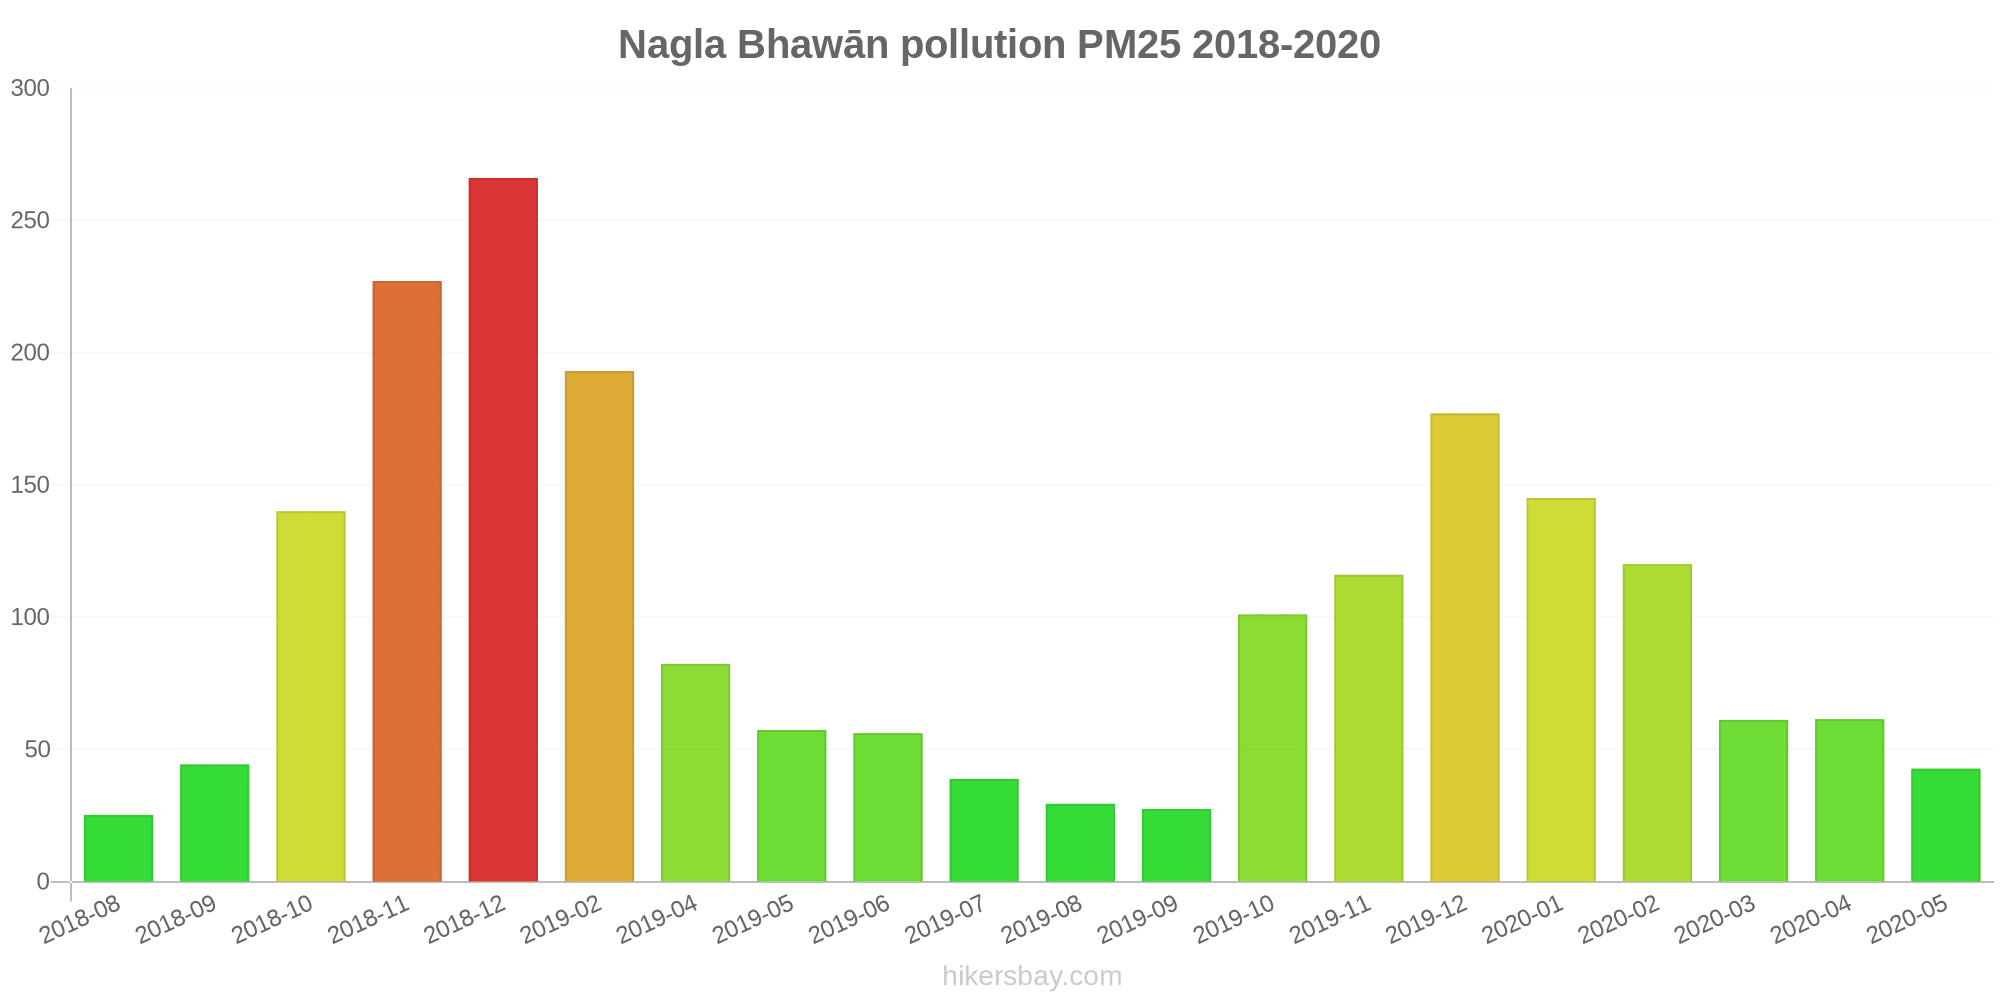
The highest PM2.5 values were recorded: 266 (December 2018).
The lowest level of particulate matter PM2.5 pollution occurs in month: August (25).
What is the level of PM10 today in Nagla Bhawān? (particulate matter (PM10) suspended dust)
The current level of particulate matter PM10 in Nagla Bhawān is:
302 (Very bad Hazardous)
The highest PM10 values usually occur in month: 368 (December 2018).
The lowest value of particulate matter PM10 pollution in Nagla Bhawān is usually recorded in: September (51).
How high is the level of NO2? (nitrogen dioxide (NO2))
18 (Good)
How is the O3 level today in Nagla Bhawān? (ozone (O3))
2 (Good)
Current data Monday, October 31, 2022, 1:00 AM
PM2,5 160 (Very bad Hazardous)
PM10 302 (Very bad Hazardous)
NO2 18 (Good)
O3 2 (Good)
Data on air pollution from recent days in Nagla Bhawān
index
2022-10-31
pm25
160
Very bad Hazardous
pm10
302
Very bad Hazardous
no2
18
Good
o3
2
Good
data source »
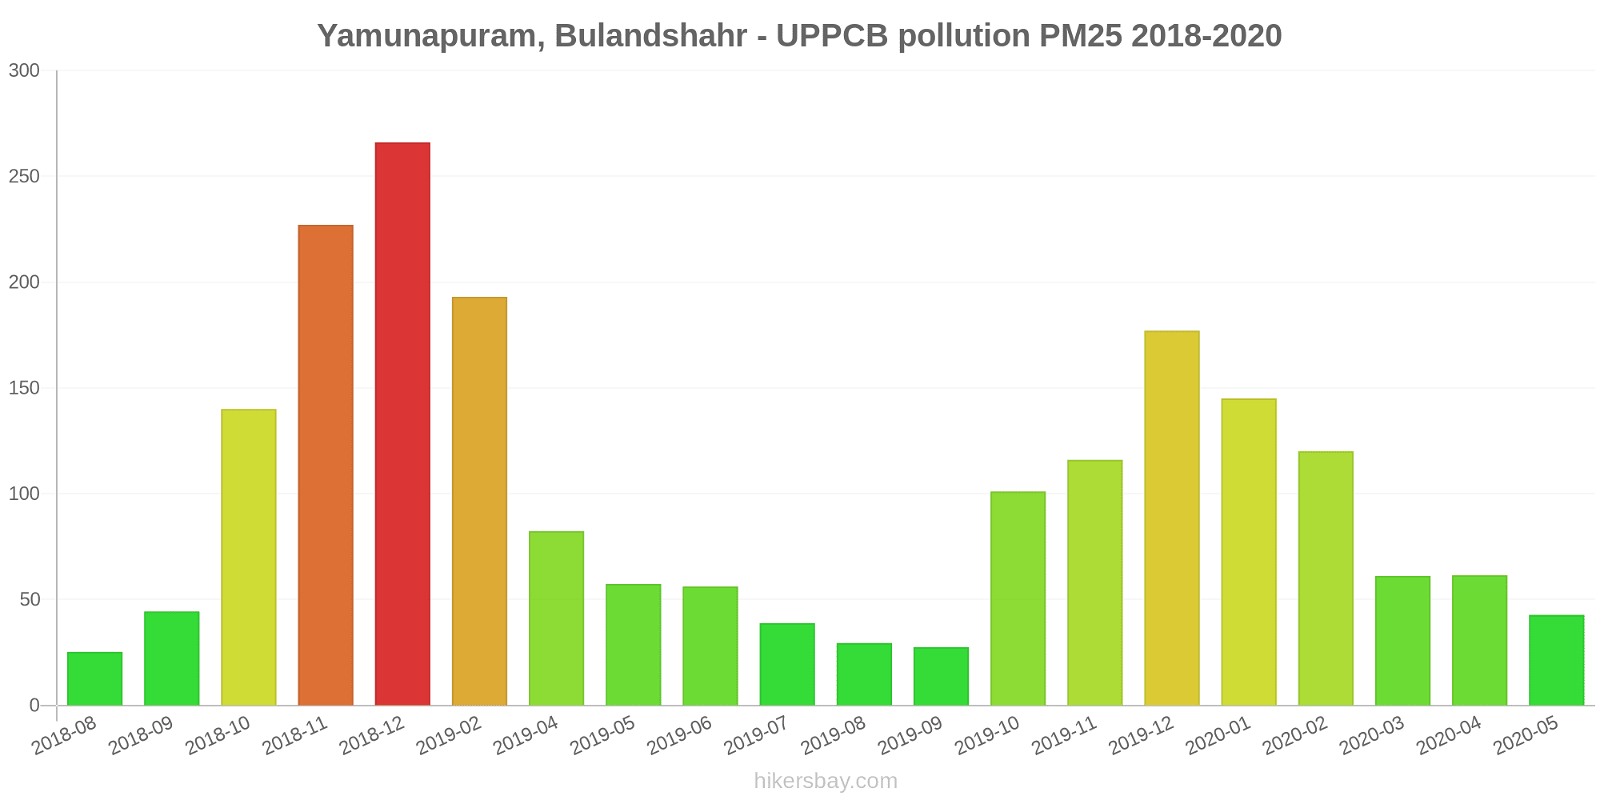
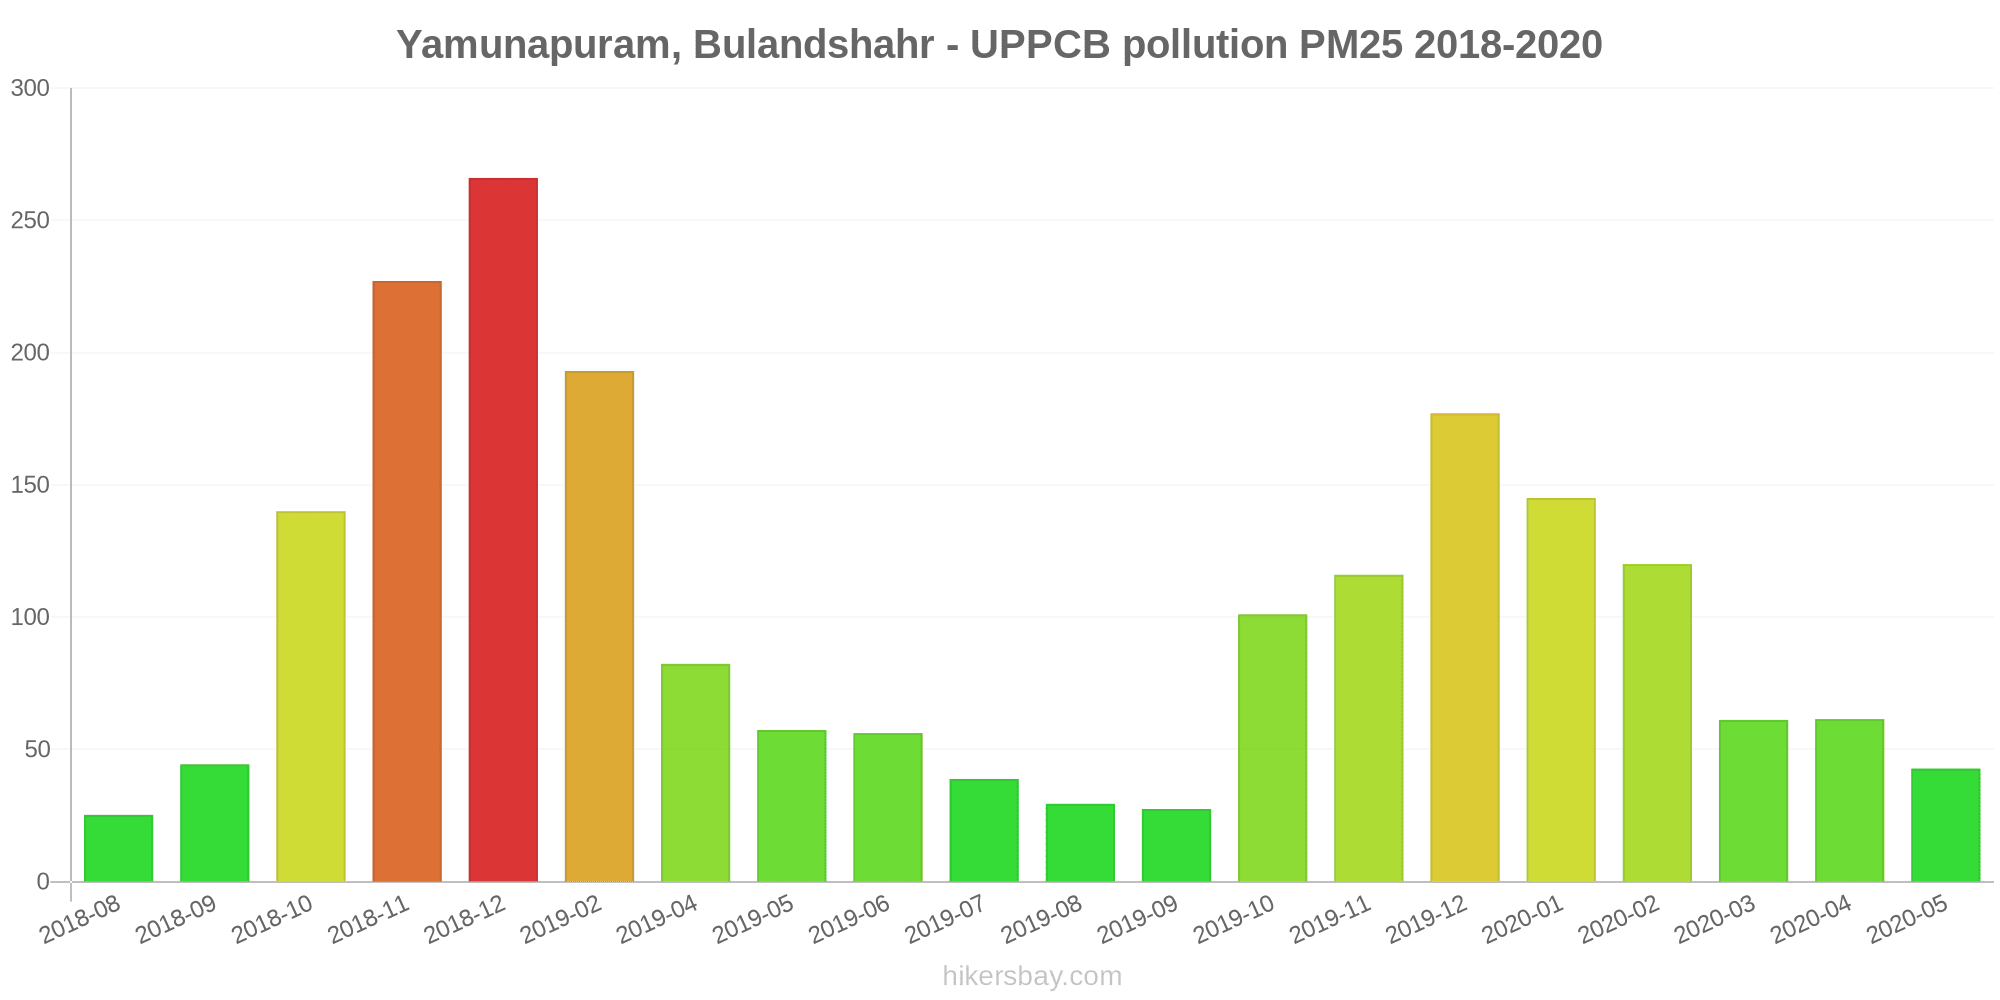
Air pollution in Nagla Bhawān from August 2018 to May 2020

index
2020-05
2020-04
2020-03
2020-02
2020-01
2019-12
2019-11
2019-10
2019-09
2019-08
2019-07
2019-06
2019-05
2019-04
2019-02
2018-12
2018-11
2018-10
2018-09
2018-08
pm25
43 (Unhealthy for Sensitive Groups)
61 (Unhealthy)
61 (Unhealthy)
120 (Very bad Hazardous)
145 (Very bad Hazardous)
177 (Very bad Hazardous)
116 (Very bad Hazardous)
101 (Very Unhealthy)
27 (Moderate)
29 (Moderate)
39 (Unhealthy for Sensitive Groups)
56 (Unhealthy)
57 (Unhealthy)
82 (Very Unhealthy)
193 (Very bad Hazardous)
266 (Very bad Hazardous)
227 (Very bad Hazardous)
140 (Very bad Hazardous)
44 (Unhealthy for Sensitive Groups)
25 (Moderate)
pm10
119 (Very Unhealthy)
158 (Very bad Hazardous)
127 (Very Unhealthy)
206 (Very bad Hazardous)
200 (Very bad Hazardous)
254 (Very bad Hazardous)
268 (Very bad Hazardous)
240 (Very bad Hazardous)
61 (Unhealthy for Sensitive Groups)
56 (Unhealthy for Sensitive Groups)
97 (Unhealthy)
174 (Very bad Hazardous)
251 (Very bad Hazardous)
356 (Very bad Hazardous)
264 (Very bad Hazardous)
368 (Very bad Hazardous)
- (Good)
- (Good)
51 (Unhealthy for Sensitive Groups)
59 (Unhealthy for Sensitive Groups)
no2
13 (Good)
16 (Good)
27 (Good)
49 (Moderate)
49 (Moderate)
51 (Moderate)
65 (Moderate)
48 (Moderate)
13 (Good)
13 (Good)
12 (Good)
28 (Good)
18 (Good)
42 (Moderate)
43 (Moderate)
76 (Moderate)
42 (Moderate)
50 (Moderate)
28 (Good)
16 (Good)
co
899 (Good)
1 (Good)
1 (Good)
1 (Good)
1 (Good)
1 (Good)
1 (Good)
2 (Good)
851 (Good)
816 (Good)
758 (Good)
958 (Good)
832 (Good)
840 (Good)
1 (Good)
1 (Good)
1 (Good)
1 (Good)
1 (Good)
1 (Good)
o3
82 (Moderate)
76 (Moderate)
74 (Moderate)
75 (Moderate)
46 (Good)
48 (Good)
48 (Good)
64 (Good)
34 (Good)
30 (Good)
41 (Good)
70 (Moderate)
96 (Moderate)
79 (Moderate)
49 (Good)
33 (Good)
73 (Moderate)
76 (Moderate)
71 (Moderate)
47 (Good)
so2
12 (Good)
24 (Good)
29 (Good)
30 (Good)
21 (Good)
21 (Good)
33 (Good)
26 (Good)
6.9 (Good)
9.7 (Good)
18 (Good)
35 (Good)
22 (Good)
51 (Moderate)
7.1 (Good)
16 (Good)
19 (Good)
11 (Good)
11 (Good)
5.2 (Good)
data source »
Yamunapuram, Bulandshahr - UPPCB
Monday, October 31, 2022, 1:00 AM
PM2,5 160 (Very bad Hazardous)
particulate matter (PM2.5) dust
PM10 302 (Very bad Hazardous)
particulate matter (PM10) suspended dust
NO2 18 (Good)
nitrogen dioxide (NO2)
O3 1.7 (Good)
ozone (O3)
Yamunapuram, Bulandshahr - UPPCB
index
2022-10-31
pm25
160
pm10
302
no2
18
o3
1.7
Yamunapuram, Bulandshahr - UPPCB
2018-08 2020-05
index
2020-05
2020-04
2020-03
2020-02
2020-01
2019-12
2019-11
2019-10
2019-09
2019-08
2019-07
2019-06
2019-05
2019-04
2019-02
2018-12
2018-11
2018-10
2018-09
2018-08
pm25
43
61
61
120
145
177
116
101
27
29
39
56
57
82
193
266
227
140
44
25
pm10
119
158
127
206
200
254
268
240
61
56
97
174
251
356
264
368
-
-
51
59
no2
13
16
27
49
49
51
65
48
13
13
12
28
18
42
43
76
42
50
28
16
so2
12
24
29
30
21
21
33
26
6.9
9.7
18
35
22
51
7.1
16
19
11
11
5.2
co
899
1
1
1
1
1
1
2
851
816
758
958
832
840
1
1
1
1
1
1
o3
82
76
74
75
46
48
48
64
34
30
41
70
96
79
49
33
73
76
71
47
* Pollution data source:
https://openaq.org
(caaqm)
The data is licensed under CC-By 4.0
PM2,5 160 (Very bad Hazardous)
PM10 302 (Very bad Hazardous)
NO2 18 (Good)
O3 2 (Good)
Data on air pollution from recent days in Nagla Bhawān
| index | 2022-10-31 |
|---|---|
| pm25 | 160 Very bad Hazardous |
| pm10 | 302 Very bad Hazardous |
| no2 | 18 Good |
| o3 | 2 Good |
| index | 2020-05 | 2020-04 | 2020-03 | 2020-02 | 2020-01 | 2019-12 | 2019-11 | 2019-10 | 2019-09 | 2019-08 | 2019-07 | 2019-06 | 2019-05 | 2019-04 | 2019-02 | 2018-12 | 2018-11 | 2018-10 | 2018-09 | 2018-08 |
|---|---|---|---|---|---|---|---|---|---|---|---|---|---|---|---|---|---|---|---|---|
| pm25 | 43 (Unhealthy for Sensitive Groups) | 61 (Unhealthy) | 61 (Unhealthy) | 120 (Very bad Hazardous) | 145 (Very bad Hazardous) | 177 (Very bad Hazardous) | 116 (Very bad Hazardous) | 101 (Very Unhealthy) | 27 (Moderate) | 29 (Moderate) | 39 (Unhealthy for Sensitive Groups) | 56 (Unhealthy) | 57 (Unhealthy) | 82 (Very Unhealthy) | 193 (Very bad Hazardous) | 266 (Very bad Hazardous) | 227 (Very bad Hazardous) | 140 (Very bad Hazardous) | 44 (Unhealthy for Sensitive Groups) | 25 (Moderate) |
| pm10 | 119 (Very Unhealthy) | 158 (Very bad Hazardous) | 127 (Very Unhealthy) | 206 (Very bad Hazardous) | 200 (Very bad Hazardous) | 254 (Very bad Hazardous) | 268 (Very bad Hazardous) | 240 (Very bad Hazardous) | 61 (Unhealthy for Sensitive Groups) | 56 (Unhealthy for Sensitive Groups) | 97 (Unhealthy) | 174 (Very bad Hazardous) | 251 (Very bad Hazardous) | 356 (Very bad Hazardous) | 264 (Very bad Hazardous) | 368 (Very bad Hazardous) | - (Good) | - (Good) | 51 (Unhealthy for Sensitive Groups) | 59 (Unhealthy for Sensitive Groups) |
| no2 | 13 (Good) | 16 (Good) | 27 (Good) | 49 (Moderate) | 49 (Moderate) | 51 (Moderate) | 65 (Moderate) | 48 (Moderate) | 13 (Good) | 13 (Good) | 12 (Good) | 28 (Good) | 18 (Good) | 42 (Moderate) | 43 (Moderate) | 76 (Moderate) | 42 (Moderate) | 50 (Moderate) | 28 (Good) | 16 (Good) |
| co | 899 (Good) | 1 (Good) | 1 (Good) | 1 (Good) | 1 (Good) | 1 (Good) | 1 (Good) | 2 (Good) | 851 (Good) | 816 (Good) | 758 (Good) | 958 (Good) | 832 (Good) | 840 (Good) | 1 (Good) | 1 (Good) | 1 (Good) | 1 (Good) | 1 (Good) | 1 (Good) |
| o3 | 82 (Moderate) | 76 (Moderate) | 74 (Moderate) | 75 (Moderate) | 46 (Good) | 48 (Good) | 48 (Good) | 64 (Good) | 34 (Good) | 30 (Good) | 41 (Good) | 70 (Moderate) | 96 (Moderate) | 79 (Moderate) | 49 (Good) | 33 (Good) | 73 (Moderate) | 76 (Moderate) | 71 (Moderate) | 47 (Good) |
| so2 | 12 (Good) | 24 (Good) | 29 (Good) | 30 (Good) | 21 (Good) | 21 (Good) | 33 (Good) | 26 (Good) | 6.9 (Good) | 9.7 (Good) | 18 (Good) | 35 (Good) | 22 (Good) | 51 (Moderate) | 7.1 (Good) | 16 (Good) | 19 (Good) | 11 (Good) | 11 (Good) | 5.2 (Good) |
PM2,5 160 (Very bad Hazardous)
particulate matter (PM2.5) dustPM10 302 (Very bad Hazardous)
particulate matter (PM10) suspended dustNO2 18 (Good)
nitrogen dioxide (NO2)O3 1.7 (Good)
ozone (O3)Yamunapuram, Bulandshahr - UPPCB
| index | 2022-10-31 |
|---|---|
| pm25 | 160 |
| pm10 | 302 |
| no2 | 18 |
| o3 | 1.7 |
Yamunapuram, Bulandshahr - UPPCB
| index | 2020-05 | 2020-04 | 2020-03 | 2020-02 | 2020-01 | 2019-12 | 2019-11 | 2019-10 | 2019-09 | 2019-08 | 2019-07 | 2019-06 | 2019-05 | 2019-04 | 2019-02 | 2018-12 | 2018-11 | 2018-10 | 2018-09 | 2018-08 |
|---|---|---|---|---|---|---|---|---|---|---|---|---|---|---|---|---|---|---|---|---|
| pm25 | 43 | 61 | 61 | 120 | 145 | 177 | 116 | 101 | 27 | 29 | 39 | 56 | 57 | 82 | 193 | 266 | 227 | 140 | 44 | 25 |
| pm10 | 119 | 158 | 127 | 206 | 200 | 254 | 268 | 240 | 61 | 56 | 97 | 174 | 251 | 356 | 264 | 368 | - | - | 51 | 59 |
| no2 | 13 | 16 | 27 | 49 | 49 | 51 | 65 | 48 | 13 | 13 | 12 | 28 | 18 | 42 | 43 | 76 | 42 | 50 | 28 | 16 |
| so2 | 12 | 24 | 29 | 30 | 21 | 21 | 33 | 26 | 6.9 | 9.7 | 18 | 35 | 22 | 51 | 7.1 | 16 | 19 | 11 | 11 | 5.2 |
| co | 899 | 1 | 1 | 1 | 1 | 1 | 1 | 2 | 851 | 816 | 758 | 958 | 832 | 840 | 1 | 1 | 1 | 1 | 1 | 1 |
| o3 | 82 | 76 | 74 | 75 | 46 | 48 | 48 | 64 | 34 | 30 | 41 | 70 | 96 | 79 | 49 | 33 | 73 | 76 | 71 | 47 |