Air Pollution in Nāmoli: Real-time Air Quality Index and smog alert.
Pollution and air quality forecast for Nāmoli. Today is Wednesday, May 13, 2026. The following air pollution values have been recorded for Nāmoli:- particulate matter (PM2.5) dust - 245 (Very bad Hazardous)
- particulate matter (PM10) suspended dust - 329 (Very bad Hazardous)
- sulfur dioxide (SO2) - 5 (Good)
- carbon monoxide (CO) - 2730 (Moderate)
- ozone (O3) - 2 (Good)
- nitrogen dioxide (NO2) - 36 (Good)

What is the air quality in Nāmoli today? Is the air polluted in Nāmoli?. Is there smog?
What is the current level of PM2.5 in Nāmoli? (particulate matter (PM2.5) dust)
Today's PM2.5 level is:
245 (Very bad Hazardous)
For comparison, the highest level of PM2.5 in Nāmoli in the last 7 days was: 245 (Monday, October 31, 2022) and the lowest: 245 (Monday, October 31, 2022).
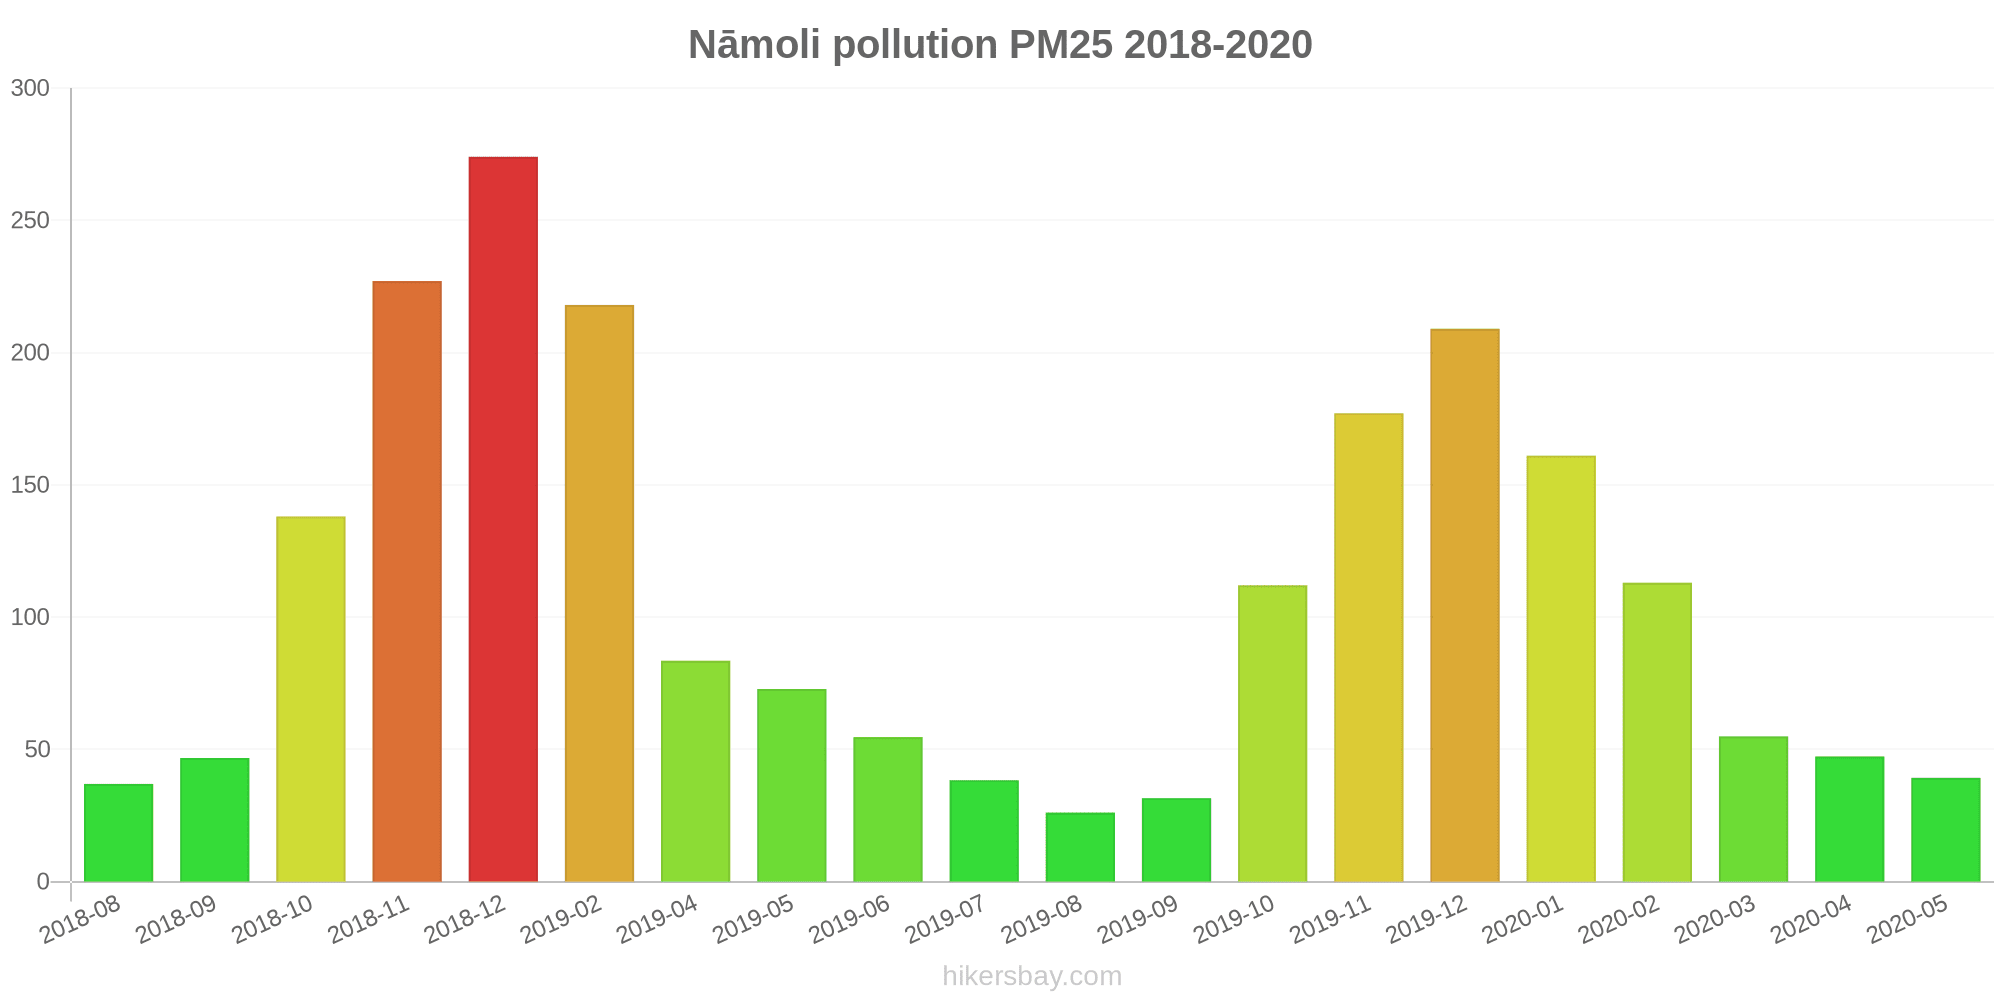
The highest PM2.5 values were recorded: 274 (December 2018).
The lowest level of particulate matter PM2.5 pollution occurs in month: August (26).
What is the level of PM10 today in Nāmoli? (particulate matter (PM10) suspended dust)
The current level of particulate matter PM10 in Nāmoli is:
329 (Very bad Hazardous)
The highest PM10 values usually occur in month: 393 (December 2018).
The lowest value of particulate matter PM10 pollution in Nāmoli is usually recorded in: August (85).
What is the level of SO2 pollution? (sulfur dioxide (SO2))
5 (Good)
How high is the CO level? (carbon monoxide (CO))
2730 (Moderate)
How is the O3 level today in Nāmoli? (ozone (O3))
2 (Good)
How high is the level of NO2? (nitrogen dioxide (NO2))
36 (Good)
Current data Monday, October 31, 2022, 2:00 AM
PM2,5 245 (Very bad Hazardous)
PM10 329 (Very bad Hazardous)
SO2 5 (Good)
CO 2730 (Moderate)
O3 2 (Good)
NO2 36 (Good)
Data on air pollution from recent days in Nāmoli
index
2022-10-31
pm25
245
Very bad Hazardous
pm10
333
Very bad Hazardous
so2
4
Good
co
2550
Moderate
o3
2
Good
no2
34
Good
data source »
Air pollution in Nāmoli from August 2018 to May 2020

index
2020-05
2020-04
2020-03
2020-02
2020-01
2019-12
2019-11
2019-10
2019-09
2019-08
2019-07
2019-06
2019-05
2019-04
2019-02
2018-12
2018-11
2018-10
2018-09
2018-08
pm25
39 (Unhealthy for Sensitive Groups)
47 (Unhealthy for Sensitive Groups)
55 (Unhealthy for Sensitive Groups)
113 (Very bad Hazardous)
161 (Very bad Hazardous)
209 (Very bad Hazardous)
177 (Very bad Hazardous)
112 (Very bad Hazardous)
32 (Moderate)
26 (Moderate)
38 (Unhealthy for Sensitive Groups)
55 (Unhealthy for Sensitive Groups)
73 (Unhealthy)
84 (Very Unhealthy)
218 (Very bad Hazardous)
274 (Very bad Hazardous)
227 (Very bad Hazardous)
138 (Very bad Hazardous)
47 (Unhealthy for Sensitive Groups)
37 (Unhealthy for Sensitive Groups)
pm10
99 (Unhealthy)
120 (Very Unhealthy)
121 (Very Unhealthy)
210 (Very bad Hazardous)
250 (Very bad Hazardous)
308 (Very bad Hazardous)
298 (Very bad Hazardous)
244 (Very bad Hazardous)
89 (Unhealthy)
85 (Unhealthy)
124 (Very Unhealthy)
186 (Very bad Hazardous)
264 (Very bad Hazardous)
317 (Very bad Hazardous)
341 (Very bad Hazardous)
393 (Very bad Hazardous)
363 (Very bad Hazardous)
315 (Very bad Hazardous)
142 (Very Unhealthy)
99 (Unhealthy)
no2
18 (Good)
13 (Good)
37 (Good)
68 (Moderate)
64 (Moderate)
81 (Moderate)
195 (Unhealthy)
123 (Unhealthy for Sensitive Groups)
24 (Good)
27 (Good)
26 (Good)
33 (Good)
42 (Moderate)
56 (Moderate)
80 (Moderate)
113 (Unhealthy for Sensitive Groups)
67 (Moderate)
51 (Moderate)
36 (Good)
21 (Good)
so2
11 (Good)
12 (Good)
14 (Good)
16 (Good)
12 (Good)
11 (Good)
23 (Good)
17 (Good)
16 (Good)
14 (Good)
13 (Good)
24 (Good)
42 (Good)
42 (Good)
17 (Good)
8.8 (Good)
14 (Good)
21 (Good)
11 (Good)
8.2 (Good)
o3
74 (Moderate)
60 (Good)
42 (Good)
40 (Good)
21 (Good)
27 (Good)
43 (Good)
43 (Good)
26 (Good)
24 (Good)
35 (Good)
63 (Good)
76 (Moderate)
76 (Moderate)
- (Good)
28 (Good)
63 (Good)
28 (Good)
16 (Good)
20 (Good)
co
1 (Good)
2 (Good)
3 (Good)
1 (Good)
1 (Good)
1 (Good)
1 (Good)
1 (Good)
1 (Good)
1 (Good)
1 (Good)
1 (Good)
1 (Good)
1 (Good)
1 (Good)
1 (Good)
1 (Good)
2 (Good)
1 (Good)
1 (Good)
data source »
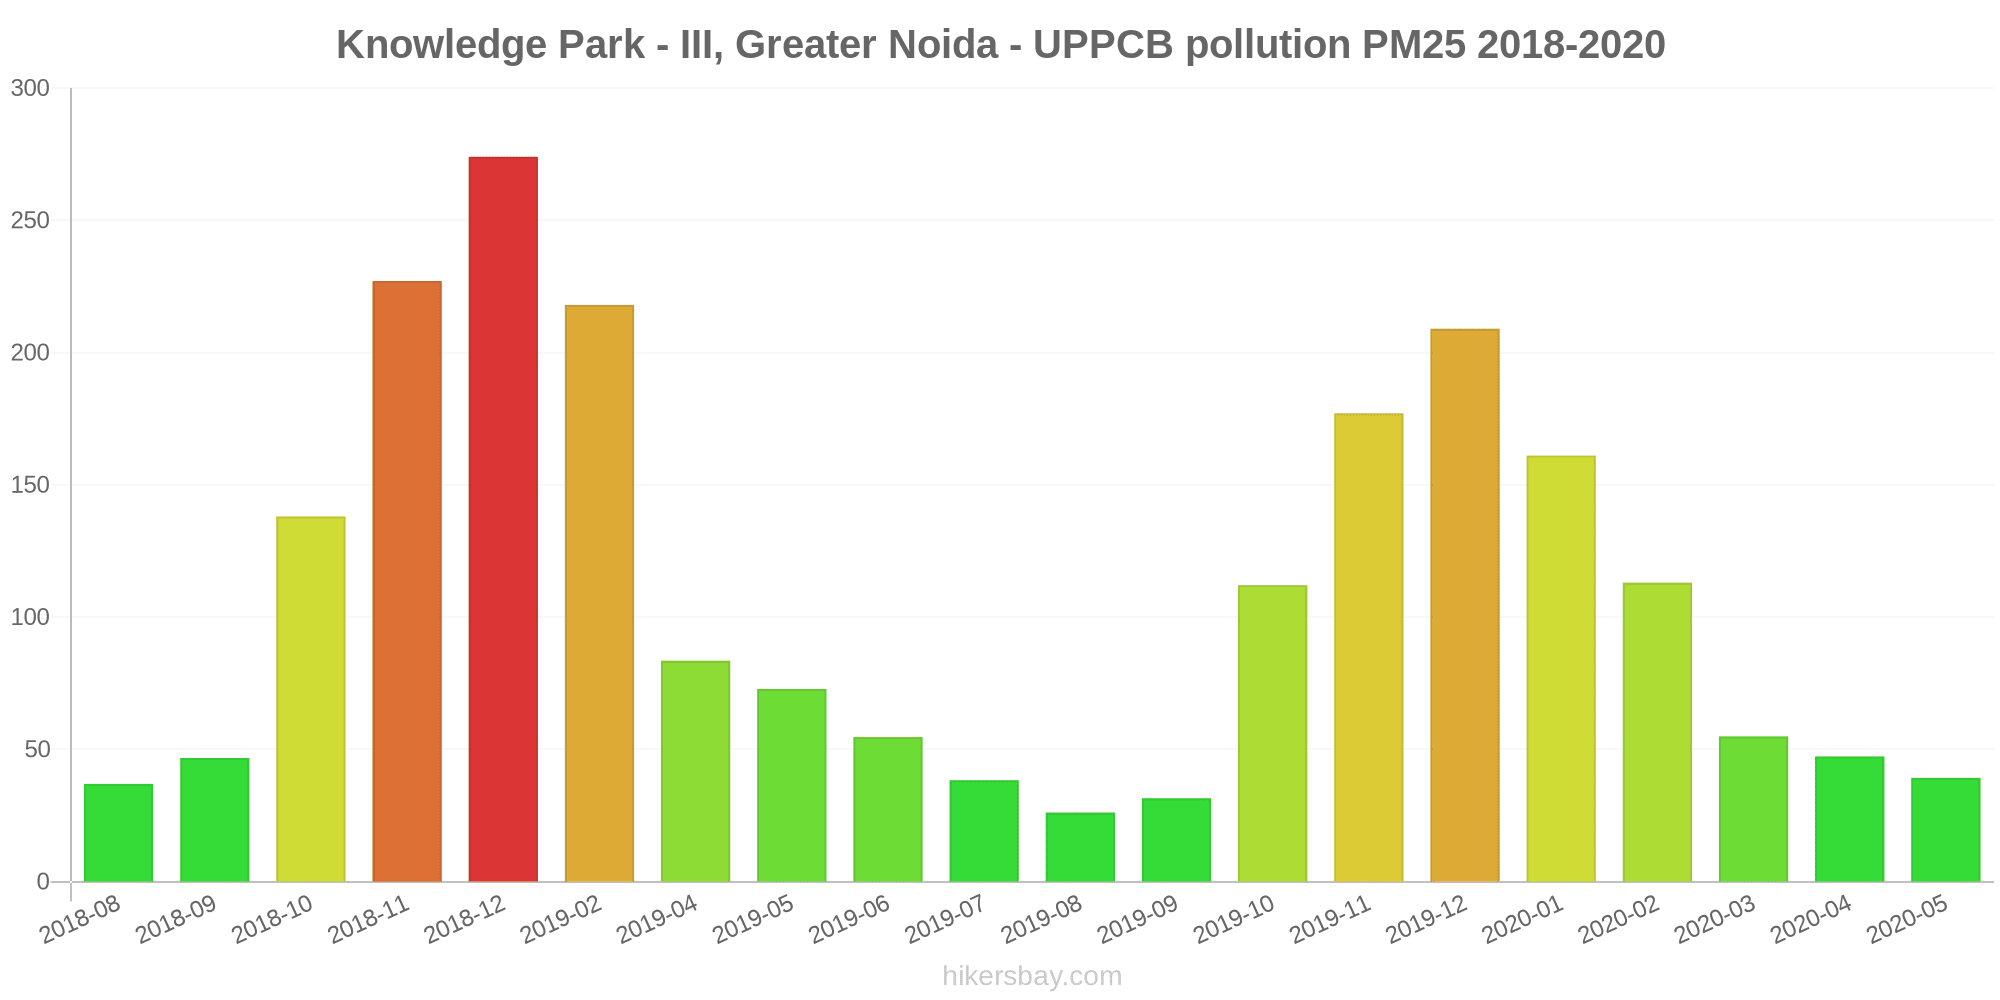
Knowledge Park - III, Greater Noida - UPPCB
Monday, October 31, 2022, 2:00 AM
PM2,5 245 (Very bad Hazardous)
particulate matter (PM2.5) dust
PM10 329 (Very bad Hazardous)
particulate matter (PM10) suspended dust
SO2 4.6 (Good)
sulfur dioxide (SO2)
CO 2730 (Moderate)
carbon monoxide (CO)
O3 2.1 (Good)
ozone (O3)
NO2 36 (Good)
nitrogen dioxide (NO2)
Knowledge Park - III, Greater Noida - UPPCB
index
2022-10-31
pm25
245
pm10
333
so2
3.6
co
2550
o3
1.8
no2
34
Knowledge Park - III, Greater Noida - UPPCB
2018-08 2020-05

index
2020-05
2020-04
2020-03
2020-02
2020-01
2019-12
2019-11
2019-10
2019-09
2019-08
2019-07
2019-06
2019-05
2019-04
2019-02
2018-12
2018-11
2018-10
2018-09
2018-08
pm25
39
47
55
113
161
209
177
112
32
26
38
55
73
84
218
274
227
138
47
37
pm10
99
120
121
210
250
308
298
244
89
85
124
186
264
317
341
393
363
315
142
99
no2
18
13
37
68
64
81
195
123
24
27
26
33
42
56
80
113
67
51
36
21
so2
11
12
14
16
12
11
23
17
16
14
13
24
42
42
17
8.8
14
21
11
8.2
co
1
2
3
1
1
1
1
1
1
1
1
1
1
1
1
1
1
2
1
1
o3
74
60
42
40
21
27
43
43
26
24
35
63
76
76
-
28
63
28
16
20
* Pollution data source:
https://openaq.org
(caaqm)
The data is licensed under CC-By 4.0
PM2,5 245 (Very bad Hazardous)
PM10 329 (Very bad Hazardous)
SO2 5 (Good)
CO 2730 (Moderate)
O3 2 (Good)
NO2 36 (Good)
Data on air pollution from recent days in Nāmoli
| index | 2022-10-31 |
|---|---|
| pm25 | 245 Very bad Hazardous |
| pm10 | 333 Very bad Hazardous |
| so2 | 4 Good |
| co | 2550 Moderate |
| o3 | 2 Good |
| no2 | 34 Good |
| index | 2020-05 | 2020-04 | 2020-03 | 2020-02 | 2020-01 | 2019-12 | 2019-11 | 2019-10 | 2019-09 | 2019-08 | 2019-07 | 2019-06 | 2019-05 | 2019-04 | 2019-02 | 2018-12 | 2018-11 | 2018-10 | 2018-09 | 2018-08 |
|---|---|---|---|---|---|---|---|---|---|---|---|---|---|---|---|---|---|---|---|---|
| pm25 | 39 (Unhealthy for Sensitive Groups) | 47 (Unhealthy for Sensitive Groups) | 55 (Unhealthy for Sensitive Groups) | 113 (Very bad Hazardous) | 161 (Very bad Hazardous) | 209 (Very bad Hazardous) | 177 (Very bad Hazardous) | 112 (Very bad Hazardous) | 32 (Moderate) | 26 (Moderate) | 38 (Unhealthy for Sensitive Groups) | 55 (Unhealthy for Sensitive Groups) | 73 (Unhealthy) | 84 (Very Unhealthy) | 218 (Very bad Hazardous) | 274 (Very bad Hazardous) | 227 (Very bad Hazardous) | 138 (Very bad Hazardous) | 47 (Unhealthy for Sensitive Groups) | 37 (Unhealthy for Sensitive Groups) |
| pm10 | 99 (Unhealthy) | 120 (Very Unhealthy) | 121 (Very Unhealthy) | 210 (Very bad Hazardous) | 250 (Very bad Hazardous) | 308 (Very bad Hazardous) | 298 (Very bad Hazardous) | 244 (Very bad Hazardous) | 89 (Unhealthy) | 85 (Unhealthy) | 124 (Very Unhealthy) | 186 (Very bad Hazardous) | 264 (Very bad Hazardous) | 317 (Very bad Hazardous) | 341 (Very bad Hazardous) | 393 (Very bad Hazardous) | 363 (Very bad Hazardous) | 315 (Very bad Hazardous) | 142 (Very Unhealthy) | 99 (Unhealthy) |
| no2 | 18 (Good) | 13 (Good) | 37 (Good) | 68 (Moderate) | 64 (Moderate) | 81 (Moderate) | 195 (Unhealthy) | 123 (Unhealthy for Sensitive Groups) | 24 (Good) | 27 (Good) | 26 (Good) | 33 (Good) | 42 (Moderate) | 56 (Moderate) | 80 (Moderate) | 113 (Unhealthy for Sensitive Groups) | 67 (Moderate) | 51 (Moderate) | 36 (Good) | 21 (Good) |
| so2 | 11 (Good) | 12 (Good) | 14 (Good) | 16 (Good) | 12 (Good) | 11 (Good) | 23 (Good) | 17 (Good) | 16 (Good) | 14 (Good) | 13 (Good) | 24 (Good) | 42 (Good) | 42 (Good) | 17 (Good) | 8.8 (Good) | 14 (Good) | 21 (Good) | 11 (Good) | 8.2 (Good) |
| o3 | 74 (Moderate) | 60 (Good) | 42 (Good) | 40 (Good) | 21 (Good) | 27 (Good) | 43 (Good) | 43 (Good) | 26 (Good) | 24 (Good) | 35 (Good) | 63 (Good) | 76 (Moderate) | 76 (Moderate) | - (Good) | 28 (Good) | 63 (Good) | 28 (Good) | 16 (Good) | 20 (Good) |
| co | 1 (Good) | 2 (Good) | 3 (Good) | 1 (Good) | 1 (Good) | 1 (Good) | 1 (Good) | 1 (Good) | 1 (Good) | 1 (Good) | 1 (Good) | 1 (Good) | 1 (Good) | 1 (Good) | 1 (Good) | 1 (Good) | 1 (Good) | 2 (Good) | 1 (Good) | 1 (Good) |
PM2,5 245 (Very bad Hazardous)
particulate matter (PM2.5) dustPM10 329 (Very bad Hazardous)
particulate matter (PM10) suspended dustSO2 4.6 (Good)
sulfur dioxide (SO2)CO 2730 (Moderate)
carbon monoxide (CO)O3 2.1 (Good)
ozone (O3)NO2 36 (Good)
nitrogen dioxide (NO2)Knowledge Park - III, Greater Noida - UPPCB
| index | 2022-10-31 |
|---|---|
| pm25 | 245 |
| pm10 | 333 |
| so2 | 3.6 |
| co | 2550 |
| o3 | 1.8 |
| no2 | 34 |
Knowledge Park - III, Greater Noida - UPPCB
| index | 2020-05 | 2020-04 | 2020-03 | 2020-02 | 2020-01 | 2019-12 | 2019-11 | 2019-10 | 2019-09 | 2019-08 | 2019-07 | 2019-06 | 2019-05 | 2019-04 | 2019-02 | 2018-12 | 2018-11 | 2018-10 | 2018-09 | 2018-08 |
|---|---|---|---|---|---|---|---|---|---|---|---|---|---|---|---|---|---|---|---|---|
| pm25 | 39 | 47 | 55 | 113 | 161 | 209 | 177 | 112 | 32 | 26 | 38 | 55 | 73 | 84 | 218 | 274 | 227 | 138 | 47 | 37 |
| pm10 | 99 | 120 | 121 | 210 | 250 | 308 | 298 | 244 | 89 | 85 | 124 | 186 | 264 | 317 | 341 | 393 | 363 | 315 | 142 | 99 |
| no2 | 18 | 13 | 37 | 68 | 64 | 81 | 195 | 123 | 24 | 27 | 26 | 33 | 42 | 56 | 80 | 113 | 67 | 51 | 36 | 21 |
| so2 | 11 | 12 | 14 | 16 | 12 | 11 | 23 | 17 | 16 | 14 | 13 | 24 | 42 | 42 | 17 | 8.8 | 14 | 21 | 11 | 8.2 |
| co | 1 | 2 | 3 | 1 | 1 | 1 | 1 | 1 | 1 | 1 | 1 | 1 | 1 | 1 | 1 | 1 | 1 | 2 | 1 | 1 |
| o3 | 74 | 60 | 42 | 40 | 21 | 27 | 43 | 43 | 26 | 24 | 35 | 63 | 76 | 76 | - | 28 | 63 | 28 | 16 | 20 |