Air Pollution in Pahlād Garhi: Real-time Air Quality Index and smog alert.
Pollution and air quality forecast for Pahlād Garhi. Today is Thursday, May 14, 2026. The following air pollution values have been recorded for Pahlād Garhi:- particulate matter (PM10) suspended dust - 293 (Very bad Hazardous)
- sulfur dioxide (SO2) - 50 (Moderate)
- particulate matter (PM2.5) dust - 166 (Very bad Hazardous)
- carbon monoxide (CO) - 4020 (Moderate)
- nitrogen dioxide (NO2) - 254 (Very Unhealthy)
- ozone (O3) - 0 (Good)

What is the air quality in Pahlād Garhi today? Is the air polluted in Pahlād Garhi?. Is there smog?
What is the level of PM10 today in Pahlād Garhi? (particulate matter (PM10) suspended dust)
The current level of particulate matter PM10 in Pahlād Garhi is:
293 (Very bad Hazardous)
The highest PM10 values usually occur in month: 375 (December 2019).
The lowest value of particulate matter PM10 pollution in Pahlād Garhi is usually recorded in: August (94).
What is the level of SO2 pollution? (sulfur dioxide (SO2))
50 (Moderate)
What is the current level of PM2.5 in Pahlād Garhi? (particulate matter (PM2.5) dust)
Today's PM2.5 level is:
166 (Very bad Hazardous)
For comparison, the highest level of PM2.5 in Pahlād Garhi in the last 7 days was: 172 (Monday, October 31, 2022) and the lowest: 172 (Monday, October 31, 2022).
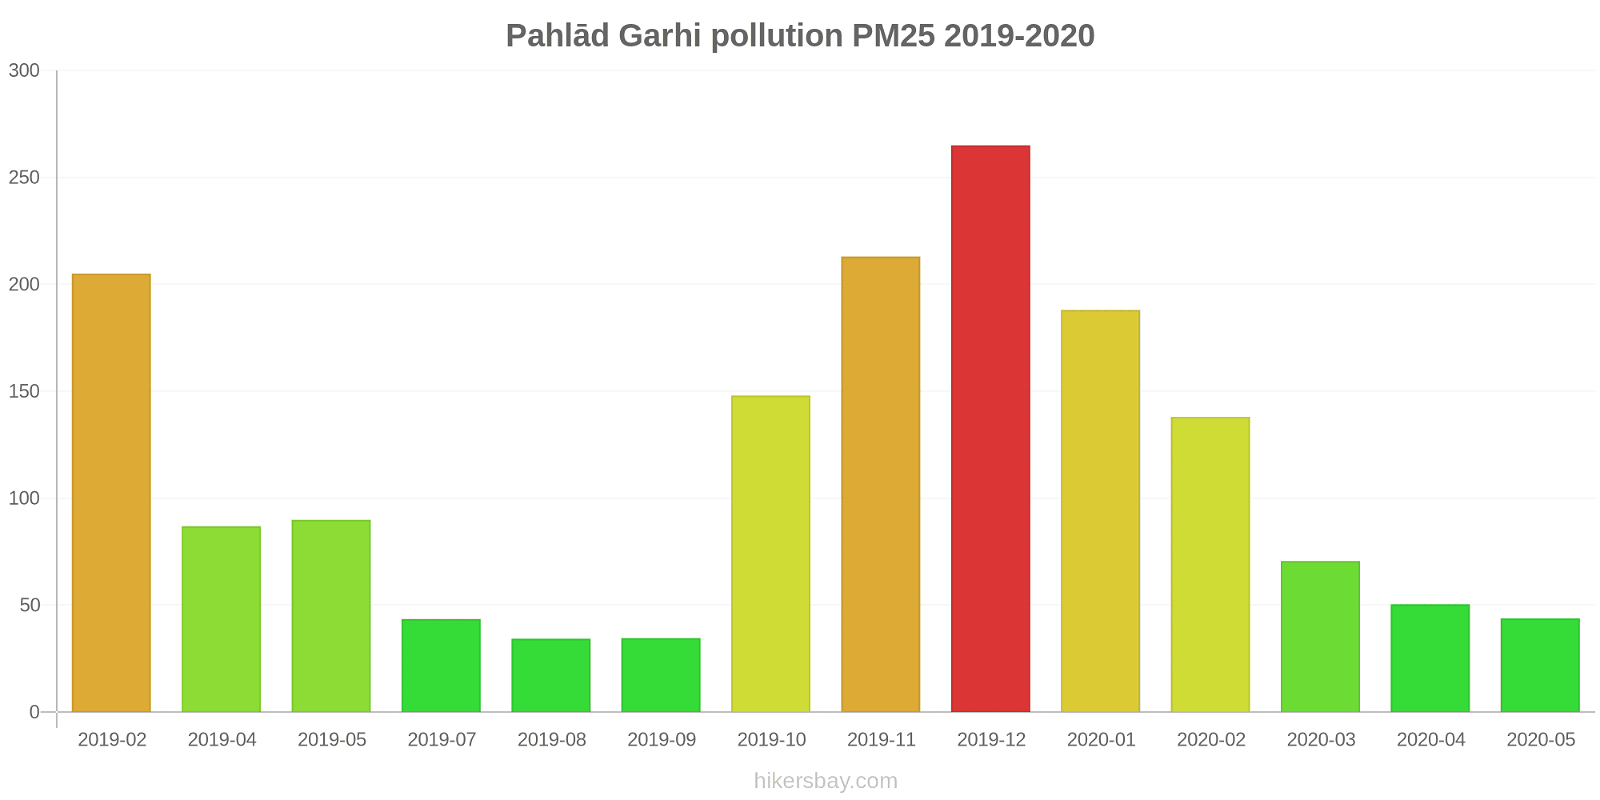
The highest PM2.5 values were recorded: 265 (December 2019).
The lowest level of particulate matter PM2.5 pollution occurs in month: August (34).
How high is the CO level? (carbon monoxide (CO))
4020 (Moderate)
How high is the level of NO2? (nitrogen dioxide (NO2))
254 (Very Unhealthy)
How is the O3 level today in Pahlād Garhi? (ozone (O3))
0 (Good)
Current data Monday, October 31, 2022, 2:00 AM
PM10 293 (Very bad Hazardous)
SO2 50 (Moderate)
PM2,5 166 (Very bad Hazardous)
CO 4020 (Moderate)
NO2 254 (Very Unhealthy)
O3 0 (Good)
Data on air pollution from recent days in Pahlād Garhi
index
2022-10-31
pm10
304
Very bad Hazardous
so2
39
Good
pm25
172
Very bad Hazardous
co
4375
Moderate
no2
251
Very Unhealthy
o3
0
Good
data source »
Air pollution in Pahlād Garhi from February 2019 to May 2020
index
2020-05
2020-04
2020-03
2020-02
2020-01
2019-12
2019-11
2019-10
2019-09
2019-08
2019-07
2019-05
2019-04
2019-02
pm25
44 (Unhealthy for Sensitive Groups)
50 (Unhealthy for Sensitive Groups)
71 (Unhealthy)
138 (Very bad Hazardous)
188 (Very bad Hazardous)
265 (Very bad Hazardous)
213 (Very bad Hazardous)
148 (Very bad Hazardous)
35 (Moderate)
34 (Moderate)
44 (Unhealthy for Sensitive Groups)
90 (Very Unhealthy)
87 (Very Unhealthy)
205 (Very bad Hazardous)
pm10
96 (Unhealthy)
127 (Very Unhealthy)
144 (Very Unhealthy)
242 (Very bad Hazardous)
277 (Very bad Hazardous)
375 (Very bad Hazardous)
346 (Very bad Hazardous)
303 (Very bad Hazardous)
95 (Unhealthy)
94 (Unhealthy)
153 (Very bad Hazardous)
287 (Very bad Hazardous)
360 (Very bad Hazardous)
311 (Very bad Hazardous)
no2
22 (Good)
28 (Good)
44 (Moderate)
66 (Moderate)
71 (Moderate)
74 (Moderate)
66 (Moderate)
53 (Moderate)
27 (Good)
26 (Good)
30 (Good)
65 (Moderate)
66 (Moderate)
97 (Moderate)
so2
22 (Good)
46 (Good)
38 (Good)
34 (Good)
33 (Good)
30 (Good)
31 (Good)
31 (Good)
28 (Good)
29 (Good)
28 (Good)
50 (Moderate)
57 (Moderate)
37 (Good)
co
754 (Good)
787 (Good)
996 (Good)
1 (Good)
1 (Good)
2 (Good)
1 (Good)
1 (Good)
581 (Good)
979 (Good)
994 (Good)
1 (Good)
956 (Good)
2 (Good)
o3
31 (Good)
79 (Moderate)
42 (Good)
43 (Good)
28 (Good)
99 (Moderate)
138 (Unhealthy for Sensitive Groups)
145 (Unhealthy for Sensitive Groups)
39 (Good)
39 (Good)
46 (Good)
55 (Good)
64 (Good)
39 (Good)
data source »
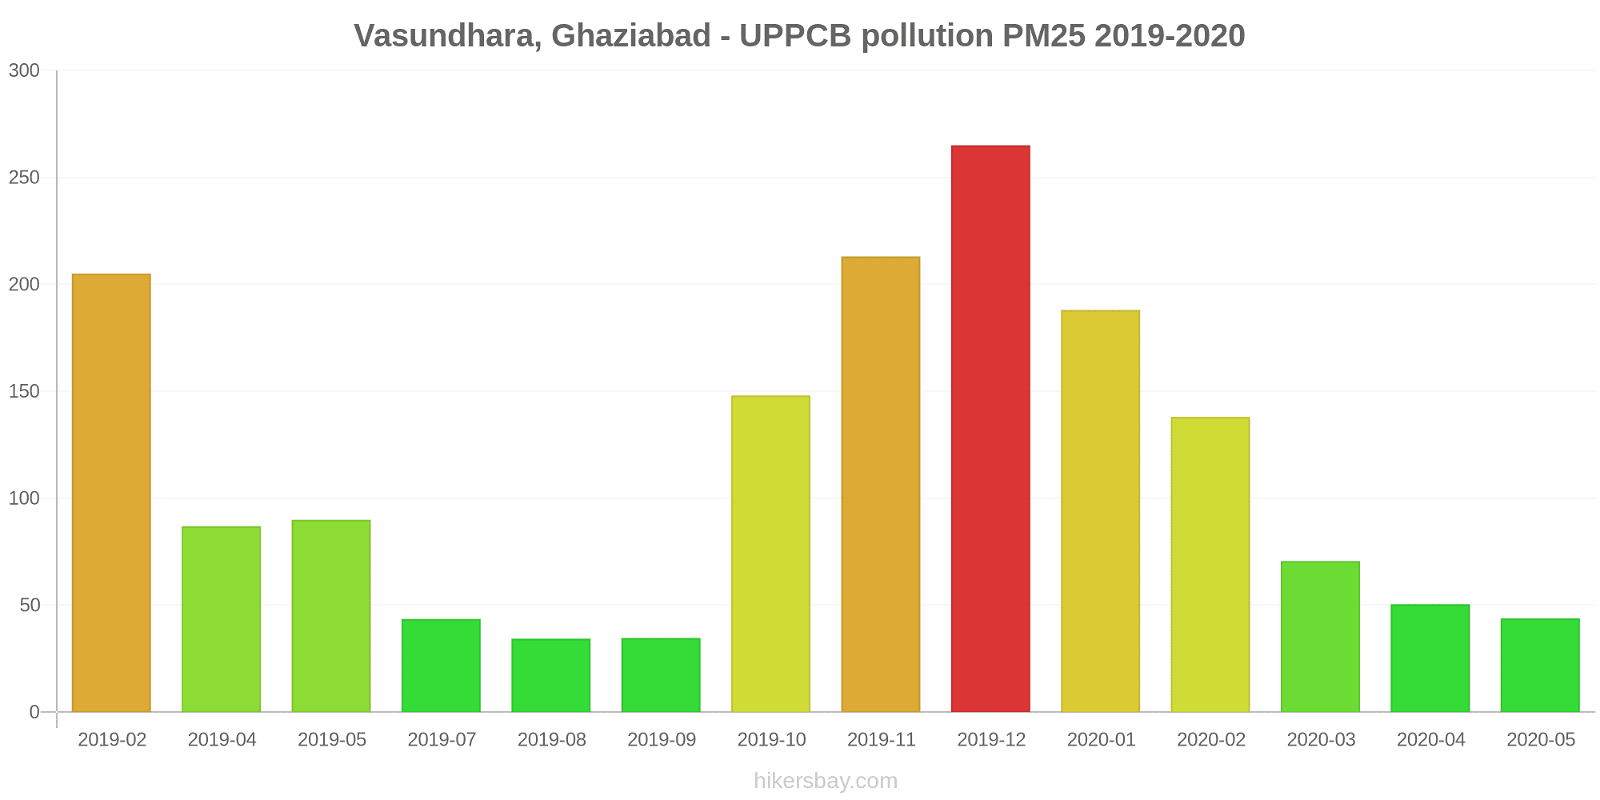
Vasundhara, Ghaziabad, UP - UPPCB
Monday, October 31, 2022, 2:00 AM
PM10 293 (Very bad Hazardous)
particulate matter (PM10) suspended dust
SO2 50 (Moderate)
sulfur dioxide (SO2)
PM2,5 166 (Very bad Hazardous)
particulate matter (PM2.5) dust
CO 4020 (Moderate)
carbon monoxide (CO)
NO2 254 (Very Unhealthy)
nitrogen dioxide (NO2)
O3 0 (Good)
ozone (O3)
Vasundhara, Ghaziabad, UP - UPPCB
index
2022-10-31
pm10
304
so2
39
pm25
172
co
4375
no2
251
o3
0
Vasundhara, Ghaziabad - UPPCB
2019-02 2020-05
index
2020-05
2020-04
2020-03
2020-02
2020-01
2019-12
2019-11
2019-10
2019-09
2019-08
2019-07
2019-05
2019-04
2019-02
pm25
44
50
71
138
188
265
213
148
35
34
44
90
87
205
pm10
96
127
144
242
277
375
346
303
95
94
153
287
360
311
no2
22
28
44
66
71
74
66
53
27
26
30
65
66
97
so2
22
46
38
34
33
30
31
31
28
29
28
50
57
37
co
754
787
996
1
1
2
1
1
581
979
994
1
956
2
o3
31
79
42
43
28
99
138
145
39
39
46
55
64
39
* Pollution data source:
https://openaq.org
(caaqm)
The data is licensed under CC-By 4.0
PM10 293 (Very bad Hazardous)
SO2 50 (Moderate)
PM2,5 166 (Very bad Hazardous)
CO 4020 (Moderate)
NO2 254 (Very Unhealthy)
O3 0 (Good)
Data on air pollution from recent days in Pahlād Garhi
| index | 2022-10-31 |
|---|---|
| pm10 | 304 Very bad Hazardous |
| so2 | 39 Good |
| pm25 | 172 Very bad Hazardous |
| co | 4375 Moderate |
| no2 | 251 Very Unhealthy |
| o3 | 0 Good |

| index | 2020-05 | 2020-04 | 2020-03 | 2020-02 | 2020-01 | 2019-12 | 2019-11 | 2019-10 | 2019-09 | 2019-08 | 2019-07 | 2019-05 | 2019-04 | 2019-02 |
|---|---|---|---|---|---|---|---|---|---|---|---|---|---|---|
| pm25 | 44 (Unhealthy for Sensitive Groups) | 50 (Unhealthy for Sensitive Groups) | 71 (Unhealthy) | 138 (Very bad Hazardous) | 188 (Very bad Hazardous) | 265 (Very bad Hazardous) | 213 (Very bad Hazardous) | 148 (Very bad Hazardous) | 35 (Moderate) | 34 (Moderate) | 44 (Unhealthy for Sensitive Groups) | 90 (Very Unhealthy) | 87 (Very Unhealthy) | 205 (Very bad Hazardous) |
| pm10 | 96 (Unhealthy) | 127 (Very Unhealthy) | 144 (Very Unhealthy) | 242 (Very bad Hazardous) | 277 (Very bad Hazardous) | 375 (Very bad Hazardous) | 346 (Very bad Hazardous) | 303 (Very bad Hazardous) | 95 (Unhealthy) | 94 (Unhealthy) | 153 (Very bad Hazardous) | 287 (Very bad Hazardous) | 360 (Very bad Hazardous) | 311 (Very bad Hazardous) |
| no2 | 22 (Good) | 28 (Good) | 44 (Moderate) | 66 (Moderate) | 71 (Moderate) | 74 (Moderate) | 66 (Moderate) | 53 (Moderate) | 27 (Good) | 26 (Good) | 30 (Good) | 65 (Moderate) | 66 (Moderate) | 97 (Moderate) |
| so2 | 22 (Good) | 46 (Good) | 38 (Good) | 34 (Good) | 33 (Good) | 30 (Good) | 31 (Good) | 31 (Good) | 28 (Good) | 29 (Good) | 28 (Good) | 50 (Moderate) | 57 (Moderate) | 37 (Good) |
| co | 754 (Good) | 787 (Good) | 996 (Good) | 1 (Good) | 1 (Good) | 2 (Good) | 1 (Good) | 1 (Good) | 581 (Good) | 979 (Good) | 994 (Good) | 1 (Good) | 956 (Good) | 2 (Good) |
| o3 | 31 (Good) | 79 (Moderate) | 42 (Good) | 43 (Good) | 28 (Good) | 99 (Moderate) | 138 (Unhealthy for Sensitive Groups) | 145 (Unhealthy for Sensitive Groups) | 39 (Good) | 39 (Good) | 46 (Good) | 55 (Good) | 64 (Good) | 39 (Good) |
PM10 293 (Very bad Hazardous)
particulate matter (PM10) suspended dustSO2 50 (Moderate)
sulfur dioxide (SO2)PM2,5 166 (Very bad Hazardous)
particulate matter (PM2.5) dustCO 4020 (Moderate)
carbon monoxide (CO)NO2 254 (Very Unhealthy)
nitrogen dioxide (NO2)O3 0 (Good)
ozone (O3)Vasundhara, Ghaziabad, UP - UPPCB
| index | 2022-10-31 |
|---|---|
| pm10 | 304 |
| so2 | 39 |
| pm25 | 172 |
| co | 4375 |
| no2 | 251 |
| o3 | 0 |
Vasundhara, Ghaziabad - UPPCB

| index | 2020-05 | 2020-04 | 2020-03 | 2020-02 | 2020-01 | 2019-12 | 2019-11 | 2019-10 | 2019-09 | 2019-08 | 2019-07 | 2019-05 | 2019-04 | 2019-02 |
|---|---|---|---|---|---|---|---|---|---|---|---|---|---|---|
| pm25 | 44 | 50 | 71 | 138 | 188 | 265 | 213 | 148 | 35 | 34 | 44 | 90 | 87 | 205 |
| pm10 | 96 | 127 | 144 | 242 | 277 | 375 | 346 | 303 | 95 | 94 | 153 | 287 | 360 | 311 |
| no2 | 22 | 28 | 44 | 66 | 71 | 74 | 66 | 53 | 27 | 26 | 30 | 65 | 66 | 97 |
| so2 | 22 | 46 | 38 | 34 | 33 | 30 | 31 | 31 | 28 | 29 | 28 | 50 | 57 | 37 |
| co | 754 | 787 | 996 | 1 | 1 | 2 | 1 | 1 | 581 | 979 | 994 | 1 | 956 | 2 |
| o3 | 31 | 79 | 42 | 43 | 28 | 99 | 138 | 145 | 39 | 39 | 46 | 55 | 64 | 39 |