Air Pollution in Jhumil Colony: Real-time Air Quality Index and smog alert.
Pollution and air quality forecast for Jhumil Colony. Today is Wednesday, May 13, 2026. The following air pollution values have been recorded for Jhumil Colony:- particulate matter (PM2.5) dust - 287 (Very bad Hazardous)
- particulate matter (PM10) suspended dust - 421 (Very bad Hazardous)
- sulfur dioxide (SO2) - 1 (Good)
- nitrogen dioxide (NO2) - 21 (Good)
- carbon monoxide (CO) - 3200 (Moderate)
- ozone (O3) - 9 (Good)

What is the air quality in Jhumil Colony today? Is the air polluted in Jhumil Colony?. Is there smog?
What is the current level of PM2.5 in Jhumil Colony? (particulate matter (PM2.5) dust)
Today's PM2.5 level is:
287 (Very bad Hazardous)
For comparison, the highest level of PM2.5 in Jhumil Colony in the last 7 days was: 287 (Monday, October 31, 2022) and the lowest: 287 (Monday, October 31, 2022).
The highest PM2.5 values were recorded: 283 (December 2018).
The lowest level of particulate matter PM2.5 pollution occurs in month: August (32).
What is the level of PM10 today in Jhumil Colony? (particulate matter (PM10) suspended dust)
The current level of particulate matter PM10 in Jhumil Colony is:
421 (Very bad Hazardous)
The highest PM10 values usually occur in month: 439 (December 2018).
The lowest value of particulate matter PM10 pollution in Jhumil Colony is usually recorded in: August (90).
What is the level of SO2 pollution? (sulfur dioxide (SO2))
1 (Good)
How high is the level of NO2? (nitrogen dioxide (NO2))
21 (Good)
How high is the CO level? (carbon monoxide (CO))
3200 (Moderate)
How is the O3 level today in Jhumil Colony? (ozone (O3))
9 (Good)
Current data Monday, October 31, 2022, 12:45 AM
PM2,5 287 (Very bad Hazardous)
PM10 421 (Very bad Hazardous)
SO2 1 (Good)
NO2 21 (Good)
CO 3200 (Moderate)
O3 9 (Good)
Data on air pollution from recent days in Jhumil Colony
index
2022-10-31
pm25
287
Very bad Hazardous
pm10
421
Very bad Hazardous
so2
1
Good
no2
21
Good
co
3200
Moderate
o3
9
Good
data source »
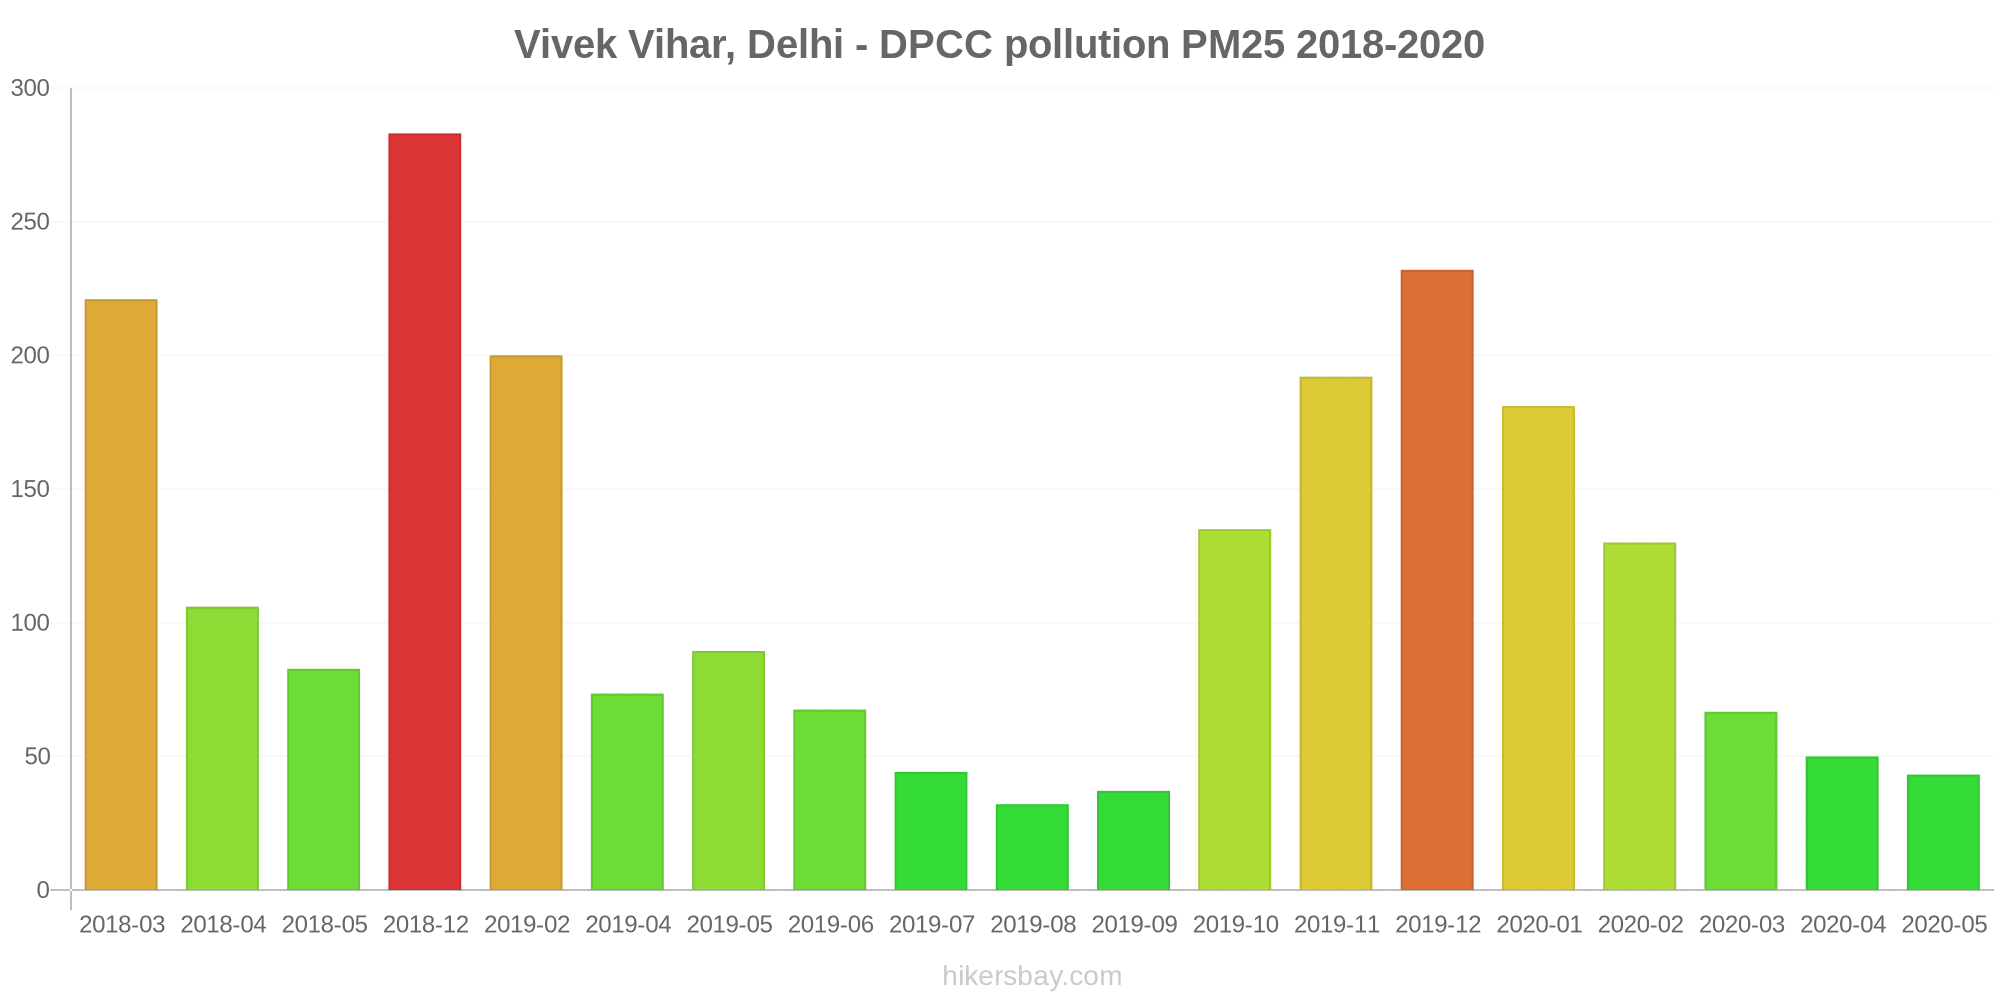
Air pollution in Jhumil Colony from March 2018 to May 2020

index
2020-05
2020-04
2020-03
2020-02
2020-01
2019-12
2019-11
2019-10
2019-09
2019-08
2019-07
2019-06
2019-05
2019-04
2019-02
2018-12
2018-05
2018-04
2018-03
pm25
43 (Unhealthy for Sensitive Groups)
50 (Unhealthy for Sensitive Groups)
67 (Unhealthy)
130 (Very bad Hazardous)
181 (Very bad Hazardous)
232 (Very bad Hazardous)
192 (Very bad Hazardous)
135 (Very bad Hazardous)
37 (Unhealthy for Sensitive Groups)
32 (Moderate)
44 (Unhealthy for Sensitive Groups)
68 (Unhealthy)
89 (Very Unhealthy)
74 (Unhealthy)
200 (Very bad Hazardous)
283 (Very bad Hazardous)
83 (Very Unhealthy)
106 (Very Unhealthy)
221 (Very bad Hazardous)
pm10
113 (Very Unhealthy)
110 (Very Unhealthy)
139 (Very Unhealthy)
231 (Very bad Hazardous)
269 (Very bad Hazardous)
342 (Very bad Hazardous)
288 (Very bad Hazardous)
254 (Very bad Hazardous)
94 (Unhealthy)
90 (Unhealthy)
163 (Very bad Hazardous)
212 (Very bad Hazardous)
260 (Very bad Hazardous)
314 (Very bad Hazardous)
350 (Very bad Hazardous)
439 (Very bad Hazardous)
206 (Very bad Hazardous)
240 (Very bad Hazardous)
204 (Very bad Hazardous)
no2
22 (Good)
28 (Good)
43 (Moderate)
57 (Moderate)
41 (Moderate)
16 (Good)
19 (Good)
24 (Good)
14 (Good)
22 (Good)
17 (Good)
31 (Good)
38 (Good)
52 (Moderate)
52 (Moderate)
62 (Moderate)
18 (Good)
20 (Good)
36 (Good)
so2
36 (Good)
29 (Good)
29 (Good)
21 (Good)
15 (Good)
11 (Good)
17 (Good)
23 (Good)
22 (Good)
14 (Good)
12 (Good)
17 (Good)
25 (Good)
32 (Good)
25 (Good)
13 (Good)
6.2 (Good)
10 (Good)
13 (Good)
co
1 (Good)
1 (Good)
1 (Good)
1 (Good)
1 (Good)
1 (Good)
1 (Good)
1 (Good)
665 (Good)
754 (Good)
945 (Good)
1 (Good)
1 (Good)
1 (Good)
1 (Good)
2 (Good)
1 (Good)
44 (Good)
68 (Good)
o3
67 (Good)
52 (Good)
33 (Good)
30 (Good)
19 (Good)
18 (Good)
23 (Good)
41 (Good)
51 (Good)
32 (Good)
46 (Good)
53 (Good)
80 (Moderate)
60 (Good)
44 (Good)
22 (Good)
72 (Moderate)
73 (Moderate)
37 (Good)
data source »
Vivek Vihar, Delhi - DPCC
Monday, October 31, 2022, 12:45 AM
PM2,5 287 (Very bad Hazardous)
particulate matter (PM2.5) dust
PM10 421 (Very bad Hazardous)
particulate matter (PM10) suspended dust
SO2 0.6 (Good)
sulfur dioxide (SO2)
NO2 21 (Good)
nitrogen dioxide (NO2)
CO 3200 (Moderate)
carbon monoxide (CO)
O3 9 (Good)
ozone (O3)
Vivek Vihar, Delhi - DPCC
index
2022-10-31
pm25
287
pm10
421
so2
0.6
no2
21
co
3200
o3
9
Vivek Vihar, Delhi - DPCC
2018-03 2020-05

index
2020-05
2020-04
2020-03
2020-02
2020-01
2019-12
2019-11
2019-10
2019-09
2019-08
2019-07
2019-06
2019-05
2019-04
2019-02
2018-12
2018-05
2018-04
2018-03
pm25
43
50
67
130
181
232
192
135
37
32
44
68
89
74
200
283
83
106
221
pm10
113
110
139
231
269
342
288
254
94
90
163
212
260
314
350
439
206
240
204
no2
22
28
43
57
41
16
19
24
14
22
17
31
38
52
52
62
18
20
36
so2
36
29
29
21
15
11
17
23
22
14
12
17
25
32
25
13
6.2
10
13
co
1
1
1
1
1
1
1
1
665
754
945
1
1
1
1
2
1
44
68
o3
67
52
33
30
19
18
23
41
51
32
46
53
80
60
44
22
72
73
37
* Pollution data source:
https://openaq.org
(caaqm)
The data is licensed under CC-By 4.0
PM2,5 287 (Very bad Hazardous)
PM10 421 (Very bad Hazardous)
SO2 1 (Good)
NO2 21 (Good)
CO 3200 (Moderate)
O3 9 (Good)
Data on air pollution from recent days in Jhumil Colony
| index | 2022-10-31 |
|---|---|
| pm25 | 287 Very bad Hazardous |
| pm10 | 421 Very bad Hazardous |
| so2 | 1 Good |
| no2 | 21 Good |
| co | 3200 Moderate |
| o3 | 9 Good |

| index | 2020-05 | 2020-04 | 2020-03 | 2020-02 | 2020-01 | 2019-12 | 2019-11 | 2019-10 | 2019-09 | 2019-08 | 2019-07 | 2019-06 | 2019-05 | 2019-04 | 2019-02 | 2018-12 | 2018-05 | 2018-04 | 2018-03 |
|---|---|---|---|---|---|---|---|---|---|---|---|---|---|---|---|---|---|---|---|
| pm25 | 43 (Unhealthy for Sensitive Groups) | 50 (Unhealthy for Sensitive Groups) | 67 (Unhealthy) | 130 (Very bad Hazardous) | 181 (Very bad Hazardous) | 232 (Very bad Hazardous) | 192 (Very bad Hazardous) | 135 (Very bad Hazardous) | 37 (Unhealthy for Sensitive Groups) | 32 (Moderate) | 44 (Unhealthy for Sensitive Groups) | 68 (Unhealthy) | 89 (Very Unhealthy) | 74 (Unhealthy) | 200 (Very bad Hazardous) | 283 (Very bad Hazardous) | 83 (Very Unhealthy) | 106 (Very Unhealthy) | 221 (Very bad Hazardous) |
| pm10 | 113 (Very Unhealthy) | 110 (Very Unhealthy) | 139 (Very Unhealthy) | 231 (Very bad Hazardous) | 269 (Very bad Hazardous) | 342 (Very bad Hazardous) | 288 (Very bad Hazardous) | 254 (Very bad Hazardous) | 94 (Unhealthy) | 90 (Unhealthy) | 163 (Very bad Hazardous) | 212 (Very bad Hazardous) | 260 (Very bad Hazardous) | 314 (Very bad Hazardous) | 350 (Very bad Hazardous) | 439 (Very bad Hazardous) | 206 (Very bad Hazardous) | 240 (Very bad Hazardous) | 204 (Very bad Hazardous) |
| no2 | 22 (Good) | 28 (Good) | 43 (Moderate) | 57 (Moderate) | 41 (Moderate) | 16 (Good) | 19 (Good) | 24 (Good) | 14 (Good) | 22 (Good) | 17 (Good) | 31 (Good) | 38 (Good) | 52 (Moderate) | 52 (Moderate) | 62 (Moderate) | 18 (Good) | 20 (Good) | 36 (Good) |
| so2 | 36 (Good) | 29 (Good) | 29 (Good) | 21 (Good) | 15 (Good) | 11 (Good) | 17 (Good) | 23 (Good) | 22 (Good) | 14 (Good) | 12 (Good) | 17 (Good) | 25 (Good) | 32 (Good) | 25 (Good) | 13 (Good) | 6.2 (Good) | 10 (Good) | 13 (Good) |
| co | 1 (Good) | 1 (Good) | 1 (Good) | 1 (Good) | 1 (Good) | 1 (Good) | 1 (Good) | 1 (Good) | 665 (Good) | 754 (Good) | 945 (Good) | 1 (Good) | 1 (Good) | 1 (Good) | 1 (Good) | 2 (Good) | 1 (Good) | 44 (Good) | 68 (Good) |
| o3 | 67 (Good) | 52 (Good) | 33 (Good) | 30 (Good) | 19 (Good) | 18 (Good) | 23 (Good) | 41 (Good) | 51 (Good) | 32 (Good) | 46 (Good) | 53 (Good) | 80 (Moderate) | 60 (Good) | 44 (Good) | 22 (Good) | 72 (Moderate) | 73 (Moderate) | 37 (Good) |
PM2,5 287 (Very bad Hazardous)
particulate matter (PM2.5) dustPM10 421 (Very bad Hazardous)
particulate matter (PM10) suspended dustSO2 0.6 (Good)
sulfur dioxide (SO2)NO2 21 (Good)
nitrogen dioxide (NO2)CO 3200 (Moderate)
carbon monoxide (CO)O3 9 (Good)
ozone (O3)Vivek Vihar, Delhi - DPCC
| index | 2022-10-31 |
|---|---|
| pm25 | 287 |
| pm10 | 421 |
| so2 | 0.6 |
| no2 | 21 |
| co | 3200 |
| o3 | 9 |
Vivek Vihar, Delhi - DPCC
| index | 2020-05 | 2020-04 | 2020-03 | 2020-02 | 2020-01 | 2019-12 | 2019-11 | 2019-10 | 2019-09 | 2019-08 | 2019-07 | 2019-06 | 2019-05 | 2019-04 | 2019-02 | 2018-12 | 2018-05 | 2018-04 | 2018-03 |
|---|---|---|---|---|---|---|---|---|---|---|---|---|---|---|---|---|---|---|---|
| pm25 | 43 | 50 | 67 | 130 | 181 | 232 | 192 | 135 | 37 | 32 | 44 | 68 | 89 | 74 | 200 | 283 | 83 | 106 | 221 |
| pm10 | 113 | 110 | 139 | 231 | 269 | 342 | 288 | 254 | 94 | 90 | 163 | 212 | 260 | 314 | 350 | 439 | 206 | 240 | 204 |
| no2 | 22 | 28 | 43 | 57 | 41 | 16 | 19 | 24 | 14 | 22 | 17 | 31 | 38 | 52 | 52 | 62 | 18 | 20 | 36 |
| so2 | 36 | 29 | 29 | 21 | 15 | 11 | 17 | 23 | 22 | 14 | 12 | 17 | 25 | 32 | 25 | 13 | 6.2 | 10 | 13 |
| co | 1 | 1 | 1 | 1 | 1 | 1 | 1 | 1 | 665 | 754 | 945 | 1 | 1 | 1 | 1 | 2 | 1 | 44 | 68 |
| o3 | 67 | 52 | 33 | 30 | 19 | 18 | 23 | 41 | 51 | 32 | 46 | 53 | 80 | 60 | 44 | 22 | 72 | 73 | 37 |