Air Pollution in Soharkha: Real-time Air Quality Index and smog alert.
Pollution and air quality forecast for Soharkha. Today is Friday, May 15, 2026. The following air pollution values have been recorded for Soharkha:- sulfur dioxide (SO2) - 10 (Good)
- nitrogen dioxide (NO2) - 15 (Good)
- particulate matter (PM2.5) dust - 77 (Very Unhealthy)
- ozone (O3) - 122 (Unhealthy for Sensitive Groups)
- particulate matter (PM10) suspended dust - 186 (Very bad Hazardous)

What is the air quality in Soharkha today? Is the air polluted in Soharkha?. Is there smog?
What is the level of SO2 pollution? (sulfur dioxide (SO2))
10 (Good)
How high is the level of NO2? (nitrogen dioxide (NO2))
15 (Good)
What is the current level of PM2.5 in Soharkha? (particulate matter (PM2.5) dust)
Today's PM2.5 level is:
77 (Very Unhealthy)
For comparison, the highest level of PM2.5 in Soharkha in the last 7 days was: 96 (Friday, October 14, 2022) and the lowest: 3 (Saturday, October 8, 2022).
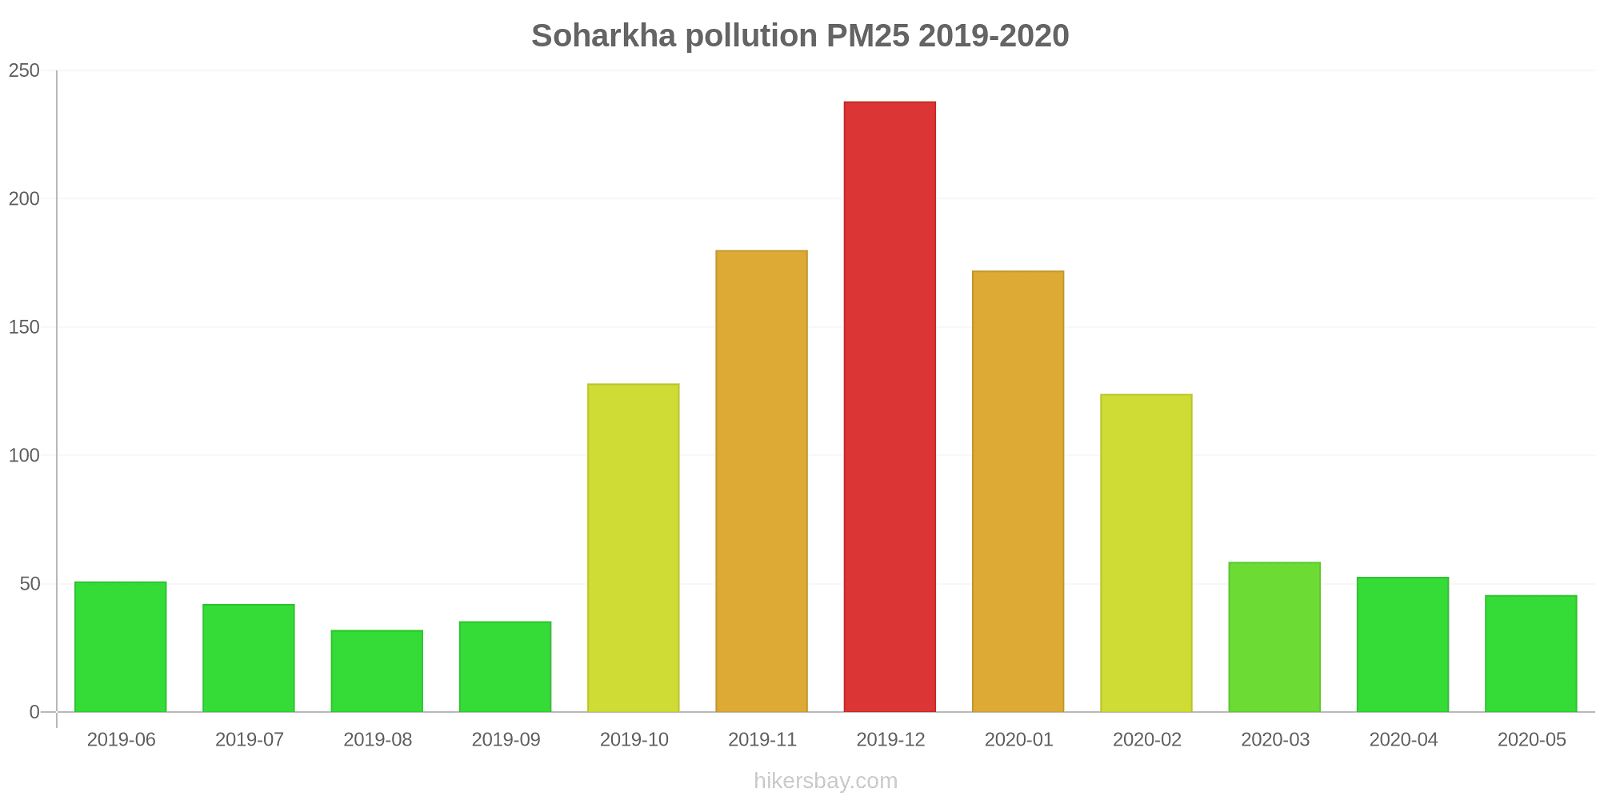
The highest PM2.5 values were recorded: 238 (December 2019).
The lowest level of particulate matter PM2.5 pollution occurs in month: August (32).
How is the O3 level today in Soharkha? (ozone (O3))
122 (Unhealthy for Sensitive Groups)
What is the level of PM10 today in Soharkha? (particulate matter (PM10) suspended dust)
The current level of particulate matter PM10 in Soharkha is:
186 (Very bad Hazardous)
The highest PM10 values usually occur in month: 318 (December 2019).
The lowest value of particulate matter PM10 pollution in Soharkha is usually recorded in: August (81).
Current data Friday, October 14, 2022, 6:00 AM
SO2 10 (Good)
NO2 15 (Good)
PM2,5 77 (Very Unhealthy)
O3 122 (Unhealthy for Sensitive Groups)
PM10 186 (Very bad Hazardous)
Data on air pollution from recent days in Soharkha
index
2022-10-07
2022-10-08
2022-10-09
2022-10-10
2022-10-11
2022-10-12
2022-10-13
2022-10-14
pm10
29
Moderate
7
Good
6
Good
13
Good
175
Very bad Hazardous
207
Very bad Hazardous
173
Very bad Hazardous
203
Very bad Hazardous
no2
9
Good
10
Good
9
Good
8
Good
24
Good
38
Good
33
Good
29
Good
pm25
11
Good
3
Good
6
Good
6
Good
37
Unhealthy for Sensitive Groups
91
Very Unhealthy
67
Unhealthy
96
Very Unhealthy
so2
7
Good
11
Good
10
Good
11
Good
7
Good
6
Good
6
Good
7
Good
o3
-
Good
22
Good
26
Good
30
Good
30
Good
59
Good
40
Good
53
Good
data source »
Air pollution in Soharkha from June 2019 to May 2020
index
2020-05
2020-04
2020-03
2020-02
2020-01
2019-12
2019-11
2019-10
2019-09
2019-08
2019-07
2019-06
pm25
46 (Unhealthy for Sensitive Groups)
53 (Unhealthy for Sensitive Groups)
59 (Unhealthy)
124 (Very bad Hazardous)
172 (Very bad Hazardous)
238 (Very bad Hazardous)
180 (Very bad Hazardous)
128 (Very bad Hazardous)
35 (Unhealthy for Sensitive Groups)
32 (Moderate)
42 (Unhealthy for Sensitive Groups)
51 (Unhealthy for Sensitive Groups)
pm10
111 (Very Unhealthy)
115 (Very Unhealthy)
117 (Very Unhealthy)
202 (Very bad Hazardous)
237 (Very bad Hazardous)
318 (Very bad Hazardous)
273 (Very bad Hazardous)
241 (Very bad Hazardous)
87 (Unhealthy)
81 (Unhealthy)
143 (Very Unhealthy)
317 (Very bad Hazardous)
no2
13 (Good)
19 (Good)
33 (Good)
52 (Moderate)
64 (Moderate)
89 (Moderate)
121 (Unhealthy for Sensitive Groups)
70 (Moderate)
23 (Good)
26 (Good)
25 (Good)
40 (Moderate)
so2
8.2 (Good)
10 (Good)
10 (Good)
13 (Good)
11 (Good)
5.8 (Good)
13 (Good)
13 (Good)
7.9 (Good)
5.4 (Good)
8.8 (Good)
13 (Good)
co
1 (Good)
962 (Good)
674 (Good)
1 (Good)
2 (Good)
2 (Good)
2 (Good)
1 (Good)
813 (Good)
985 (Good)
940 (Good)
1 (Good)
o3
38 (Good)
36 (Good)
23 (Good)
17 (Good)
12 (Good)
34 (Good)
29 (Good)
39 (Good)
31 (Good)
27 (Good)
36 (Good)
45 (Good)
data source »
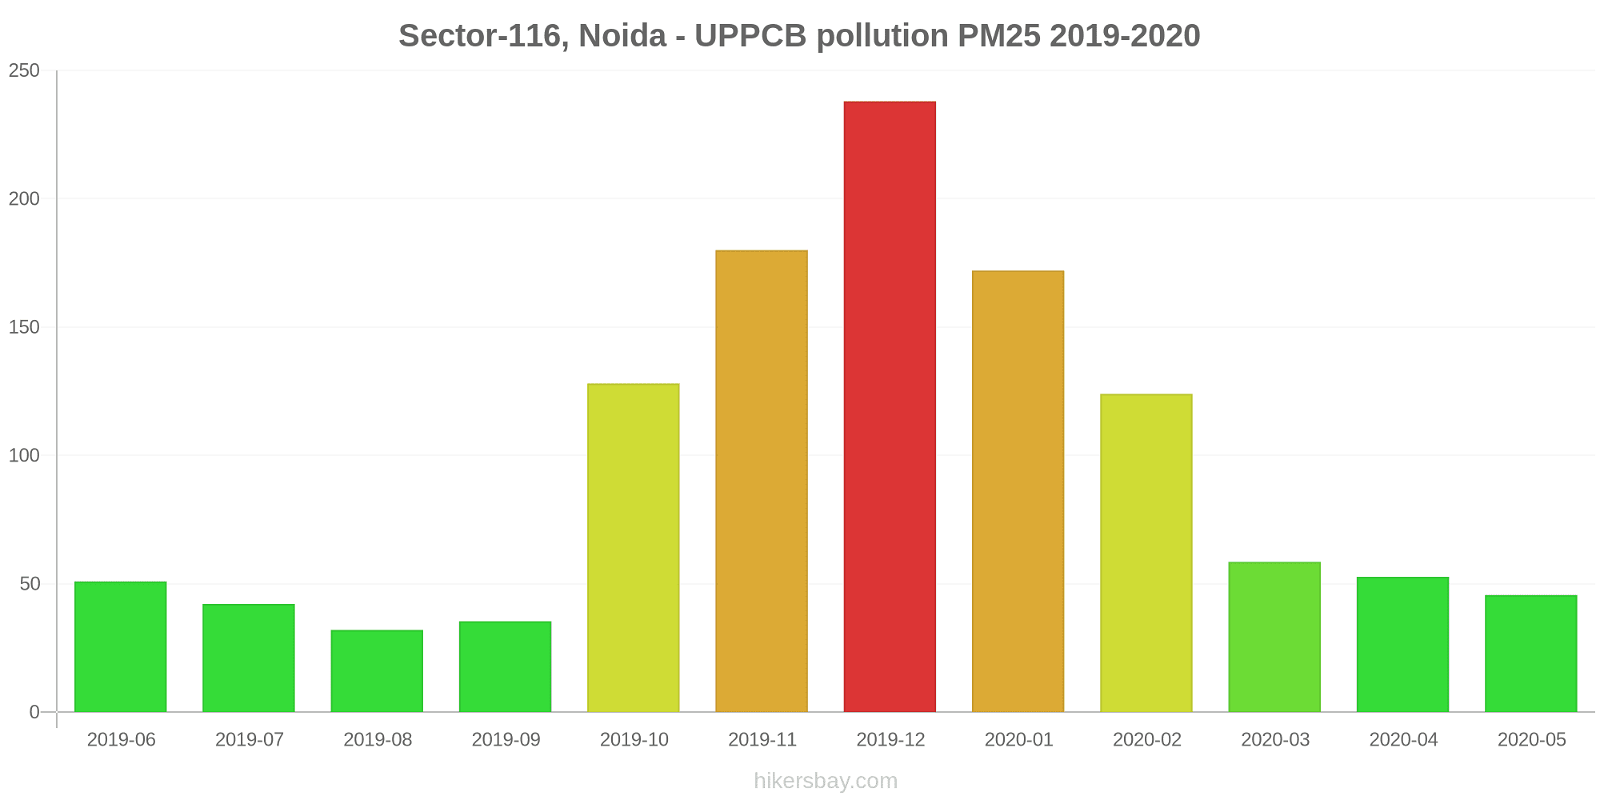
Sector-116, Noida - UPPCB
Friday, October 14, 2022, 6:00 AM
SO2 10 (Good)
sulfur dioxide (SO2)
NO2 15 (Good)
nitrogen dioxide (NO2)
PM2,5 77 (Very Unhealthy)
particulate matter (PM2.5) dust
O3 122 (Unhealthy for Sensitive Groups)
ozone (O3)
PM10 186 (Very bad Hazardous)
particulate matter (PM10) suspended dust
Sector-116, Noida - UPPCB
index
2022-10-14
2022-10-13
2022-10-12
2022-10-11
2022-10-10
2022-10-09
2022-10-08
2022-10-07
pm10
203
173
207
175
13
6.2
6.9
29
no2
29
33
38
24
8.3
8.5
9.8
9.1
pm25
96
67
91
37
5.7
6
2.8
11
so2
6.5
6.2
6.2
6.6
11
9.7
11
7.1
o3
53
40
59
30
30
26
22
-
Sector-116, Noida - UPPCB
2019-06 2020-05
index
2020-05
2020-04
2020-03
2020-02
2020-01
2019-12
2019-11
2019-10
2019-09
2019-08
2019-07
2019-06
pm25
46
53
59
124
172
238
180
128
35
32
42
51
pm10
111
115
117
202
237
318
273
241
87
81
143
317
no2
13
19
33
52
64
89
121
70
23
26
25
40
so2
8.2
10
10
13
11
5.8
13
13
7.9
5.4
8.8
13
co
1
962
674
1
2
2
2
1
813
985
940
1
o3
38
36
23
17
12
34
29
39
31
27
36
45
* Pollution data source:
https://openaq.org
(caaqm)
The data is licensed under CC-By 4.0
SO2 10 (Good)
NO2 15 (Good)
PM2,5 77 (Very Unhealthy)
O3 122 (Unhealthy for Sensitive Groups)
PM10 186 (Very bad Hazardous)
Data on air pollution from recent days in Soharkha
| index | 2022-10-07 | 2022-10-08 | 2022-10-09 | 2022-10-10 | 2022-10-11 | 2022-10-12 | 2022-10-13 | 2022-10-14 |
|---|---|---|---|---|---|---|---|---|
| pm10 | 29 Moderate |
7 Good |
6 Good |
13 Good |
175 Very bad Hazardous |
207 Very bad Hazardous |
173 Very bad Hazardous |
203 Very bad Hazardous |
| no2 | 9 Good |
10 Good |
9 Good |
8 Good |
24 Good |
38 Good |
33 Good |
29 Good |
| pm25 | 11 Good |
3 Good |
6 Good |
6 Good |
37 Unhealthy for Sensitive Groups |
91 Very Unhealthy |
67 Unhealthy |
96 Very Unhealthy |
| so2 | 7 Good |
11 Good |
10 Good |
11 Good |
7 Good |
6 Good |
6 Good |
7 Good |
| o3 | - Good |
22 Good |
26 Good |
30 Good |
30 Good |
59 Good |
40 Good |
53 Good |

| index | 2020-05 | 2020-04 | 2020-03 | 2020-02 | 2020-01 | 2019-12 | 2019-11 | 2019-10 | 2019-09 | 2019-08 | 2019-07 | 2019-06 |
|---|---|---|---|---|---|---|---|---|---|---|---|---|
| pm25 | 46 (Unhealthy for Sensitive Groups) | 53 (Unhealthy for Sensitive Groups) | 59 (Unhealthy) | 124 (Very bad Hazardous) | 172 (Very bad Hazardous) | 238 (Very bad Hazardous) | 180 (Very bad Hazardous) | 128 (Very bad Hazardous) | 35 (Unhealthy for Sensitive Groups) | 32 (Moderate) | 42 (Unhealthy for Sensitive Groups) | 51 (Unhealthy for Sensitive Groups) |
| pm10 | 111 (Very Unhealthy) | 115 (Very Unhealthy) | 117 (Very Unhealthy) | 202 (Very bad Hazardous) | 237 (Very bad Hazardous) | 318 (Very bad Hazardous) | 273 (Very bad Hazardous) | 241 (Very bad Hazardous) | 87 (Unhealthy) | 81 (Unhealthy) | 143 (Very Unhealthy) | 317 (Very bad Hazardous) |
| no2 | 13 (Good) | 19 (Good) | 33 (Good) | 52 (Moderate) | 64 (Moderate) | 89 (Moderate) | 121 (Unhealthy for Sensitive Groups) | 70 (Moderate) | 23 (Good) | 26 (Good) | 25 (Good) | 40 (Moderate) |
| so2 | 8.2 (Good) | 10 (Good) | 10 (Good) | 13 (Good) | 11 (Good) | 5.8 (Good) | 13 (Good) | 13 (Good) | 7.9 (Good) | 5.4 (Good) | 8.8 (Good) | 13 (Good) |
| co | 1 (Good) | 962 (Good) | 674 (Good) | 1 (Good) | 2 (Good) | 2 (Good) | 2 (Good) | 1 (Good) | 813 (Good) | 985 (Good) | 940 (Good) | 1 (Good) |
| o3 | 38 (Good) | 36 (Good) | 23 (Good) | 17 (Good) | 12 (Good) | 34 (Good) | 29 (Good) | 39 (Good) | 31 (Good) | 27 (Good) | 36 (Good) | 45 (Good) |
SO2 10 (Good)
sulfur dioxide (SO2)NO2 15 (Good)
nitrogen dioxide (NO2)PM2,5 77 (Very Unhealthy)
particulate matter (PM2.5) dustO3 122 (Unhealthy for Sensitive Groups)
ozone (O3)PM10 186 (Very bad Hazardous)
particulate matter (PM10) suspended dustSector-116, Noida - UPPCB
| index | 2022-10-14 | 2022-10-13 | 2022-10-12 | 2022-10-11 | 2022-10-10 | 2022-10-09 | 2022-10-08 | 2022-10-07 |
|---|---|---|---|---|---|---|---|---|
| pm10 | 203 | 173 | 207 | 175 | 13 | 6.2 | 6.9 | 29 |
| no2 | 29 | 33 | 38 | 24 | 8.3 | 8.5 | 9.8 | 9.1 |
| pm25 | 96 | 67 | 91 | 37 | 5.7 | 6 | 2.8 | 11 |
| so2 | 6.5 | 6.2 | 6.2 | 6.6 | 11 | 9.7 | 11 | 7.1 |
| o3 | 53 | 40 | 59 | 30 | 30 | 26 | 22 | - |
Sector-116, Noida - UPPCB

| index | 2020-05 | 2020-04 | 2020-03 | 2020-02 | 2020-01 | 2019-12 | 2019-11 | 2019-10 | 2019-09 | 2019-08 | 2019-07 | 2019-06 |
|---|---|---|---|---|---|---|---|---|---|---|---|---|
| pm25 | 46 | 53 | 59 | 124 | 172 | 238 | 180 | 128 | 35 | 32 | 42 | 51 |
| pm10 | 111 | 115 | 117 | 202 | 237 | 318 | 273 | 241 | 87 | 81 | 143 | 317 |
| no2 | 13 | 19 | 33 | 52 | 64 | 89 | 121 | 70 | 23 | 26 | 25 | 40 |
| so2 | 8.2 | 10 | 10 | 13 | 11 | 5.8 | 13 | 13 | 7.9 | 5.4 | 8.8 | 13 |
| co | 1 | 962 | 674 | 1 | 2 | 2 | 2 | 1 | 813 | 985 | 940 | 1 |
| o3 | 38 | 36 | 23 | 17 | 12 | 34 | 29 | 39 | 31 | 27 | 36 | 45 |