Air Pollution in Khora: Real-time Air Quality Index and smog alert.
Pollution and air quality forecast for Khora. Today is Wednesday, May 13, 2026. The following air pollution values have been recorded for Khora:- nitrogen dioxide (NO2) - 7 (Good)
- ozone (O3) - 11 (Good)
- carbon monoxide (CO) - 1900 (Good)
- particulate matter (PM10) suspended dust - 124 (Very Unhealthy)
- particulate matter (PM2.5) dust - 99 (Very Unhealthy)

What is the air quality in Khora today? Is the air polluted in Khora?. Is there smog?
How high is the level of NO2? (nitrogen dioxide (NO2))
7 (Good)
How is the O3 level today in Khora? (ozone (O3))
11 (Good)
How high is the CO level? (carbon monoxide (CO))
1900 (Good)
What is the level of PM10 today in Khora? (particulate matter (PM10) suspended dust)
The current level of particulate matter PM10 in Khora is:
124 (Very Unhealthy)
The highest PM10 values usually occur in month: 350 (December 2019).
The lowest value of particulate matter PM10 pollution in Khora is usually recorded in: August (82).
What is the current level of PM2.5 in Khora? (particulate matter (PM2.5) dust)
Today's PM2.5 level is:
99 (Very Unhealthy)
For comparison, the highest level of PM2.5 in Khora in the last 7 days was: 52 (Wednesday, October 12, 2022) and the lowest: -18 (Monday, October 10, 2022).
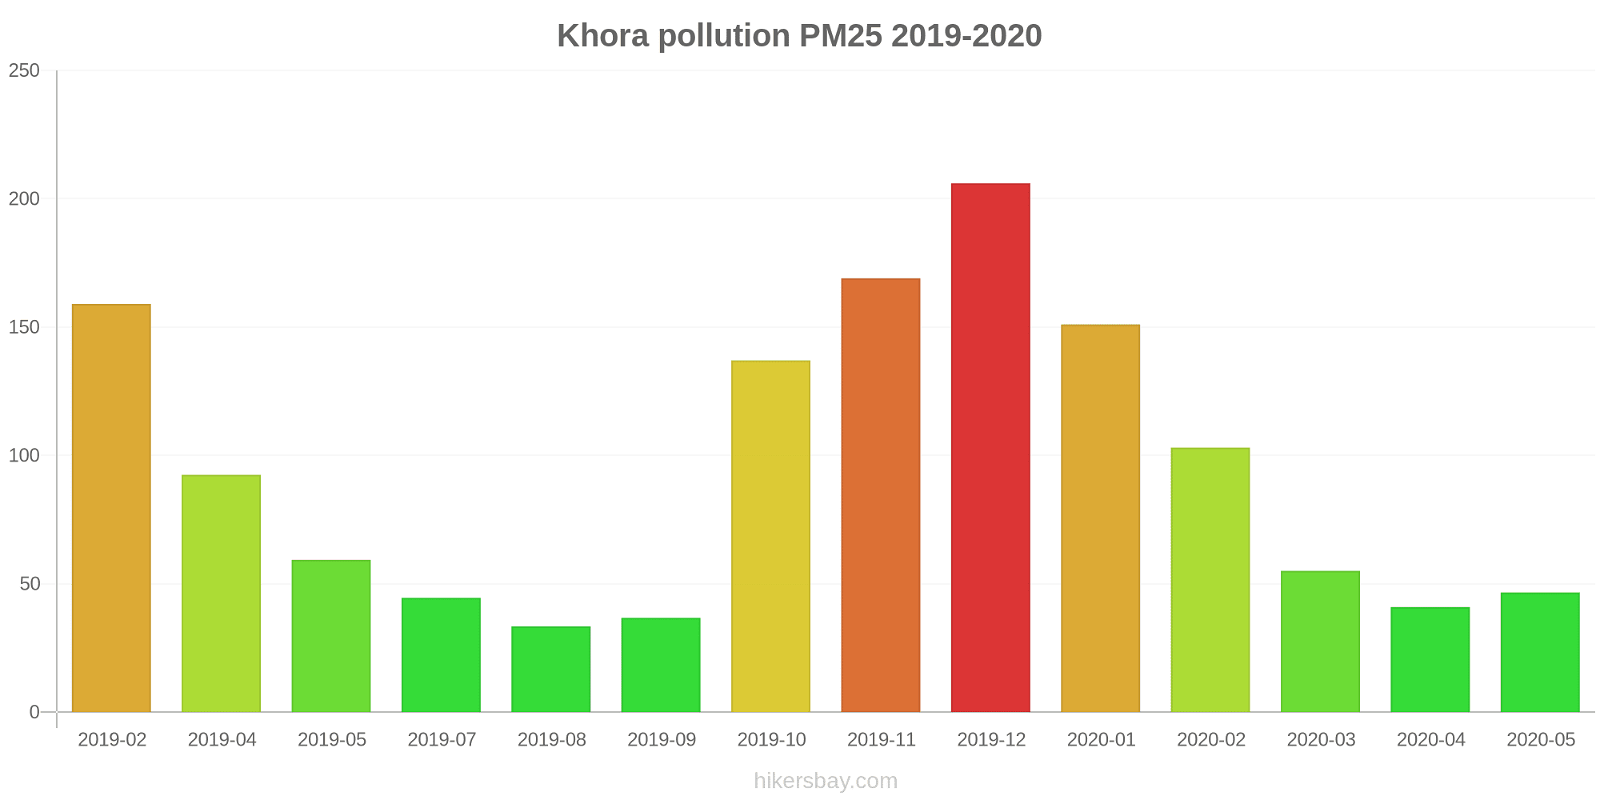
The highest PM2.5 values were recorded: 206 (December 2019).
The lowest level of particulate matter PM2.5 pollution occurs in month: August (33).
Current data Thursday, October 13, 2022, 10:15 PM
NO2 7 (Good)
O3 11 (Good)
CO 1900 (Good)
PM10 124 (Very Unhealthy)
PM2,5 99 (Very Unhealthy)
Data on air pollution from recent days in Khora
index
2022-10-07
2022-10-08
2022-10-09
2022-10-10
2022-10-11
2022-10-12
2022-10-13
pm10
19
Good
12
Good
0
Good
-86
Good
51
Unhealthy for Sensitive Groups
127
Very Unhealthy
117
Very Unhealthy
pm25
26
Moderate
12
Good
11
Good
-18
Good
22
Moderate
52
Unhealthy for Sensitive Groups
50
Unhealthy for Sensitive Groups
no2
7
Good
5
Good
8
Good
7
Good
7
Good
7
Good
7
Good
o3
23
Good
10
Good
24
Good
23
Good
30
Good
74
Moderate
12
Good
co
1785
Good
1790
Good
1702
Good
1670
Good
2024
Moderate
2173
Moderate
2030
Moderate
data source »
Air pollution in Khora from February 2019 to May 2020
index
2020-05
2020-04
2020-03
2020-02
2020-01
2019-12
2019-11
2019-10
2019-09
2019-08
2019-07
2019-05
2019-04
2019-02
pm25
47 (Unhealthy for Sensitive Groups)
41 (Unhealthy for Sensitive Groups)
55 (Unhealthy)
103 (Very Unhealthy)
151 (Very bad Hazardous)
206 (Very bad Hazardous)
169 (Very bad Hazardous)
137 (Very bad Hazardous)
37 (Unhealthy for Sensitive Groups)
33 (Moderate)
45 (Unhealthy for Sensitive Groups)
59 (Unhealthy)
92 (Very Unhealthy)
159 (Very bad Hazardous)
pm10
91 (Unhealthy)
89 (Unhealthy)
120 (Very Unhealthy)
216 (Very bad Hazardous)
243 (Very bad Hazardous)
350 (Very bad Hazardous)
300 (Very bad Hazardous)
271 (Very bad Hazardous)
114 (Very Unhealthy)
82 (Unhealthy)
139 (Very Unhealthy)
212 (Very bad Hazardous)
299 (Very bad Hazardous)
305 (Very bad Hazardous)
no2
18 (Good)
14 (Good)
14 (Good)
15 (Good)
14 (Good)
14 (Good)
10 (Good)
16 (Good)
20 (Good)
29 (Good)
34 (Good)
- (Good)
13 (Good)
18 (Good)
o3
72 (Moderate)
61 (Good)
37 (Good)
37 (Good)
31 (Good)
85 (Moderate)
40 (Good)
75 (Moderate)
31 (Good)
28 (Good)
39 (Good)
23 (Good)
28 (Good)
44 (Good)
co
- (Good)
1 (Good)
1 (Good)
1 (Good)
1 (Good)
1 (Good)
1 (Good)
4 (Good)
620 (Good)
590 (Good)
907 (Good)
920 (Good)
857 (Good)
1 (Good)
data source »
Sector - 62, Noida, UP - IMD
Thursday, October 13, 2022, 10:15 PM
NO2 6.7 (Good)
nitrogen dioxide (NO2)
O3 11 (Good)
ozone (O3)
CO 1900 (Good)
carbon monoxide (CO)
PM10 124 (Very Unhealthy)
particulate matter (PM10) suspended dust
PM2,5 99 (Very Unhealthy)
particulate matter (PM2.5) dust
Sector - 62, Noida, UP - IMD
index
2022-10-13
2022-10-12
2022-10-11
2022-10-10
2022-10-09
2022-10-08
2022-10-07
pm10
117
127
51
-86.47
0
12
19
pm25
50
52
22
-17.72
11
12
26
no2
6.9
6.8
6.6
6.6
7.7
5.4
7.4
o3
12
74
30
23
24
10
23
co
2030
2173
2024
1670
1702
1790
1785
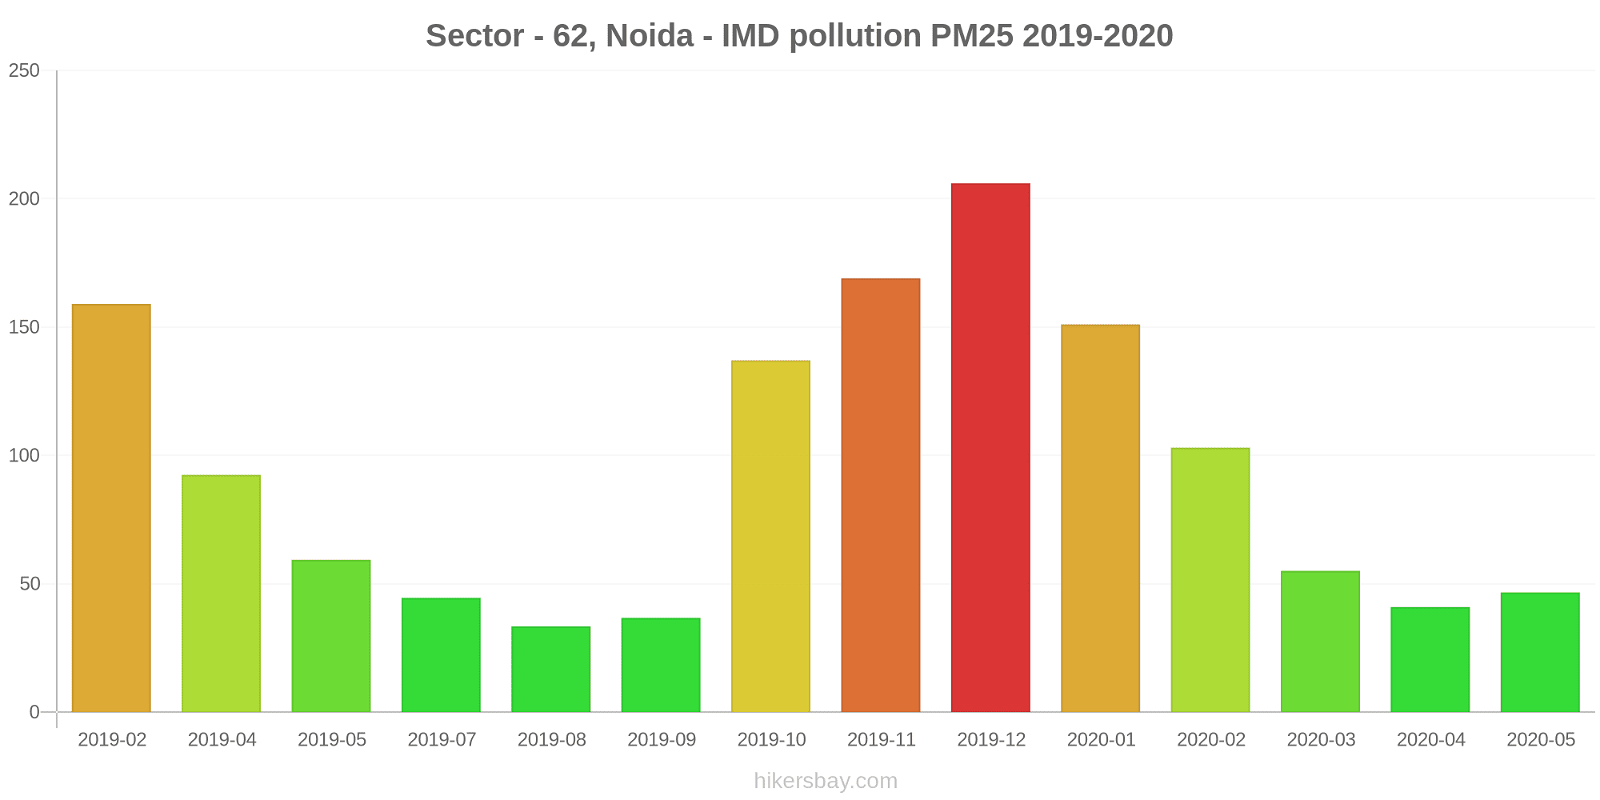
Sector - 62, Noida - IMD
2019-02 2020-05
index
2020-05
2020-04
2020-03
2020-02
2020-01
2019-12
2019-11
2019-10
2019-09
2019-08
2019-07
2019-05
2019-04
2019-02
pm25
47
41
55
103
151
206
169
137
37
33
45
59
92
159
pm10
91
89
120
216
243
350
300
271
114
82
139
212
299
305
no2
18
14
14
15
14
14
10
16
20
29
34
-
13
18
co
-
1
1
1
1
1
1
4
620
590
907
920
857
1
o3
72
61
37
37
31
85
40
75
31
28
39
23
28
44
* Pollution data source:
https://openaq.org
(caaqm)
The data is licensed under CC-By 4.0
NO2 7 (Good)
O3 11 (Good)
CO 1900 (Good)
PM10 124 (Very Unhealthy)
PM2,5 99 (Very Unhealthy)
Data on air pollution from recent days in Khora
| index | 2022-10-07 | 2022-10-08 | 2022-10-09 | 2022-10-10 | 2022-10-11 | 2022-10-12 | 2022-10-13 |
|---|---|---|---|---|---|---|---|
| pm10 | 19 Good |
12 Good |
0 Good |
-86 Good |
51 Unhealthy for Sensitive Groups |
127 Very Unhealthy |
117 Very Unhealthy |
| pm25 | 26 Moderate |
12 Good |
11 Good |
-18 Good |
22 Moderate |
52 Unhealthy for Sensitive Groups |
50 Unhealthy for Sensitive Groups |
| no2 | 7 Good |
5 Good |
8 Good |
7 Good |
7 Good |
7 Good |
7 Good |
| o3 | 23 Good |
10 Good |
24 Good |
23 Good |
30 Good |
74 Moderate |
12 Good |
| co | 1785 Good |
1790 Good |
1702 Good |
1670 Good |
2024 Moderate |
2173 Moderate |
2030 Moderate |

| index | 2020-05 | 2020-04 | 2020-03 | 2020-02 | 2020-01 | 2019-12 | 2019-11 | 2019-10 | 2019-09 | 2019-08 | 2019-07 | 2019-05 | 2019-04 | 2019-02 |
|---|---|---|---|---|---|---|---|---|---|---|---|---|---|---|
| pm25 | 47 (Unhealthy for Sensitive Groups) | 41 (Unhealthy for Sensitive Groups) | 55 (Unhealthy) | 103 (Very Unhealthy) | 151 (Very bad Hazardous) | 206 (Very bad Hazardous) | 169 (Very bad Hazardous) | 137 (Very bad Hazardous) | 37 (Unhealthy for Sensitive Groups) | 33 (Moderate) | 45 (Unhealthy for Sensitive Groups) | 59 (Unhealthy) | 92 (Very Unhealthy) | 159 (Very bad Hazardous) |
| pm10 | 91 (Unhealthy) | 89 (Unhealthy) | 120 (Very Unhealthy) | 216 (Very bad Hazardous) | 243 (Very bad Hazardous) | 350 (Very bad Hazardous) | 300 (Very bad Hazardous) | 271 (Very bad Hazardous) | 114 (Very Unhealthy) | 82 (Unhealthy) | 139 (Very Unhealthy) | 212 (Very bad Hazardous) | 299 (Very bad Hazardous) | 305 (Very bad Hazardous) |
| no2 | 18 (Good) | 14 (Good) | 14 (Good) | 15 (Good) | 14 (Good) | 14 (Good) | 10 (Good) | 16 (Good) | 20 (Good) | 29 (Good) | 34 (Good) | - (Good) | 13 (Good) | 18 (Good) |
| o3 | 72 (Moderate) | 61 (Good) | 37 (Good) | 37 (Good) | 31 (Good) | 85 (Moderate) | 40 (Good) | 75 (Moderate) | 31 (Good) | 28 (Good) | 39 (Good) | 23 (Good) | 28 (Good) | 44 (Good) |
| co | - (Good) | 1 (Good) | 1 (Good) | 1 (Good) | 1 (Good) | 1 (Good) | 1 (Good) | 4 (Good) | 620 (Good) | 590 (Good) | 907 (Good) | 920 (Good) | 857 (Good) | 1 (Good) |
NO2 6.7 (Good)
nitrogen dioxide (NO2)O3 11 (Good)
ozone (O3)CO 1900 (Good)
carbon monoxide (CO)PM10 124 (Very Unhealthy)
particulate matter (PM10) suspended dustPM2,5 99 (Very Unhealthy)
particulate matter (PM2.5) dustSector - 62, Noida, UP - IMD
| index | 2022-10-13 | 2022-10-12 | 2022-10-11 | 2022-10-10 | 2022-10-09 | 2022-10-08 | 2022-10-07 |
|---|---|---|---|---|---|---|---|
| pm10 | 117 | 127 | 51 | -86.47 | 0 | 12 | 19 |
| pm25 | 50 | 52 | 22 | -17.72 | 11 | 12 | 26 |
| no2 | 6.9 | 6.8 | 6.6 | 6.6 | 7.7 | 5.4 | 7.4 |
| o3 | 12 | 74 | 30 | 23 | 24 | 10 | 23 |
| co | 2030 | 2173 | 2024 | 1670 | 1702 | 1790 | 1785 |
Sector - 62, Noida - IMD

| index | 2020-05 | 2020-04 | 2020-03 | 2020-02 | 2020-01 | 2019-12 | 2019-11 | 2019-10 | 2019-09 | 2019-08 | 2019-07 | 2019-05 | 2019-04 | 2019-02 |
|---|---|---|---|---|---|---|---|---|---|---|---|---|---|---|
| pm25 | 47 | 41 | 55 | 103 | 151 | 206 | 169 | 137 | 37 | 33 | 45 | 59 | 92 | 159 |
| pm10 | 91 | 89 | 120 | 216 | 243 | 350 | 300 | 271 | 114 | 82 | 139 | 212 | 299 | 305 |
| no2 | 18 | 14 | 14 | 15 | 14 | 14 | 10 | 16 | 20 | 29 | 34 | - | 13 | 18 |
| co | - | 1 | 1 | 1 | 1 | 1 | 1 | 4 | 620 | 590 | 907 | 920 | 857 | 1 |
| o3 | 72 | 61 | 37 | 37 | 31 | 85 | 40 | 75 | 31 | 28 | 39 | 23 | 28 | 44 |