Air Pollution in Rāipur Khadar: Real-time Air Quality Index and smog alert.
Pollution and air quality forecast for Rāipur Khadar. Today is Friday, May 15, 2026. The following air pollution values have been recorded for Rāipur Khadar:- particulate matter (PM10) suspended dust - 355 (Very bad Hazardous)
- sulfur dioxide (SO2) - 23 (Good)
- particulate matter (PM2.5) dust - 78 (Very Unhealthy)
- ozone (O3) - 35 (Good)
- nitrogen dioxide (NO2) - 102 (Unhealthy for Sensitive Groups)
- carbon monoxide (CO) - 890 (Good)

What is the air quality in Rāipur Khadar today? Is the air polluted in Rāipur Khadar?. Is there smog?
What is the level of PM10 today in Rāipur Khadar? (particulate matter (PM10) suspended dust)
The current level of particulate matter PM10 in Rāipur Khadar is:
355 (Very bad Hazardous)
The highest PM10 values usually occur in month: 342 (February 2019).
The lowest value of particulate matter PM10 pollution in Rāipur Khadar is usually recorded in: August (84).
What is the level of SO2 pollution? (sulfur dioxide (SO2))
23 (Good)
What is the current level of PM2.5 in Rāipur Khadar? (particulate matter (PM2.5) dust)
Today's PM2.5 level is:
78 (Very Unhealthy)
For comparison, the highest level of PM2.5 in Rāipur Khadar in the last 7 days was: 80 (Monday, October 31, 2022) and the lowest: 80 (Monday, October 31, 2022).
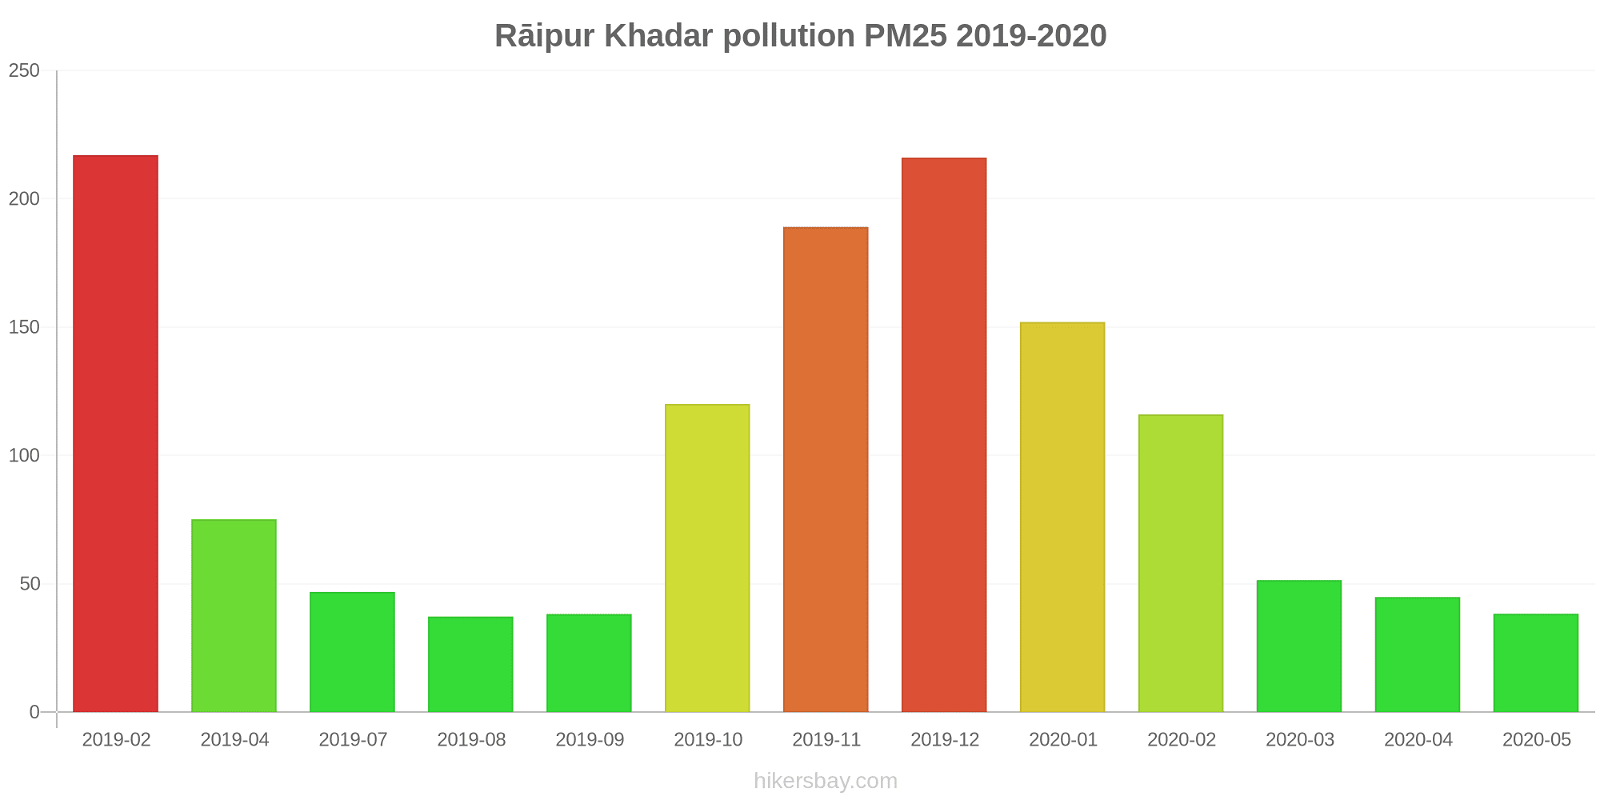
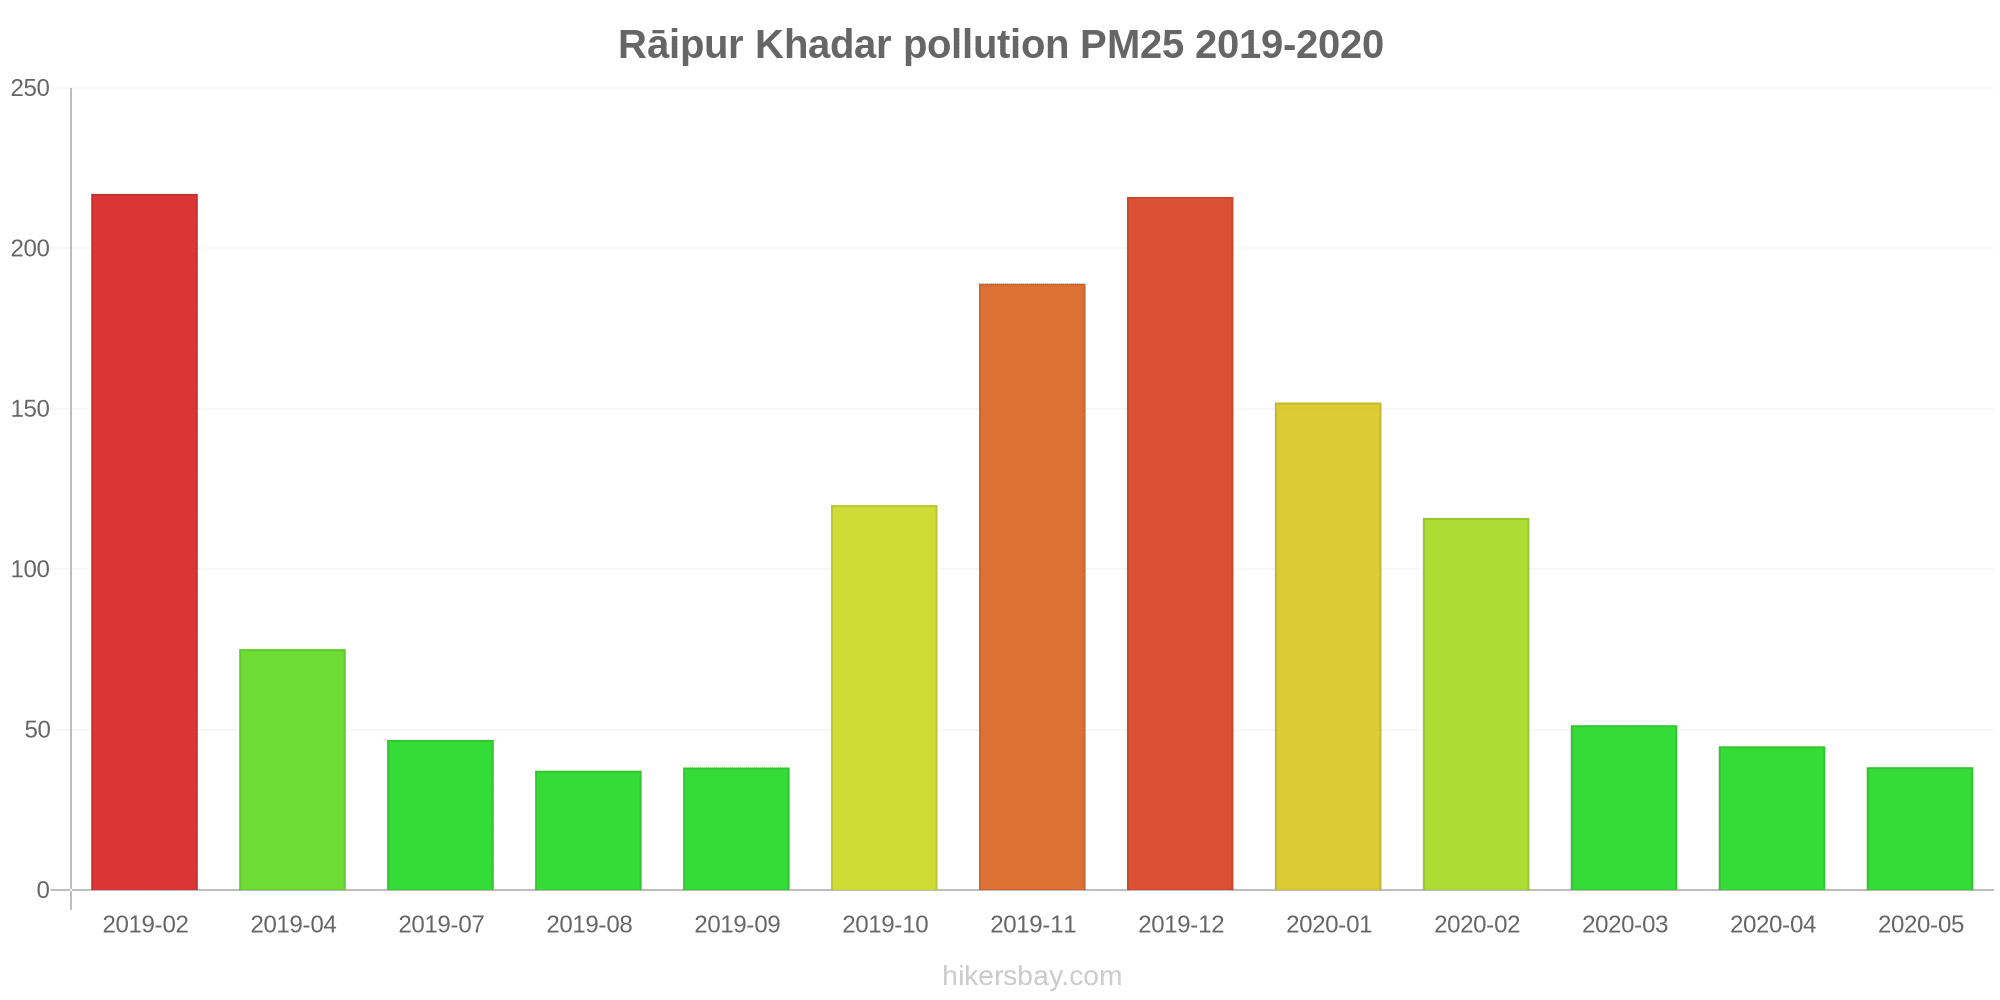
The highest PM2.5 values were recorded: 217 (February 2019).
The lowest level of particulate matter PM2.5 pollution occurs in month: August (37).
How is the O3 level today in Rāipur Khadar? (ozone (O3))
35 (Good)
How high is the level of NO2? (nitrogen dioxide (NO2))
102 (Unhealthy for Sensitive Groups)
How high is the CO level? (carbon monoxide (CO))
890 (Good)
Current data Monday, October 31, 2022, 2:00 AM
PM10 355 (Very bad Hazardous)
SO2 23 (Good)
PM2,5 78 (Very Unhealthy)
O3 35 (Good)
NO2 102 (Unhealthy for Sensitive Groups)
CO 890 (Good)
Data on air pollution from recent days in Rāipur Khadar
index
2022-10-31
pm10
374
Very bad Hazardous
so2
22
Good
pm25
80
Very Unhealthy
o3
35
Good
no2
95
Moderate
co
895
Good
data source »
Air pollution in Rāipur Khadar from February 2019 to May 2020
index
2020-05
2020-04
2020-03
2020-02
2020-01
2019-12
2019-11
2019-10
2019-09
2019-08
2019-07
2019-04
2019-02
pm25
38 (Unhealthy for Sensitive Groups)
45 (Unhealthy for Sensitive Groups)
51 (Unhealthy for Sensitive Groups)
116 (Very bad Hazardous)
152 (Very bad Hazardous)
216 (Very bad Hazardous)
189 (Very bad Hazardous)
120 (Very bad Hazardous)
38 (Unhealthy for Sensitive Groups)
37 (Unhealthy for Sensitive Groups)
47 (Unhealthy for Sensitive Groups)
75 (Very Unhealthy)
217 (Very bad Hazardous)
pm10
100 (Unhealthy)
121 (Very Unhealthy)
122 (Very Unhealthy)
219 (Very bad Hazardous)
240 (Very bad Hazardous)
333 (Very bad Hazardous)
320 (Very bad Hazardous)
256 (Very bad Hazardous)
103 (Unhealthy)
84 (Unhealthy)
139 (Very Unhealthy)
299 (Very bad Hazardous)
342 (Very bad Hazardous)
no2
11 (Good)
13 (Good)
32 (Good)
61 (Moderate)
47 (Moderate)
54 (Moderate)
83 (Moderate)
98 (Moderate)
19 (Good)
28 (Good)
26 (Good)
64 (Moderate)
77 (Moderate)
so2
12 (Good)
14 (Good)
12 (Good)
24 (Good)
32 (Good)
26 (Good)
21 (Good)
28 (Good)
23 (Good)
35 (Good)
18 (Good)
41 (Good)
20 (Good)
co
504 (Good)
532 (Good)
805 (Good)
1 (Good)
1 (Good)
2 (Good)
2 (Good)
1 (Good)
906 (Good)
886 (Good)
795 (Good)
330 (Good)
1 (Good)
o3
5.9 (Good)
21 (Good)
27 (Good)
39 (Good)
11 (Good)
1.1 (Good)
3.1 (Good)
30 (Good)
27 (Good)
26 (Good)
24 (Good)
4.1 (Good)
3.8 (Good)
data source »
Sector - 125, Noida, UP - UPPCB
Monday, October 31, 2022, 2:00 AM
PM10 355 (Very bad Hazardous)
particulate matter (PM10) suspended dust
SO2 23 (Good)
sulfur dioxide (SO2)
PM2,5 78 (Very Unhealthy)
particulate matter (PM2.5) dust
O3 35 (Good)
ozone (O3)
NO2 102 (Unhealthy for Sensitive Groups)
nitrogen dioxide (NO2)
CO 890 (Good)
carbon monoxide (CO)
Sector - 125, Noida, UP - UPPCB
index
2022-10-31
pm10
374
so2
22
pm25
80
o3
35
no2
95
co
895
Sector - 125, Noida - UPPCB
2019-02 2020-05

index
2020-05
2020-04
2020-03
2020-02
2020-01
2019-12
2019-11
2019-10
2019-09
2019-08
2019-07
2019-04
2019-02
pm25
38
45
51
116
152
216
189
120
38
37
47
75
217
pm10
100
121
122
219
240
333
320
256
103
84
139
299
342
no2
11
13
32
61
47
54
83
98
19
28
26
64
77
so2
12
14
12
24
32
26
21
28
23
35
18
41
20
co
504
532
805
1
1
2
2
1
906
886
795
330
1
o3
5.9
21
27
39
11
1.1
3.1
30
27
26
24
4.1
3.8
* Pollution data source:
https://openaq.org
(caaqm)
The data is licensed under CC-By 4.0
PM10 355 (Very bad Hazardous)
SO2 23 (Good)
PM2,5 78 (Very Unhealthy)
O3 35 (Good)
NO2 102 (Unhealthy for Sensitive Groups)
CO 890 (Good)
Data on air pollution from recent days in Rāipur Khadar
| index | 2022-10-31 |
|---|---|
| pm10 | 374 Very bad Hazardous |
| so2 | 22 Good |
| pm25 | 80 Very Unhealthy |
| o3 | 35 Good |
| no2 | 95 Moderate |
| co | 895 Good |
| index | 2020-05 | 2020-04 | 2020-03 | 2020-02 | 2020-01 | 2019-12 | 2019-11 | 2019-10 | 2019-09 | 2019-08 | 2019-07 | 2019-04 | 2019-02 |
|---|---|---|---|---|---|---|---|---|---|---|---|---|---|
| pm25 | 38 (Unhealthy for Sensitive Groups) | 45 (Unhealthy for Sensitive Groups) | 51 (Unhealthy for Sensitive Groups) | 116 (Very bad Hazardous) | 152 (Very bad Hazardous) | 216 (Very bad Hazardous) | 189 (Very bad Hazardous) | 120 (Very bad Hazardous) | 38 (Unhealthy for Sensitive Groups) | 37 (Unhealthy for Sensitive Groups) | 47 (Unhealthy for Sensitive Groups) | 75 (Very Unhealthy) | 217 (Very bad Hazardous) |
| pm10 | 100 (Unhealthy) | 121 (Very Unhealthy) | 122 (Very Unhealthy) | 219 (Very bad Hazardous) | 240 (Very bad Hazardous) | 333 (Very bad Hazardous) | 320 (Very bad Hazardous) | 256 (Very bad Hazardous) | 103 (Unhealthy) | 84 (Unhealthy) | 139 (Very Unhealthy) | 299 (Very bad Hazardous) | 342 (Very bad Hazardous) |
| no2 | 11 (Good) | 13 (Good) | 32 (Good) | 61 (Moderate) | 47 (Moderate) | 54 (Moderate) | 83 (Moderate) | 98 (Moderate) | 19 (Good) | 28 (Good) | 26 (Good) | 64 (Moderate) | 77 (Moderate) |
| so2 | 12 (Good) | 14 (Good) | 12 (Good) | 24 (Good) | 32 (Good) | 26 (Good) | 21 (Good) | 28 (Good) | 23 (Good) | 35 (Good) | 18 (Good) | 41 (Good) | 20 (Good) |
| co | 504 (Good) | 532 (Good) | 805 (Good) | 1 (Good) | 1 (Good) | 2 (Good) | 2 (Good) | 1 (Good) | 906 (Good) | 886 (Good) | 795 (Good) | 330 (Good) | 1 (Good) |
| o3 | 5.9 (Good) | 21 (Good) | 27 (Good) | 39 (Good) | 11 (Good) | 1.1 (Good) | 3.1 (Good) | 30 (Good) | 27 (Good) | 26 (Good) | 24 (Good) | 4.1 (Good) | 3.8 (Good) |
PM10 355 (Very bad Hazardous)
particulate matter (PM10) suspended dustSO2 23 (Good)
sulfur dioxide (SO2)PM2,5 78 (Very Unhealthy)
particulate matter (PM2.5) dustO3 35 (Good)
ozone (O3)NO2 102 (Unhealthy for Sensitive Groups)
nitrogen dioxide (NO2)CO 890 (Good)
carbon monoxide (CO)Sector - 125, Noida, UP - UPPCB
| index | 2022-10-31 |
|---|---|
| pm10 | 374 |
| so2 | 22 |
| pm25 | 80 |
| o3 | 35 |
| no2 | 95 |
| co | 895 |
Sector - 125, Noida - UPPCB

| index | 2020-05 | 2020-04 | 2020-03 | 2020-02 | 2020-01 | 2019-12 | 2019-11 | 2019-10 | 2019-09 | 2019-08 | 2019-07 | 2019-04 | 2019-02 |
|---|---|---|---|---|---|---|---|---|---|---|---|---|---|
| pm25 | 38 | 45 | 51 | 116 | 152 | 216 | 189 | 120 | 38 | 37 | 47 | 75 | 217 |
| pm10 | 100 | 121 | 122 | 219 | 240 | 333 | 320 | 256 | 103 | 84 | 139 | 299 | 342 |
| no2 | 11 | 13 | 32 | 61 | 47 | 54 | 83 | 98 | 19 | 28 | 26 | 64 | 77 |
| so2 | 12 | 14 | 12 | 24 | 32 | 26 | 21 | 28 | 23 | 35 | 18 | 41 | 20 |
| co | 504 | 532 | 805 | 1 | 1 | 2 | 2 | 1 | 906 | 886 | 795 | 330 | 1 |
| o3 | 5.9 | 21 | 27 | 39 | 11 | 1.1 | 3.1 | 30 | 27 | 26 | 24 | 4.1 | 3.8 |