Air Pollution in Īshwaenagar: Real-time Air Quality Index and smog alert.
Pollution and air quality forecast for Īshwaenagar. Today is Thursday, May 14, 2026. The following air pollution values have been recorded for Īshwaenagar:- particulate matter (PM10) suspended dust - 346 (Very bad Hazardous)
- nitrogen dioxide (NO2) - 4 (Good)
- carbon monoxide (CO) - 960 (Good)
- ozone (O3) - 28 (Good)
- particulate matter (PM2.5) dust - 225 (Very bad Hazardous)

What is the air quality in Īshwaenagar today? Is the air polluted in Īshwaenagar?. Is there smog?
What is the level of PM10 today in Īshwaenagar? (particulate matter (PM10) suspended dust)
The current level of particulate matter PM10 in Īshwaenagar is:
346 (Very bad Hazardous)
The highest PM10 values usually occur in month: 470 (December 2018).
The lowest value of particulate matter PM10 pollution in Īshwaenagar is usually recorded in: August (74).
How high is the level of NO2? (nitrogen dioxide (NO2))
4 (Good)
How high is the CO level? (carbon monoxide (CO))
960 (Good)
How is the O3 level today in Īshwaenagar? (ozone (O3))
28 (Good)
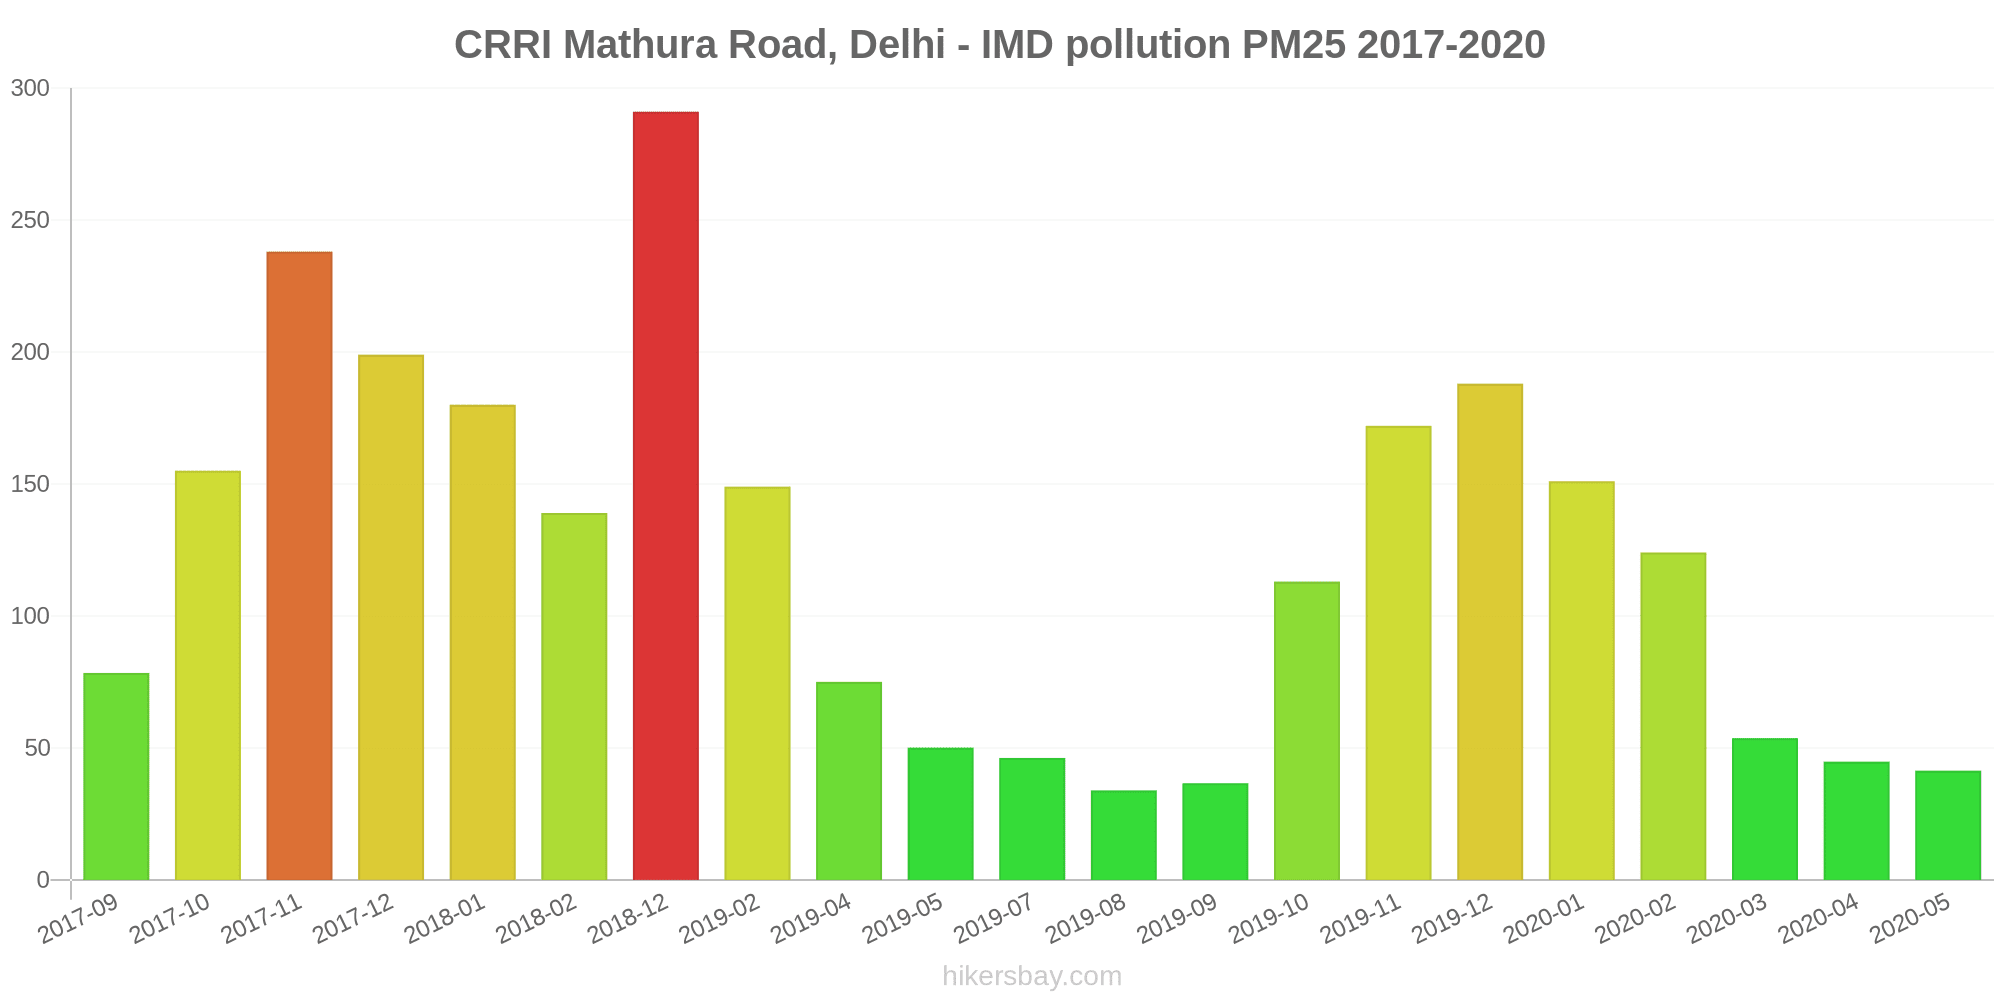
What is the current level of PM2.5 in Īshwaenagar? (particulate matter (PM2.5) dust)
Today's PM2.5 level is:
225 (Very bad Hazardous)
For comparison, the highest level of PM2.5 in Īshwaenagar in the last 7 days was: 225 (Monday, October 31, 2022) and the lowest: 225 (Monday, October 31, 2022).
The highest PM2.5 values were recorded: 291 (December 2018).
The lowest level of particulate matter PM2.5 pollution occurs in month: August (34).
Current data Monday, October 31, 2022, 1:15 AM
PM10 346 (Very bad Hazardous)
NO2 4 (Good)
CO 960 (Good)
O3 28 (Good)
PM2,5 225 (Very bad Hazardous)
Data on air pollution from recent days in Īshwaenagar
index
2022-10-31
pm10
346
Very bad Hazardous
no2
4
Good
co
960
Good
o3
28
Good
pm25
225
Very bad Hazardous
data source »
Air pollution in Īshwaenagar from September 2017 to May 2020

index
2020-05
2020-04
2020-03
2020-02
2020-01
2019-12
2019-11
2019-10
2019-09
2019-08
2019-07
2019-05
2019-04
2019-02
2018-12
2018-02
2018-01
2017-12
2017-11
2017-10
2017-09
pm25
41 (Unhealthy for Sensitive Groups)
45 (Unhealthy for Sensitive Groups)
54 (Unhealthy for Sensitive Groups)
124 (Very bad Hazardous)
151 (Very bad Hazardous)
188 (Very bad Hazardous)
172 (Very bad Hazardous)
113 (Very bad Hazardous)
37 (Unhealthy for Sensitive Groups)
34 (Moderate)
46 (Unhealthy for Sensitive Groups)
50 (Unhealthy for Sensitive Groups)
75 (Very Unhealthy)
149 (Very bad Hazardous)
291 (Very bad Hazardous)
139 (Very bad Hazardous)
180 (Very bad Hazardous)
199 (Very bad Hazardous)
238 (Very bad Hazardous)
155 (Very bad Hazardous)
78 (Very Unhealthy)
pm10
93 (Unhealthy)
108 (Unhealthy)
128 (Very Unhealthy)
249 (Very bad Hazardous)
267 (Very bad Hazardous)
312 (Very bad Hazardous)
295 (Very bad Hazardous)
236 (Very bad Hazardous)
80 (Unhealthy for Sensitive Groups)
74 (Unhealthy for Sensitive Groups)
125 (Very Unhealthy)
204 (Very bad Hazardous)
277 (Very bad Hazardous)
217 (Very bad Hazardous)
470 (Very bad Hazardous)
258 (Very bad Hazardous)
341 (Very bad Hazardous)
339 (Very bad Hazardous)
354 (Very bad Hazardous)
271 (Very bad Hazardous)
146 (Very Unhealthy)
no2
11 (Good)
17 (Good)
29 (Good)
75 (Moderate)
79 (Moderate)
87 (Moderate)
128 (Unhealthy for Sensitive Groups)
135 (Unhealthy for Sensitive Groups)
33 (Good)
31 (Good)
19 (Good)
22 (Good)
26 (Good)
16 (Good)
52 (Moderate)
32 (Good)
31 (Good)
31 (Good)
33 (Good)
32 (Good)
32 (Good)
co
371 (Good)
435 (Good)
656 (Good)
1 (Good)
1 (Good)
1 (Good)
1 (Good)
1 (Good)
979 (Good)
1 (Good)
1 (Good)
1 (Good)
2 (Good)
1 (Good)
3 (Good)
1 (Good)
1 (Good)
1 (Good)
1 (Good)
- (Good)
- (Good)
o3
14 (Good)
16 (Good)
17 (Good)
16 (Good)
13 (Good)
9.9 (Good)
14 (Good)
42 (Good)
27 (Good)
40 (Good)
56 (Good)
44 (Good)
31 (Good)
33 (Good)
41 (Good)
- (Good)
- (Good)
- (Good)
- (Good)
- (Good)
- (Good)
data source »
CRRI Mathura Road, New Delhi - IMD
Monday, October 31, 2022, 1:15 AM
PM10 346 (Very bad Hazardous)
particulate matter (PM10) suspended dust
NO2 3.5 (Good)
nitrogen dioxide (NO2)
CO 960 (Good)
carbon monoxide (CO)
O3 28 (Good)
ozone (O3)
PM2,5 225 (Very bad Hazardous)
particulate matter (PM2.5) dust
CRRI Mathura Road, New Delhi - IMD
index
2022-10-31
pm10
346
no2
3.5
co
960
o3
28
pm25
225
CRRI Mathura Road, Delhi - IMD
2017-09 2020-05

index
2020-05
2020-04
2020-03
2020-02
2020-01
2019-12
2019-11
2019-10
2019-09
2019-08
2019-07
2019-05
2019-04
2019-02
2018-12
2018-02
2018-01
2017-12
2017-11
2017-10
2017-09
no2
11
17
29
75
79
87
128
135
33
31
19
22
26
16
52
32
31
31
33
32
32
pm25
41
45
54
124
151
188
172
113
37
34
46
50
75
149
291
139
180
199
238
155
78
pm10
93
108
128
249
267
312
295
236
80
74
125
204
277
217
470
258
341
339
354
271
146
co
371
435
656
1
1
1
1
1
979
1
1
1
2
1
3
1
1
1
1
-
-
o3
14
16
17
16
13
9.9
14
42
27
40
56
44
31
33
41
-
-
-
-
-
-
* Pollution data source:
https://openaq.org
(caaqm)
The data is licensed under CC-By 4.0
PM10 346 (Very bad Hazardous)
NO2 4 (Good)
CO 960 (Good)
O3 28 (Good)
PM2,5 225 (Very bad Hazardous)
Data on air pollution from recent days in Īshwaenagar
| index | 2022-10-31 |
|---|---|
| pm10 | 346 Very bad Hazardous |
| no2 | 4 Good |
| co | 960 Good |
| o3 | 28 Good |
| pm25 | 225 Very bad Hazardous |

| index | 2020-05 | 2020-04 | 2020-03 | 2020-02 | 2020-01 | 2019-12 | 2019-11 | 2019-10 | 2019-09 | 2019-08 | 2019-07 | 2019-05 | 2019-04 | 2019-02 | 2018-12 | 2018-02 | 2018-01 | 2017-12 | 2017-11 | 2017-10 | 2017-09 |
|---|---|---|---|---|---|---|---|---|---|---|---|---|---|---|---|---|---|---|---|---|---|
| pm25 | 41 (Unhealthy for Sensitive Groups) | 45 (Unhealthy for Sensitive Groups) | 54 (Unhealthy for Sensitive Groups) | 124 (Very bad Hazardous) | 151 (Very bad Hazardous) | 188 (Very bad Hazardous) | 172 (Very bad Hazardous) | 113 (Very bad Hazardous) | 37 (Unhealthy for Sensitive Groups) | 34 (Moderate) | 46 (Unhealthy for Sensitive Groups) | 50 (Unhealthy for Sensitive Groups) | 75 (Very Unhealthy) | 149 (Very bad Hazardous) | 291 (Very bad Hazardous) | 139 (Very bad Hazardous) | 180 (Very bad Hazardous) | 199 (Very bad Hazardous) | 238 (Very bad Hazardous) | 155 (Very bad Hazardous) | 78 (Very Unhealthy) |
| pm10 | 93 (Unhealthy) | 108 (Unhealthy) | 128 (Very Unhealthy) | 249 (Very bad Hazardous) | 267 (Very bad Hazardous) | 312 (Very bad Hazardous) | 295 (Very bad Hazardous) | 236 (Very bad Hazardous) | 80 (Unhealthy for Sensitive Groups) | 74 (Unhealthy for Sensitive Groups) | 125 (Very Unhealthy) | 204 (Very bad Hazardous) | 277 (Very bad Hazardous) | 217 (Very bad Hazardous) | 470 (Very bad Hazardous) | 258 (Very bad Hazardous) | 341 (Very bad Hazardous) | 339 (Very bad Hazardous) | 354 (Very bad Hazardous) | 271 (Very bad Hazardous) | 146 (Very Unhealthy) |
| no2 | 11 (Good) | 17 (Good) | 29 (Good) | 75 (Moderate) | 79 (Moderate) | 87 (Moderate) | 128 (Unhealthy for Sensitive Groups) | 135 (Unhealthy for Sensitive Groups) | 33 (Good) | 31 (Good) | 19 (Good) | 22 (Good) | 26 (Good) | 16 (Good) | 52 (Moderate) | 32 (Good) | 31 (Good) | 31 (Good) | 33 (Good) | 32 (Good) | 32 (Good) |
| co | 371 (Good) | 435 (Good) | 656 (Good) | 1 (Good) | 1 (Good) | 1 (Good) | 1 (Good) | 1 (Good) | 979 (Good) | 1 (Good) | 1 (Good) | 1 (Good) | 2 (Good) | 1 (Good) | 3 (Good) | 1 (Good) | 1 (Good) | 1 (Good) | 1 (Good) | - (Good) | - (Good) |
| o3 | 14 (Good) | 16 (Good) | 17 (Good) | 16 (Good) | 13 (Good) | 9.9 (Good) | 14 (Good) | 42 (Good) | 27 (Good) | 40 (Good) | 56 (Good) | 44 (Good) | 31 (Good) | 33 (Good) | 41 (Good) | - (Good) | - (Good) | - (Good) | - (Good) | - (Good) | - (Good) |
PM10 346 (Very bad Hazardous)
particulate matter (PM10) suspended dustNO2 3.5 (Good)
nitrogen dioxide (NO2)CO 960 (Good)
carbon monoxide (CO)O3 28 (Good)
ozone (O3)PM2,5 225 (Very bad Hazardous)
particulate matter (PM2.5) dustCRRI Mathura Road, New Delhi - IMD
| index | 2022-10-31 |
|---|---|
| pm10 | 346 |
| no2 | 3.5 |
| co | 960 |
| o3 | 28 |
| pm25 | 225 |
CRRI Mathura Road, Delhi - IMD
| index | 2020-05 | 2020-04 | 2020-03 | 2020-02 | 2020-01 | 2019-12 | 2019-11 | 2019-10 | 2019-09 | 2019-08 | 2019-07 | 2019-05 | 2019-04 | 2019-02 | 2018-12 | 2018-02 | 2018-01 | 2017-12 | 2017-11 | 2017-10 | 2017-09 |
|---|---|---|---|---|---|---|---|---|---|---|---|---|---|---|---|---|---|---|---|---|---|
| no2 | 11 | 17 | 29 | 75 | 79 | 87 | 128 | 135 | 33 | 31 | 19 | 22 | 26 | 16 | 52 | 32 | 31 | 31 | 33 | 32 | 32 |
| pm25 | 41 | 45 | 54 | 124 | 151 | 188 | 172 | 113 | 37 | 34 | 46 | 50 | 75 | 149 | 291 | 139 | 180 | 199 | 238 | 155 | 78 |
| pm10 | 93 | 108 | 128 | 249 | 267 | 312 | 295 | 236 | 80 | 74 | 125 | 204 | 277 | 217 | 470 | 258 | 341 | 339 | 354 | 271 | 146 |
| co | 371 | 435 | 656 | 1 | 1 | 1 | 1 | 1 | 979 | 1 | 1 | 1 | 2 | 1 | 3 | 1 | 1 | 1 | 1 | - | - |
| o3 | 14 | 16 | 17 | 16 | 13 | 9.9 | 14 | 42 | 27 | 40 | 56 | 44 | 31 | 33 | 41 | - | - | - | - | - | - |