Air Pollution in Chilla Soroda Bāngar: Real-time Air Quality Index and smog alert.
Pollution and air quality forecast for Chilla Soroda Bāngar. Today is Wednesday, May 13, 2026. The following air pollution values have been recorded for Chilla Soroda Bāngar:- particulate matter (PM2.5) dust - 54 (Unhealthy for Sensitive Groups)
- nitrogen dioxide (NO2) - 29 (Good)
- ozone (O3) - 124 (Unhealthy for Sensitive Groups)
- sulfur dioxide (SO2) - 30 (Good)
- particulate matter (PM10) suspended dust - 186 (Very bad Hazardous)
- carbon monoxide (CO) - 8970 (Unhealthy for Sensitive Groups)

What is the air quality in Chilla Soroda Bāngar today? Is the air polluted in Chilla Soroda Bāngar?. Is there smog?
What is the current level of PM2.5 in Chilla Soroda Bāngar? (particulate matter (PM2.5) dust)
Today's PM2.5 level is:
54 (Unhealthy for Sensitive Groups)
For comparison, the highest level of PM2.5 in Chilla Soroda Bāngar in the last 7 days was: 69 (Friday, October 14, 2022) and the lowest: 5 (Sunday, October 9, 2022).
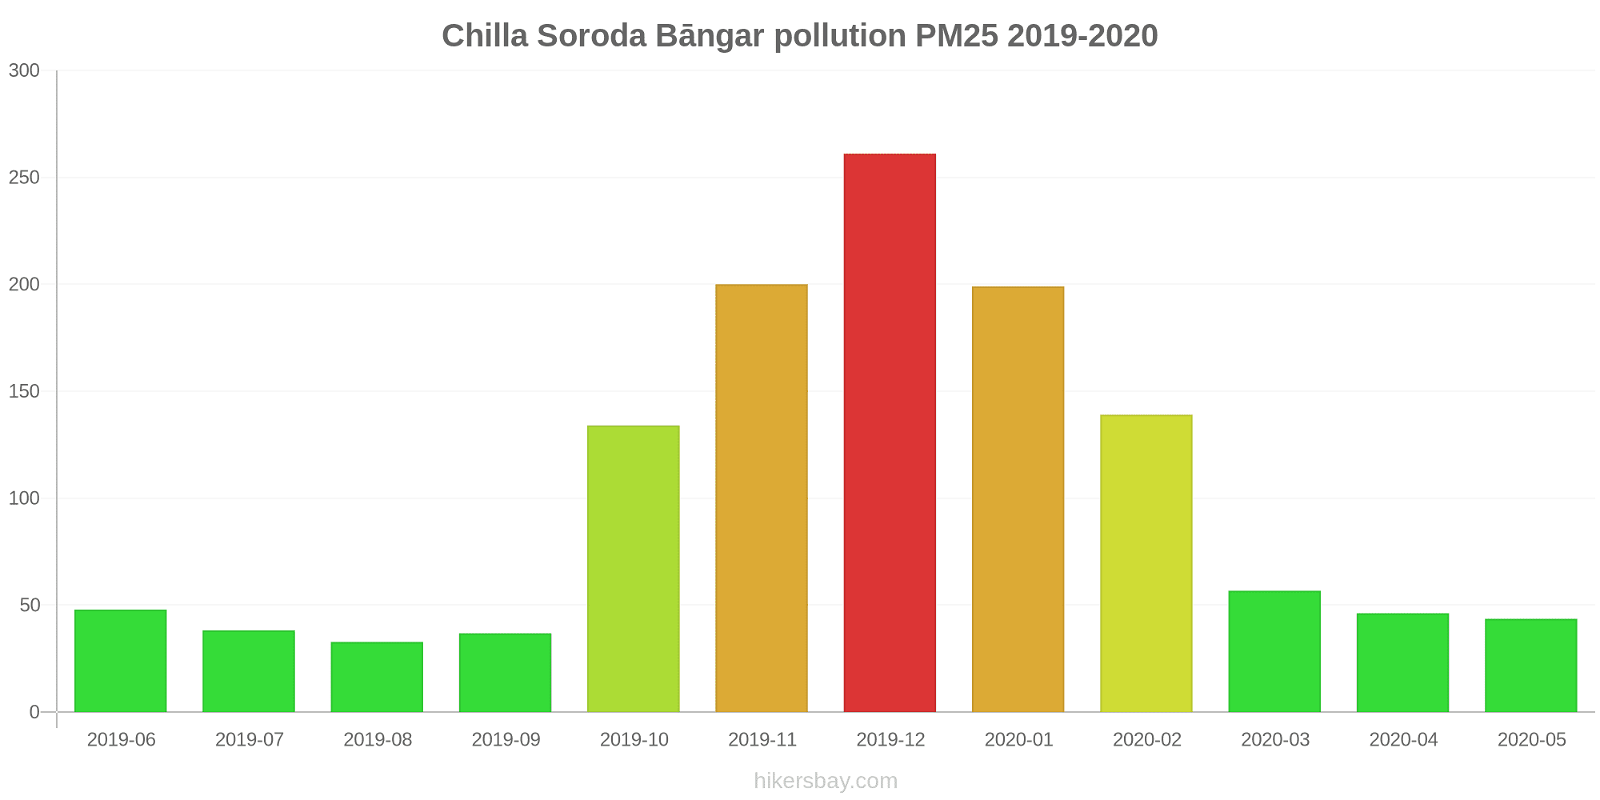
The highest PM2.5 values were recorded: 261 (December 2019).
The lowest level of particulate matter PM2.5 pollution occurs in month: August (33).
How high is the level of NO2? (nitrogen dioxide (NO2))
29 (Good)
How is the O3 level today in Chilla Soroda Bāngar? (ozone (O3))
124 (Unhealthy for Sensitive Groups)
What is the level of SO2 pollution? (sulfur dioxide (SO2))
30 (Good)
What is the level of PM10 today in Chilla Soroda Bāngar? (particulate matter (PM10) suspended dust)
The current level of particulate matter PM10 in Chilla Soroda Bāngar is:
186 (Very bad Hazardous)
The highest PM10 values usually occur in month: 344 (December 2019).
The lowest value of particulate matter PM10 pollution in Chilla Soroda Bāngar is usually recorded in: August (83).
How high is the CO level? (carbon monoxide (CO))
8970 (Unhealthy for Sensitive Groups)
Current data Friday, October 14, 2022, 6:00 AM
PM2,5 54 (Unhealthy for Sensitive Groups)
NO2 29 (Good)
O3 124 (Unhealthy for Sensitive Groups)
SO2 30 (Good)
PM10 186 (Very bad Hazardous)
CO 8970 (Unhealthy for Sensitive Groups)
Data on air pollution from recent days in Chilla Soroda Bāngar
index
2022-10-07
2022-10-08
2022-10-09
2022-10-10
2022-10-11
2022-10-12
2022-10-13
2022-10-14
so2
24
Good
38
Good
21
Good
28
Good
20
Good
19
Good
57
Moderate
26
Good
pm25
11
Good
8
Good
5
Good
7
Good
27
Moderate
59
Unhealthy
48
Unhealthy for Sensitive Groups
69
Unhealthy
pm10
34
Moderate
19
Good
13
Good
21
Moderate
82
Unhealthy
164
Very bad Hazardous
183
Very bad Hazardous
201
Very bad Hazardous
o3
19
Good
16
Good
16
Good
18
Good
48
Good
61
Good
38
Good
49
Good
no2
15
Good
17
Good
14
Good
14
Good
30
Good
34
Good
34
Good
31
Good
co
-
Good
-
Good
-
Good
-
Good
-
Good
6190
Unhealthy for Sensitive Groups
8800
Unhealthy for Sensitive Groups
-
Good
data source »
Air pollution in Chilla Soroda Bāngar from June 2019 to May 2020
index
2020-05
2020-04
2020-03
2020-02
2020-01
2019-12
2019-11
2019-10
2019-09
2019-08
2019-07
2019-06
pm25
44 (Unhealthy for Sensitive Groups)
46 (Unhealthy for Sensitive Groups)
57 (Unhealthy)
139 (Very bad Hazardous)
199 (Very bad Hazardous)
261 (Very bad Hazardous)
200 (Very bad Hazardous)
134 (Very bad Hazardous)
37 (Unhealthy for Sensitive Groups)
33 (Moderate)
38 (Unhealthy for Sensitive Groups)
48 (Unhealthy for Sensitive Groups)
pm10
113 (Very Unhealthy)
123 (Very Unhealthy)
127 (Very Unhealthy)
223 (Very bad Hazardous)
264 (Very bad Hazardous)
344 (Very bad Hazardous)
289 (Very bad Hazardous)
237 (Very bad Hazardous)
84 (Unhealthy)
83 (Unhealthy)
153 (Very bad Hazardous)
318 (Very bad Hazardous)
no2
13 (Good)
17 (Good)
45 (Moderate)
72 (Moderate)
74 (Moderate)
87 (Moderate)
97 (Moderate)
78 (Moderate)
31 (Good)
33 (Good)
36 (Good)
47 (Moderate)
so2
14 (Good)
15 (Good)
13 (Good)
14 (Good)
11 (Good)
9.2 (Good)
13 (Good)
13 (Good)
12 (Good)
7.7 (Good)
6.4 (Good)
6.6 (Good)
o3
75 (Moderate)
67 (Good)
50 (Good)
55 (Good)
29 (Good)
24 (Good)
40 (Good)
54 (Good)
54 (Good)
43 (Good)
53 (Good)
77 (Moderate)
co
1 (Good)
2 (Good)
2 (Good)
2 (Good)
1 (Good)
1 (Good)
2 (Good)
1 (Good)
781 (Good)
789 (Good)
638 (Good)
815 (Good)
data source »
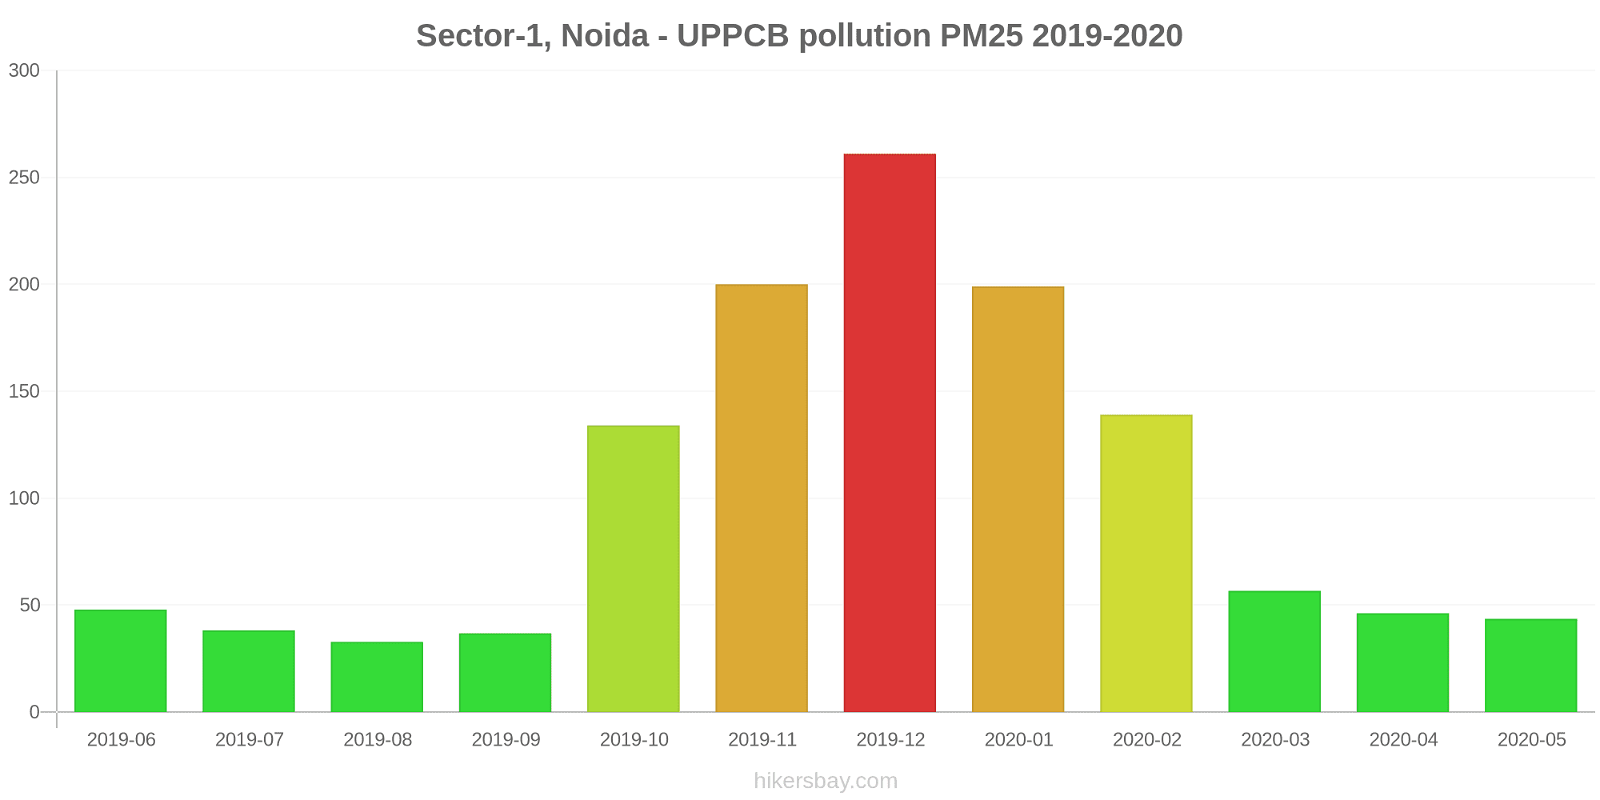
Sector-1, Noida - UPPCB
Friday, October 14, 2022, 6:00 AM
PM2,5 54 (Unhealthy for Sensitive Groups)
particulate matter (PM2.5) dust
NO2 29 (Good)
nitrogen dioxide (NO2)
O3 124 (Unhealthy for Sensitive Groups)
ozone (O3)
SO2 30 (Good)
sulfur dioxide (SO2)
PM10 186 (Very bad Hazardous)
particulate matter (PM10) suspended dust
CO 8970 (Unhealthy for Sensitive Groups)
carbon monoxide (CO)
Sector-1, Noida - UPPCB
index
2022-10-14
2022-10-13
2022-10-12
2022-10-11
2022-10-10
2022-10-09
2022-10-08
2022-10-07
so2
26
57
19
20
28
21
38
24
pm25
69
48
59
27
6.9
5.4
8.2
11
pm10
201
183
164
82
21
13
19
34
o3
49
38
61
48
18
16
16
19
no2
31
34
34
30
14
14
17
15
co
-
8800
6190
-
-
-
-
-
Sector-1, Noida - UPPCB
2019-06 2020-05
index
2020-05
2020-04
2020-03
2020-02
2020-01
2019-12
2019-11
2019-10
2019-09
2019-08
2019-07
2019-06
pm25
44
46
57
139
199
261
200
134
37
33
38
48
pm10
113
123
127
223
264
344
289
237
84
83
153
318
no2
13
17
45
72
74
87
97
78
31
33
36
47
so2
14
15
13
14
11
9.2
13
13
12
7.7
6.4
6.6
o3
75
67
50
55
29
24
40
54
54
43
53
77
co
1
2
2
2
1
1
2
1
781
789
638
815
* Pollution data source:
https://openaq.org
(caaqm)
The data is licensed under CC-By 4.0
PM2,5 54 (Unhealthy for Sensitive Groups)
NO2 29 (Good)
O3 124 (Unhealthy for Sensitive Groups)
SO2 30 (Good)
PM10 186 (Very bad Hazardous)
CO 8970 (Unhealthy for Sensitive Groups)
Data on air pollution from recent days in Chilla Soroda Bāngar
| index | 2022-10-07 | 2022-10-08 | 2022-10-09 | 2022-10-10 | 2022-10-11 | 2022-10-12 | 2022-10-13 | 2022-10-14 |
|---|---|---|---|---|---|---|---|---|
| so2 | 24 Good |
38 Good |
21 Good |
28 Good |
20 Good |
19 Good |
57 Moderate |
26 Good |
| pm25 | 11 Good |
8 Good |
5 Good |
7 Good |
27 Moderate |
59 Unhealthy |
48 Unhealthy for Sensitive Groups |
69 Unhealthy |
| pm10 | 34 Moderate |
19 Good |
13 Good |
21 Moderate |
82 Unhealthy |
164 Very bad Hazardous |
183 Very bad Hazardous |
201 Very bad Hazardous |
| o3 | 19 Good |
16 Good |
16 Good |
18 Good |
48 Good |
61 Good |
38 Good |
49 Good |
| no2 | 15 Good |
17 Good |
14 Good |
14 Good |
30 Good |
34 Good |
34 Good |
31 Good |
| co | - Good |
- Good |
- Good |
- Good |
- Good |
6190 Unhealthy for Sensitive Groups |
8800 Unhealthy for Sensitive Groups |
- Good |

| index | 2020-05 | 2020-04 | 2020-03 | 2020-02 | 2020-01 | 2019-12 | 2019-11 | 2019-10 | 2019-09 | 2019-08 | 2019-07 | 2019-06 |
|---|---|---|---|---|---|---|---|---|---|---|---|---|
| pm25 | 44 (Unhealthy for Sensitive Groups) | 46 (Unhealthy for Sensitive Groups) | 57 (Unhealthy) | 139 (Very bad Hazardous) | 199 (Very bad Hazardous) | 261 (Very bad Hazardous) | 200 (Very bad Hazardous) | 134 (Very bad Hazardous) | 37 (Unhealthy for Sensitive Groups) | 33 (Moderate) | 38 (Unhealthy for Sensitive Groups) | 48 (Unhealthy for Sensitive Groups) |
| pm10 | 113 (Very Unhealthy) | 123 (Very Unhealthy) | 127 (Very Unhealthy) | 223 (Very bad Hazardous) | 264 (Very bad Hazardous) | 344 (Very bad Hazardous) | 289 (Very bad Hazardous) | 237 (Very bad Hazardous) | 84 (Unhealthy) | 83 (Unhealthy) | 153 (Very bad Hazardous) | 318 (Very bad Hazardous) |
| no2 | 13 (Good) | 17 (Good) | 45 (Moderate) | 72 (Moderate) | 74 (Moderate) | 87 (Moderate) | 97 (Moderate) | 78 (Moderate) | 31 (Good) | 33 (Good) | 36 (Good) | 47 (Moderate) |
| so2 | 14 (Good) | 15 (Good) | 13 (Good) | 14 (Good) | 11 (Good) | 9.2 (Good) | 13 (Good) | 13 (Good) | 12 (Good) | 7.7 (Good) | 6.4 (Good) | 6.6 (Good) |
| o3 | 75 (Moderate) | 67 (Good) | 50 (Good) | 55 (Good) | 29 (Good) | 24 (Good) | 40 (Good) | 54 (Good) | 54 (Good) | 43 (Good) | 53 (Good) | 77 (Moderate) |
| co | 1 (Good) | 2 (Good) | 2 (Good) | 2 (Good) | 1 (Good) | 1 (Good) | 2 (Good) | 1 (Good) | 781 (Good) | 789 (Good) | 638 (Good) | 815 (Good) |
PM2,5 54 (Unhealthy for Sensitive Groups)
particulate matter (PM2.5) dustNO2 29 (Good)
nitrogen dioxide (NO2)O3 124 (Unhealthy for Sensitive Groups)
ozone (O3)SO2 30 (Good)
sulfur dioxide (SO2)PM10 186 (Very bad Hazardous)
particulate matter (PM10) suspended dustCO 8970 (Unhealthy for Sensitive Groups)
carbon monoxide (CO)Sector-1, Noida - UPPCB
| index | 2022-10-14 | 2022-10-13 | 2022-10-12 | 2022-10-11 | 2022-10-10 | 2022-10-09 | 2022-10-08 | 2022-10-07 |
|---|---|---|---|---|---|---|---|---|
| so2 | 26 | 57 | 19 | 20 | 28 | 21 | 38 | 24 |
| pm25 | 69 | 48 | 59 | 27 | 6.9 | 5.4 | 8.2 | 11 |
| pm10 | 201 | 183 | 164 | 82 | 21 | 13 | 19 | 34 |
| o3 | 49 | 38 | 61 | 48 | 18 | 16 | 16 | 19 |
| no2 | 31 | 34 | 34 | 30 | 14 | 14 | 17 | 15 |
| co | - | 8800 | 6190 | - | - | - | - | - |
Sector-1, Noida - UPPCB

| index | 2020-05 | 2020-04 | 2020-03 | 2020-02 | 2020-01 | 2019-12 | 2019-11 | 2019-10 | 2019-09 | 2019-08 | 2019-07 | 2019-06 |
|---|---|---|---|---|---|---|---|---|---|---|---|---|
| pm25 | 44 | 46 | 57 | 139 | 199 | 261 | 200 | 134 | 37 | 33 | 38 | 48 |
| pm10 | 113 | 123 | 127 | 223 | 264 | 344 | 289 | 237 | 84 | 83 | 153 | 318 |
| no2 | 13 | 17 | 45 | 72 | 74 | 87 | 97 | 78 | 31 | 33 | 36 | 47 |
| so2 | 14 | 15 | 13 | 14 | 11 | 9.2 | 13 | 13 | 12 | 7.7 | 6.4 | 6.6 |
| o3 | 75 | 67 | 50 | 55 | 29 | 24 | 40 | 54 | 54 | 43 | 53 | 77 |
| co | 1 | 2 | 2 | 2 | 1 | 1 | 2 | 1 | 781 | 789 | 638 | 815 |