Air Pollution in Pāndavnagar: Real-time Air Quality Index and smog alert.
Pollution and air quality forecast for Pāndavnagar. Today is Wednesday, May 13, 2026. The following air pollution values have been recorded for Pāndavnagar:- particulate matter (PM2.5) dust - 256 (Very bad Hazardous)
- particulate matter (PM10) suspended dust - 354 (Very bad Hazardous)
- ozone (O3) - 1 (Good)
- nitrogen dioxide (NO2) - 90 (Moderate)
- sulfur dioxide (SO2) - 4 (Good)

What is the air quality in Pāndavnagar today? Is the air polluted in Pāndavnagar?. Is there smog?
What is the current level of PM2.5 in Pāndavnagar? (particulate matter (PM2.5) dust)
Today's PM2.5 level is:
256 (Very bad Hazardous)
For comparison, the highest level of PM2.5 in Pāndavnagar in the last 7 days was: 256 (Monday, October 31, 2022) and the lowest: 256 (Monday, October 31, 2022).
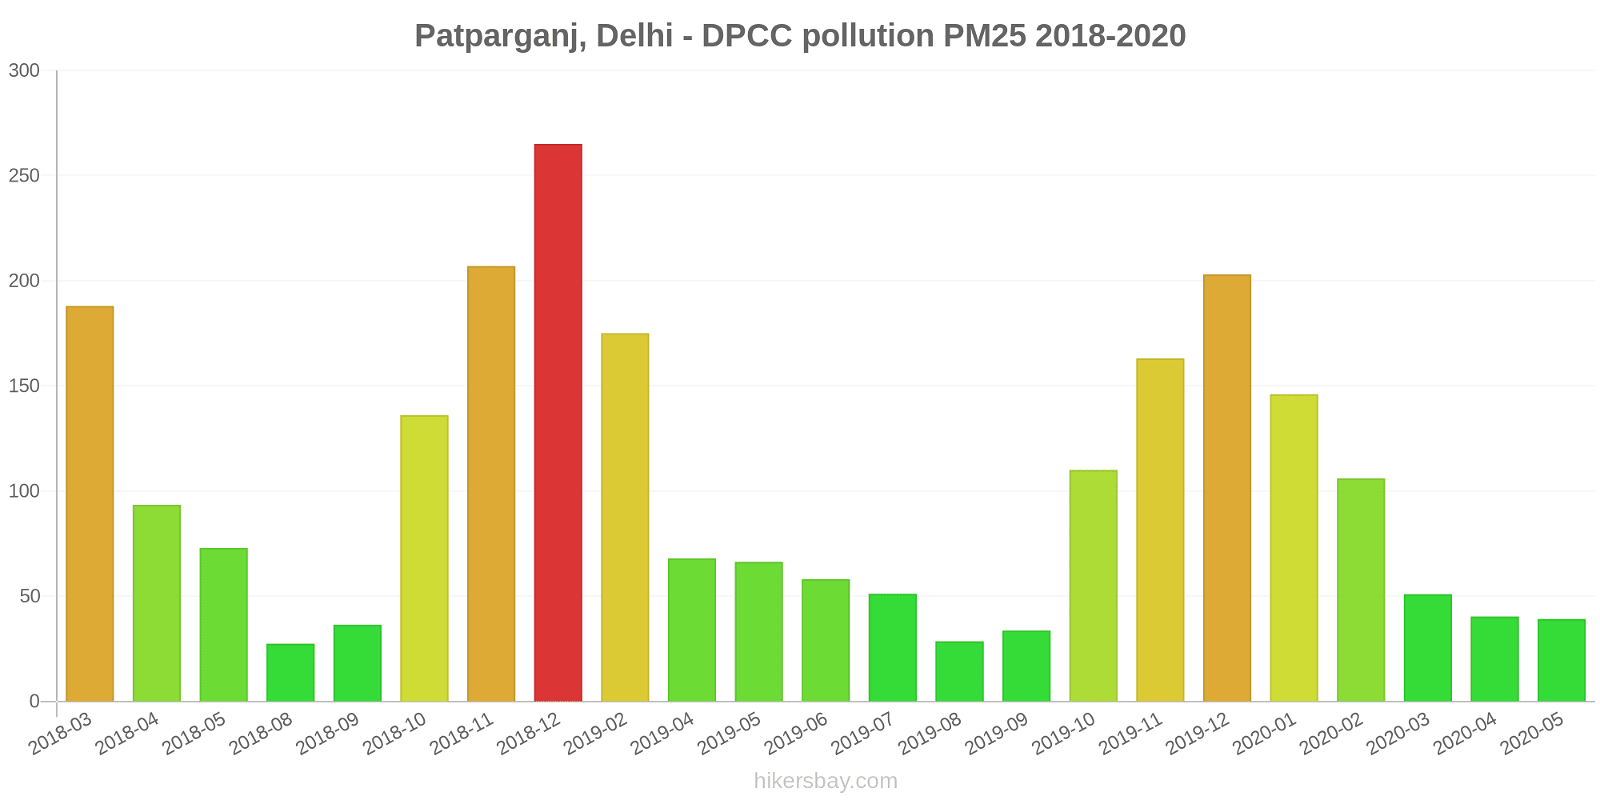
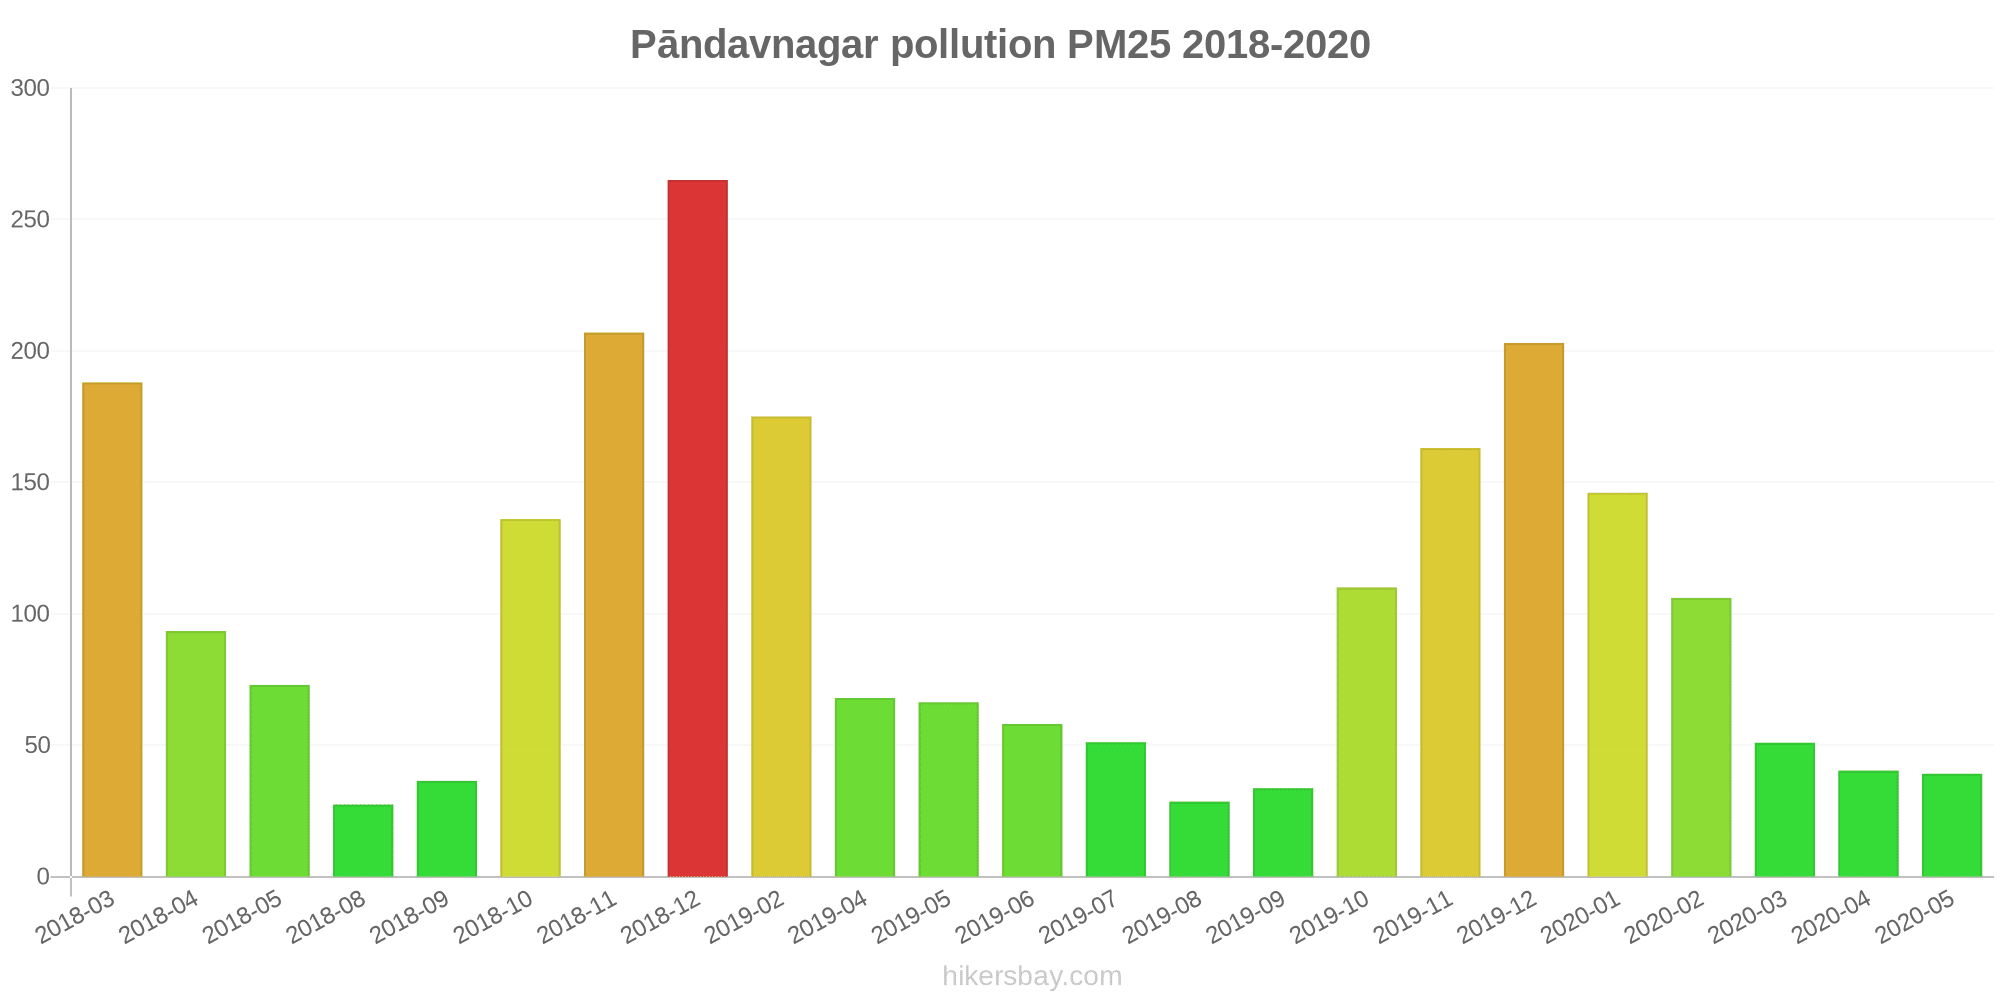
The highest PM2.5 values were recorded: 265 (December 2018).
The lowest level of particulate matter PM2.5 pollution occurs in month: August (27).
What is the level of PM10 today in Pāndavnagar? (particulate matter (PM10) suspended dust)
The current level of particulate matter PM10 in Pāndavnagar is:
354 (Very bad Hazardous)
The highest PM10 values usually occur in month: 380 (December 2018).
The lowest value of particulate matter PM10 pollution in Pāndavnagar is usually recorded in: August (60).
How is the O3 level today in Pāndavnagar? (ozone (O3))
1 (Good)
How high is the level of NO2? (nitrogen dioxide (NO2))
90 (Moderate)
What is the level of SO2 pollution? (sulfur dioxide (SO2))
4 (Good)
Current data Monday, October 31, 2022, 12:45 AM
PM2,5 256 (Very bad Hazardous)
PM10 354 (Very bad Hazardous)
O3 1 (Good)
NO2 90 (Moderate)
SO2 4 (Good)
Data on air pollution from recent days in Pāndavnagar
index
2022-10-31
pm25
256
Very bad Hazardous
pm10
354
Very bad Hazardous
o3
1
Good
no2
90
Moderate
so2
4
Good
data source »
Air pollution in Pāndavnagar from March 2018 to May 2020

index
2020-05
2020-04
2020-03
2020-02
2020-01
2019-12
2019-11
2019-10
2019-09
2019-08
2019-07
2019-06
2019-05
2019-04
2019-02
2018-12
2018-11
2018-10
2018-09
2018-08
2018-05
2018-04
2018-03
pm25
39 (Unhealthy for Sensitive Groups)
40 (Unhealthy for Sensitive Groups)
51 (Unhealthy for Sensitive Groups)
106 (Very Unhealthy)
146 (Very bad Hazardous)
203 (Very bad Hazardous)
163 (Very bad Hazardous)
110 (Very bad Hazardous)
34 (Moderate)
29 (Moderate)
51 (Unhealthy for Sensitive Groups)
58 (Unhealthy)
66 (Unhealthy)
68 (Unhealthy)
175 (Very bad Hazardous)
265 (Very bad Hazardous)
207 (Very bad Hazardous)
136 (Very bad Hazardous)
36 (Unhealthy for Sensitive Groups)
27 (Moderate)
73 (Unhealthy)
93 (Very Unhealthy)
188 (Very bad Hazardous)
pm10
95 (Unhealthy)
84 (Unhealthy)
112 (Very Unhealthy)
184 (Very bad Hazardous)
229 (Very bad Hazardous)
291 (Very bad Hazardous)
272 (Very bad Hazardous)
202 (Very bad Hazardous)
86 (Unhealthy)
60 (Unhealthy for Sensitive Groups)
114 (Very Unhealthy)
187 (Very bad Hazardous)
242 (Very bad Hazardous)
284 (Very bad Hazardous)
274 (Very bad Hazardous)
380 (Very bad Hazardous)
302 (Very bad Hazardous)
274 (Very bad Hazardous)
107 (Unhealthy)
91 (Unhealthy)
187 (Very bad Hazardous)
193 (Very bad Hazardous)
135 (Very Unhealthy)
no2
3.9 (Good)
13 (Good)
14 (Good)
24 (Good)
21 (Good)
24 (Good)
29 (Good)
18 (Good)
11 (Good)
9.5 (Good)
10 (Good)
17 (Good)
23 (Good)
27 (Good)
29 (Good)
26 (Good)
27 (Good)
28 (Good)
12 (Good)
11 (Good)
15 (Good)
27 (Good)
54 (Moderate)
o3
33 (Good)
26 (Good)
18 (Good)
15 (Good)
9.1 (Good)
9.7 (Good)
14 (Good)
18 (Good)
20 (Good)
18 (Good)
25 (Good)
34 (Good)
38 (Good)
27 (Good)
36 (Good)
10 (Good)
18 (Good)
29 (Good)
22 (Good)
20 (Good)
131 (Unhealthy for Sensitive Groups)
71 (Moderate)
52 (Good)
so2
7.1 (Good)
6.9 (Good)
6.7 (Good)
5.6 (Good)
3.3 (Good)
1.6 (Good)
3.6 (Good)
3.9 (Good)
2.5 (Good)
2.2 (Good)
2.6 (Good)
4.5 (Good)
9.4 (Good)
8.6 (Good)
5.9 (Good)
3.9 (Good)
3.6 (Good)
4.2 (Good)
1.5 (Good)
2.3 (Good)
4.5 (Good)
8.9 (Good)
9.5 (Good)
co
- (Good)
- (Good)
- (Good)
- (Good)
- (Good)
- (Good)
- (Good)
- (Good)
- (Good)
- (Good)
- (Good)
- (Good)
- (Good)
- (Good)
- (Good)
- (Good)
- (Good)
- (Good)
- (Good)
- (Good)
- (Good)
37 (Good)
44 (Good)
data source »
Patparganj, Delhi - DPCC
Monday, October 31, 2022, 12:45 AM
PM2,5 256 (Very bad Hazardous)
particulate matter (PM2.5) dust
PM10 354 (Very bad Hazardous)
particulate matter (PM10) suspended dust
O3 1.4 (Good)
ozone (O3)
NO2 90 (Moderate)
nitrogen dioxide (NO2)
SO2 3.6 (Good)
sulfur dioxide (SO2)
Patparganj, Delhi - DPCC
index
2022-10-31
pm25
256
pm10
354
o3
1.4
no2
90
so2
3.6
Patparganj, Delhi - DPCC
2018-03 2020-05
index
2020-05
2020-04
2020-03
2020-02
2020-01
2019-12
2019-11
2019-10
2019-09
2019-08
2019-07
2019-06
2019-05
2019-04
2019-02
2018-12
2018-11
2018-10
2018-09
2018-08
2018-05
2018-04
2018-03
pm25
39
40
51
106
146
203
163
110
34
29
51
58
66
68
175
265
207
136
36
27
73
93
188
pm10
95
84
112
184
229
291
272
202
86
60
114
187
242
284
274
380
302
274
107
91
187
193
135
no2
3.9
13
14
24
21
24
29
18
11
9.5
10
17
23
27
29
26
27
28
12
11
15
27
54
so2
7.1
6.9
6.7
5.6
3.3
1.6
3.6
3.9
2.5
2.2
2.6
4.5
9.4
8.6
5.9
3.9
3.6
4.2
1.5
2.3
4.5
8.9
9.5
co
-
-
-
-
-
-
-
-
-
-
-
-
-
-
-
-
-
-
-
-
-
37
44
o3
33
26
18
15
9.1
9.7
14
18
20
18
25
34
38
27
36
10
18
29
22
20
131
71
52
* Pollution data source:
https://openaq.org
(caaqm)
The data is licensed under CC-By 4.0
PM2,5 256 (Very bad Hazardous)
PM10 354 (Very bad Hazardous)
O3 1 (Good)
NO2 90 (Moderate)
SO2 4 (Good)
Data on air pollution from recent days in Pāndavnagar
| index | 2022-10-31 |
|---|---|
| pm25 | 256 Very bad Hazardous |
| pm10 | 354 Very bad Hazardous |
| o3 | 1 Good |
| no2 | 90 Moderate |
| so2 | 4 Good |
| index | 2020-05 | 2020-04 | 2020-03 | 2020-02 | 2020-01 | 2019-12 | 2019-11 | 2019-10 | 2019-09 | 2019-08 | 2019-07 | 2019-06 | 2019-05 | 2019-04 | 2019-02 | 2018-12 | 2018-11 | 2018-10 | 2018-09 | 2018-08 | 2018-05 | 2018-04 | 2018-03 |
|---|---|---|---|---|---|---|---|---|---|---|---|---|---|---|---|---|---|---|---|---|---|---|---|
| pm25 | 39 (Unhealthy for Sensitive Groups) | 40 (Unhealthy for Sensitive Groups) | 51 (Unhealthy for Sensitive Groups) | 106 (Very Unhealthy) | 146 (Very bad Hazardous) | 203 (Very bad Hazardous) | 163 (Very bad Hazardous) | 110 (Very bad Hazardous) | 34 (Moderate) | 29 (Moderate) | 51 (Unhealthy for Sensitive Groups) | 58 (Unhealthy) | 66 (Unhealthy) | 68 (Unhealthy) | 175 (Very bad Hazardous) | 265 (Very bad Hazardous) | 207 (Very bad Hazardous) | 136 (Very bad Hazardous) | 36 (Unhealthy for Sensitive Groups) | 27 (Moderate) | 73 (Unhealthy) | 93 (Very Unhealthy) | 188 (Very bad Hazardous) |
| pm10 | 95 (Unhealthy) | 84 (Unhealthy) | 112 (Very Unhealthy) | 184 (Very bad Hazardous) | 229 (Very bad Hazardous) | 291 (Very bad Hazardous) | 272 (Very bad Hazardous) | 202 (Very bad Hazardous) | 86 (Unhealthy) | 60 (Unhealthy for Sensitive Groups) | 114 (Very Unhealthy) | 187 (Very bad Hazardous) | 242 (Very bad Hazardous) | 284 (Very bad Hazardous) | 274 (Very bad Hazardous) | 380 (Very bad Hazardous) | 302 (Very bad Hazardous) | 274 (Very bad Hazardous) | 107 (Unhealthy) | 91 (Unhealthy) | 187 (Very bad Hazardous) | 193 (Very bad Hazardous) | 135 (Very Unhealthy) |
| no2 | 3.9 (Good) | 13 (Good) | 14 (Good) | 24 (Good) | 21 (Good) | 24 (Good) | 29 (Good) | 18 (Good) | 11 (Good) | 9.5 (Good) | 10 (Good) | 17 (Good) | 23 (Good) | 27 (Good) | 29 (Good) | 26 (Good) | 27 (Good) | 28 (Good) | 12 (Good) | 11 (Good) | 15 (Good) | 27 (Good) | 54 (Moderate) |
| o3 | 33 (Good) | 26 (Good) | 18 (Good) | 15 (Good) | 9.1 (Good) | 9.7 (Good) | 14 (Good) | 18 (Good) | 20 (Good) | 18 (Good) | 25 (Good) | 34 (Good) | 38 (Good) | 27 (Good) | 36 (Good) | 10 (Good) | 18 (Good) | 29 (Good) | 22 (Good) | 20 (Good) | 131 (Unhealthy for Sensitive Groups) | 71 (Moderate) | 52 (Good) |
| so2 | 7.1 (Good) | 6.9 (Good) | 6.7 (Good) | 5.6 (Good) | 3.3 (Good) | 1.6 (Good) | 3.6 (Good) | 3.9 (Good) | 2.5 (Good) | 2.2 (Good) | 2.6 (Good) | 4.5 (Good) | 9.4 (Good) | 8.6 (Good) | 5.9 (Good) | 3.9 (Good) | 3.6 (Good) | 4.2 (Good) | 1.5 (Good) | 2.3 (Good) | 4.5 (Good) | 8.9 (Good) | 9.5 (Good) |
| co | - (Good) | - (Good) | - (Good) | - (Good) | - (Good) | - (Good) | - (Good) | - (Good) | - (Good) | - (Good) | - (Good) | - (Good) | - (Good) | - (Good) | - (Good) | - (Good) | - (Good) | - (Good) | - (Good) | - (Good) | - (Good) | 37 (Good) | 44 (Good) |
PM2,5 256 (Very bad Hazardous)
particulate matter (PM2.5) dustPM10 354 (Very bad Hazardous)
particulate matter (PM10) suspended dustO3 1.4 (Good)
ozone (O3)NO2 90 (Moderate)
nitrogen dioxide (NO2)SO2 3.6 (Good)
sulfur dioxide (SO2)Patparganj, Delhi - DPCC
| index | 2022-10-31 |
|---|---|
| pm25 | 256 |
| pm10 | 354 |
| o3 | 1.4 |
| no2 | 90 |
| so2 | 3.6 |
Patparganj, Delhi - DPCC

| index | 2020-05 | 2020-04 | 2020-03 | 2020-02 | 2020-01 | 2019-12 | 2019-11 | 2019-10 | 2019-09 | 2019-08 | 2019-07 | 2019-06 | 2019-05 | 2019-04 | 2019-02 | 2018-12 | 2018-11 | 2018-10 | 2018-09 | 2018-08 | 2018-05 | 2018-04 | 2018-03 |
|---|---|---|---|---|---|---|---|---|---|---|---|---|---|---|---|---|---|---|---|---|---|---|---|
| pm25 | 39 | 40 | 51 | 106 | 146 | 203 | 163 | 110 | 34 | 29 | 51 | 58 | 66 | 68 | 175 | 265 | 207 | 136 | 36 | 27 | 73 | 93 | 188 |
| pm10 | 95 | 84 | 112 | 184 | 229 | 291 | 272 | 202 | 86 | 60 | 114 | 187 | 242 | 284 | 274 | 380 | 302 | 274 | 107 | 91 | 187 | 193 | 135 |
| no2 | 3.9 | 13 | 14 | 24 | 21 | 24 | 29 | 18 | 11 | 9.5 | 10 | 17 | 23 | 27 | 29 | 26 | 27 | 28 | 12 | 11 | 15 | 27 | 54 |
| so2 | 7.1 | 6.9 | 6.7 | 5.6 | 3.3 | 1.6 | 3.6 | 3.9 | 2.5 | 2.2 | 2.6 | 4.5 | 9.4 | 8.6 | 5.9 | 3.9 | 3.6 | 4.2 | 1.5 | 2.3 | 4.5 | 8.9 | 9.5 |
| co | - | - | - | - | - | - | - | - | - | - | - | - | - | - | - | - | - | - | - | - | - | 37 | 44 |
| o3 | 33 | 26 | 18 | 15 | 9.1 | 9.7 | 14 | 18 | 20 | 18 | 25 | 34 | 38 | 27 | 36 | 10 | 18 | 29 | 22 | 20 | 131 | 71 | 52 |