Air Pollution in Garhi Mendhu: Real-time Air Quality Index and smog alert.
Pollution and air quality forecast for Garhi Mendhu. Today is Wednesday, May 13, 2026. The following air pollution values have been recorded for Garhi Mendhu:- nitrogen dioxide (NO2) - 50 (Moderate)
- particulate matter (PM2.5) dust - 310 (Very bad Hazardous)
- particulate matter (PM10) suspended dust - 427 (Very bad Hazardous)
- ozone (O3) - 4 (Good)
- carbon monoxide (CO) - 4 (Good)
- sulfur dioxide (SO2) - 6 (Good)

What is the air quality in Garhi Mendhu today? Is the air polluted in Garhi Mendhu?. Is there smog?
How high is the level of NO2? (nitrogen dioxide (NO2))
50 (Moderate)
What is the current level of PM2.5 in Garhi Mendhu? (particulate matter (PM2.5) dust)
Today's PM2.5 level is:
310 (Very bad Hazardous)
For comparison, the highest level of PM2.5 in Garhi Mendhu in the last 7 days was: 310 (Monday, October 31, 2022) and the lowest: 310 (Monday, October 31, 2022).
The highest PM2.5 values were recorded: 296 (December 2018).
The lowest level of particulate matter PM2.5 pollution occurs in month: August (31).
What is the level of PM10 today in Garhi Mendhu? (particulate matter (PM10) suspended dust)
The current level of particulate matter PM10 in Garhi Mendhu is:
427 (Very bad Hazardous)
The highest PM10 values usually occur in month: 391 (November 2018).
The lowest value of particulate matter PM10 pollution in Garhi Mendhu is usually recorded in: August (77).
How is the O3 level today in Garhi Mendhu? (ozone (O3))
4 (Good)
How high is the CO level? (carbon monoxide (CO))
4 (Good)
What is the level of SO2 pollution? (sulfur dioxide (SO2))
6 (Good)
Current data Monday, October 31, 2022, 12:45 AM
NO2 50 (Moderate)
PM2,5 310 (Very bad Hazardous)
PM10 427 (Very bad Hazardous)
O3 4 (Good)
CO 4 (Good)
SO2 6 (Good)
Data on air pollution from recent days in Garhi Mendhu
index
2022-10-31
no2
50
Moderate
pm25
310
Very bad Hazardous
pm10
427
Very bad Hazardous
o3
4
Good
co
4
Good
so2
6
Good
data source »
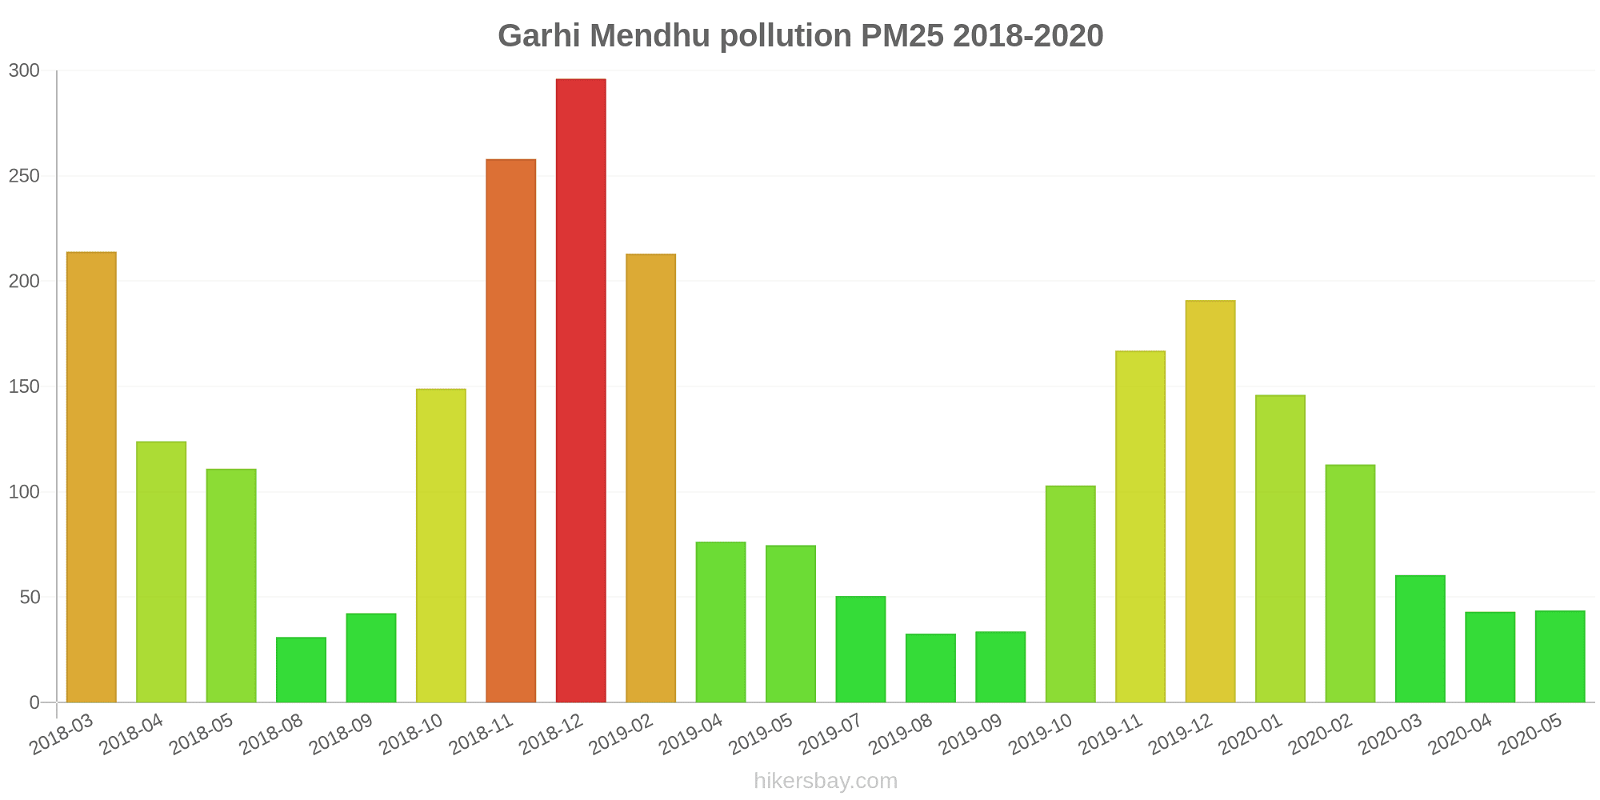
Air pollution in Garhi Mendhu from March 2018 to May 2020
index
2020-05
2020-04
2020-03
2020-02
2020-01
2019-12
2019-11
2019-10
2019-09
2019-08
2019-07
2019-05
2019-04
2019-02
2018-12
2018-11
2018-10
2018-09
2018-08
2018-05
2018-04
2018-03
pm25
44 (Unhealthy for Sensitive Groups)
43 (Unhealthy for Sensitive Groups)
61 (Unhealthy)
113 (Very bad Hazardous)
146 (Very bad Hazardous)
191 (Very bad Hazardous)
167 (Very bad Hazardous)
103 (Very Unhealthy)
34 (Moderate)
33 (Moderate)
51 (Unhealthy for Sensitive Groups)
75 (Unhealthy)
76 (Very Unhealthy)
213 (Very bad Hazardous)
296 (Very bad Hazardous)
258 (Very bad Hazardous)
149 (Very bad Hazardous)
42 (Unhealthy for Sensitive Groups)
31 (Moderate)
111 (Very bad Hazardous)
124 (Very bad Hazardous)
214 (Very bad Hazardous)
pm10
110 (Very Unhealthy)
104 (Unhealthy)
119 (Very Unhealthy)
208 (Very bad Hazardous)
231 (Very bad Hazardous)
309 (Very bad Hazardous)
259 (Very bad Hazardous)
235 (Very bad Hazardous)
87 (Unhealthy)
81 (Unhealthy)
139 (Very Unhealthy)
244 (Very bad Hazardous)
323 (Very bad Hazardous)
330 (Very bad Hazardous)
374 (Very bad Hazardous)
391 (Very bad Hazardous)
306 (Very bad Hazardous)
111 (Very Unhealthy)
77 (Unhealthy for Sensitive Groups)
213 (Very bad Hazardous)
293 (Very bad Hazardous)
240 (Very bad Hazardous)
o3
95 (Moderate)
23 (Good)
61 (Good)
59 (Good)
18 (Good)
28 (Good)
37 (Good)
55 (Good)
30 (Good)
24 (Good)
30 (Good)
62 (Good)
49 (Good)
42 (Good)
31 (Good)
46 (Good)
51 (Good)
26 (Good)
34 (Good)
133 (Unhealthy for Sensitive Groups)
127 (Unhealthy for Sensitive Groups)
82 (Moderate)
co
1.1 (Good)
0.81 (Good)
0.89 (Good)
1.1 (Good)
1.2 (Good)
1.3 (Good)
1.3 (Good)
1.1 (Good)
1.3 (Good)
1.3 (Good)
1.6 (Good)
1.3 (Good)
1.2 (Good)
1.8 (Good)
3.1 (Good)
2.2 (Good)
2.5 (Good)
1.2 (Good)
1 (Good)
0.7 (Good)
28 (Good)
52 (Good)
no2
- (Good)
21 (Good)
33 (Good)
46 (Moderate)
41 (Moderate)
38 (Good)
48 (Moderate)
31 (Good)
16 (Good)
20 (Good)
24 (Good)
29 (Good)
38 (Good)
72 (Moderate)
57 (Moderate)
57 (Moderate)
42 (Moderate)
20 (Good)
17 (Good)
13 (Good)
16 (Good)
26 (Good)
so2
- (Good)
12 (Good)
12 (Good)
13 (Good)
8.5 (Good)
8 (Good)
11 (Good)
12 (Good)
11 (Good)
8.4 (Good)
9.2 (Good)
17 (Good)
20 (Good)
16 (Good)
9.8 (Good)
12 (Good)
13 (Good)
6.5 (Good)
6 (Good)
2.9 (Good)
8.3 (Good)
10 (Good)
data source »
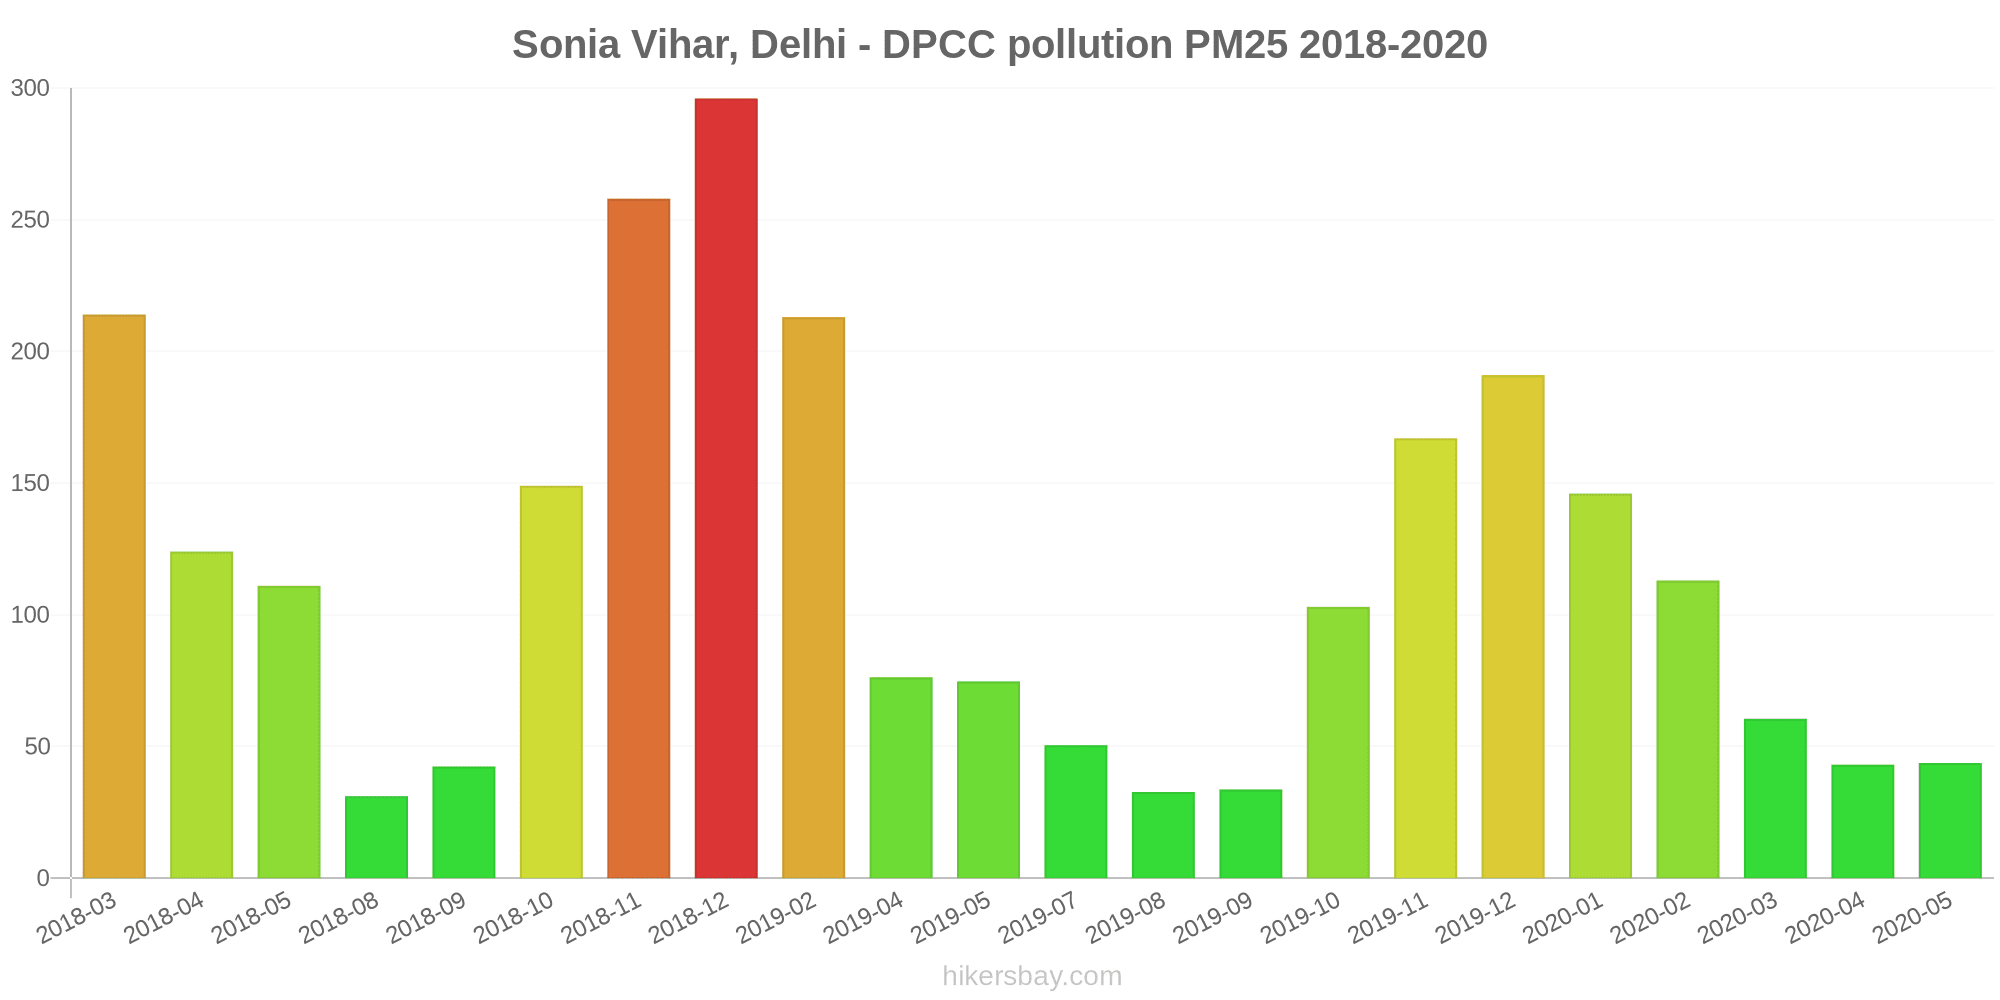
Sonia Vihar, Delhi - DPCC
Monday, October 31, 2022, 12:45 AM
NO2 50 (Moderate)
nitrogen dioxide (NO2)
PM2,5 310 (Very bad Hazardous)
particulate matter (PM2.5) dust
PM10 427 (Very bad Hazardous)
particulate matter (PM10) suspended dust
O3 3.8 (Good)
ozone (O3)
CO 4.2 (Good)
carbon monoxide (CO)
SO2 6 (Good)
sulfur dioxide (SO2)
Sonia Vihar, Delhi - DPCC
index
2022-10-31
no2
50
pm25
310
pm10
427
o3
3.8
co
4.2
so2
6
Sonia Vihar, Delhi - DPCC
2018-03 2020-05

index
2020-05
2020-04
2020-03
2020-02
2020-01
2019-12
2019-11
2019-10
2019-09
2019-08
2019-07
2019-05
2019-04
2019-02
2018-12
2018-11
2018-10
2018-09
2018-08
2018-05
2018-04
2018-03
pm25
44
43
61
113
146
191
167
103
34
33
51
75
76
213
296
258
149
42
31
111
124
214
pm10
110
104
119
208
231
309
259
235
87
81
139
244
323
330
374
391
306
111
77
213
293
240
no2
-
21
33
46
41
38
48
31
16
20
24
29
38
72
57
57
42
20
17
13
16
26
so2
-
12
12
13
8.5
8
11
12
11
8.4
9.2
17
20
16
9.8
12
13
6.5
6
2.9
8.3
10
co
1.1
0.81
0.89
1.1
1.2
1.3
1.3
1.1
1.3
1.3
1.6
1.3
1.2
1.8
3.1
2.2
2.5
1.2
1
0.7
28
52
o3
95
23
61
59
18
28
37
55
30
24
30
62
49
42
31
46
51
26
34
133
127
82
* Pollution data source:
https://openaq.org
(caaqm)
The data is licensed under CC-By 4.0
NO2 50 (Moderate)
PM2,5 310 (Very bad Hazardous)
PM10 427 (Very bad Hazardous)
O3 4 (Good)
CO 4 (Good)
SO2 6 (Good)
Data on air pollution from recent days in Garhi Mendhu
| index | 2022-10-31 |
|---|---|
| no2 | 50 Moderate |
| pm25 | 310 Very bad Hazardous |
| pm10 | 427 Very bad Hazardous |
| o3 | 4 Good |
| co | 4 Good |
| so2 | 6 Good |

| index | 2020-05 | 2020-04 | 2020-03 | 2020-02 | 2020-01 | 2019-12 | 2019-11 | 2019-10 | 2019-09 | 2019-08 | 2019-07 | 2019-05 | 2019-04 | 2019-02 | 2018-12 | 2018-11 | 2018-10 | 2018-09 | 2018-08 | 2018-05 | 2018-04 | 2018-03 |
|---|---|---|---|---|---|---|---|---|---|---|---|---|---|---|---|---|---|---|---|---|---|---|
| pm25 | 44 (Unhealthy for Sensitive Groups) | 43 (Unhealthy for Sensitive Groups) | 61 (Unhealthy) | 113 (Very bad Hazardous) | 146 (Very bad Hazardous) | 191 (Very bad Hazardous) | 167 (Very bad Hazardous) | 103 (Very Unhealthy) | 34 (Moderate) | 33 (Moderate) | 51 (Unhealthy for Sensitive Groups) | 75 (Unhealthy) | 76 (Very Unhealthy) | 213 (Very bad Hazardous) | 296 (Very bad Hazardous) | 258 (Very bad Hazardous) | 149 (Very bad Hazardous) | 42 (Unhealthy for Sensitive Groups) | 31 (Moderate) | 111 (Very bad Hazardous) | 124 (Very bad Hazardous) | 214 (Very bad Hazardous) |
| pm10 | 110 (Very Unhealthy) | 104 (Unhealthy) | 119 (Very Unhealthy) | 208 (Very bad Hazardous) | 231 (Very bad Hazardous) | 309 (Very bad Hazardous) | 259 (Very bad Hazardous) | 235 (Very bad Hazardous) | 87 (Unhealthy) | 81 (Unhealthy) | 139 (Very Unhealthy) | 244 (Very bad Hazardous) | 323 (Very bad Hazardous) | 330 (Very bad Hazardous) | 374 (Very bad Hazardous) | 391 (Very bad Hazardous) | 306 (Very bad Hazardous) | 111 (Very Unhealthy) | 77 (Unhealthy for Sensitive Groups) | 213 (Very bad Hazardous) | 293 (Very bad Hazardous) | 240 (Very bad Hazardous) |
| o3 | 95 (Moderate) | 23 (Good) | 61 (Good) | 59 (Good) | 18 (Good) | 28 (Good) | 37 (Good) | 55 (Good) | 30 (Good) | 24 (Good) | 30 (Good) | 62 (Good) | 49 (Good) | 42 (Good) | 31 (Good) | 46 (Good) | 51 (Good) | 26 (Good) | 34 (Good) | 133 (Unhealthy for Sensitive Groups) | 127 (Unhealthy for Sensitive Groups) | 82 (Moderate) |
| co | 1.1 (Good) | 0.81 (Good) | 0.89 (Good) | 1.1 (Good) | 1.2 (Good) | 1.3 (Good) | 1.3 (Good) | 1.1 (Good) | 1.3 (Good) | 1.3 (Good) | 1.6 (Good) | 1.3 (Good) | 1.2 (Good) | 1.8 (Good) | 3.1 (Good) | 2.2 (Good) | 2.5 (Good) | 1.2 (Good) | 1 (Good) | 0.7 (Good) | 28 (Good) | 52 (Good) |
| no2 | - (Good) | 21 (Good) | 33 (Good) | 46 (Moderate) | 41 (Moderate) | 38 (Good) | 48 (Moderate) | 31 (Good) | 16 (Good) | 20 (Good) | 24 (Good) | 29 (Good) | 38 (Good) | 72 (Moderate) | 57 (Moderate) | 57 (Moderate) | 42 (Moderate) | 20 (Good) | 17 (Good) | 13 (Good) | 16 (Good) | 26 (Good) |
| so2 | - (Good) | 12 (Good) | 12 (Good) | 13 (Good) | 8.5 (Good) | 8 (Good) | 11 (Good) | 12 (Good) | 11 (Good) | 8.4 (Good) | 9.2 (Good) | 17 (Good) | 20 (Good) | 16 (Good) | 9.8 (Good) | 12 (Good) | 13 (Good) | 6.5 (Good) | 6 (Good) | 2.9 (Good) | 8.3 (Good) | 10 (Good) |
NO2 50 (Moderate)
nitrogen dioxide (NO2)PM2,5 310 (Very bad Hazardous)
particulate matter (PM2.5) dustPM10 427 (Very bad Hazardous)
particulate matter (PM10) suspended dustO3 3.8 (Good)
ozone (O3)CO 4.2 (Good)
carbon monoxide (CO)SO2 6 (Good)
sulfur dioxide (SO2)Sonia Vihar, Delhi - DPCC
| index | 2022-10-31 |
|---|---|
| no2 | 50 |
| pm25 | 310 |
| pm10 | 427 |
| o3 | 3.8 |
| co | 4.2 |
| so2 | 6 |
Sonia Vihar, Delhi - DPCC
| index | 2020-05 | 2020-04 | 2020-03 | 2020-02 | 2020-01 | 2019-12 | 2019-11 | 2019-10 | 2019-09 | 2019-08 | 2019-07 | 2019-05 | 2019-04 | 2019-02 | 2018-12 | 2018-11 | 2018-10 | 2018-09 | 2018-08 | 2018-05 | 2018-04 | 2018-03 |
|---|---|---|---|---|---|---|---|---|---|---|---|---|---|---|---|---|---|---|---|---|---|---|
| pm25 | 44 | 43 | 61 | 113 | 146 | 191 | 167 | 103 | 34 | 33 | 51 | 75 | 76 | 213 | 296 | 258 | 149 | 42 | 31 | 111 | 124 | 214 |
| pm10 | 110 | 104 | 119 | 208 | 231 | 309 | 259 | 235 | 87 | 81 | 139 | 244 | 323 | 330 | 374 | 391 | 306 | 111 | 77 | 213 | 293 | 240 |
| no2 | - | 21 | 33 | 46 | 41 | 38 | 48 | 31 | 16 | 20 | 24 | 29 | 38 | 72 | 57 | 57 | 42 | 20 | 17 | 13 | 16 | 26 |
| so2 | - | 12 | 12 | 13 | 8.5 | 8 | 11 | 12 | 11 | 8.4 | 9.2 | 17 | 20 | 16 | 9.8 | 12 | 13 | 6.5 | 6 | 2.9 | 8.3 | 10 |
| co | 1.1 | 0.81 | 0.89 | 1.1 | 1.2 | 1.3 | 1.3 | 1.1 | 1.3 | 1.3 | 1.6 | 1.3 | 1.2 | 1.8 | 3.1 | 2.2 | 2.5 | 1.2 | 1 | 0.7 | 28 | 52 |
| o3 | 95 | 23 | 61 | 59 | 18 | 28 | 37 | 55 | 30 | 24 | 30 | 62 | 49 | 42 | 31 | 46 | 51 | 26 | 34 | 133 | 127 | 82 |