Air Pollution in Indraprasiha: Real-time Air Quality Index and smog alert.
Pollution and air quality forecast for Indraprasiha. Today is Wednesday, May 13, 2026. The following air pollution values have been recorded for Indraprasiha:- particulate matter (PM2.5) dust - 228 (Very bad Hazardous)
- particulate matter (PM10) suspended dust - 327 (Very bad Hazardous)
- nitrogen dioxide (NO2) - 46 (Moderate)
- ozone (O3) - 1 (Good)
- sulfur dioxide (SO2) - 0 (Good)
- carbon monoxide (CO) - 300 (Good)

What is the air quality in Indraprasiha today? Is the air polluted in Indraprasiha?. Is there smog?
What is the current level of PM2.5 in Indraprasiha? (particulate matter (PM2.5) dust)
Today's PM2.5 level is:
228 (Very bad Hazardous)
For comparison, the highest level of PM2.5 in Indraprasiha in the last 7 days was: 228 (Monday, October 31, 2022) and the lowest: 228 (Monday, October 31, 2022).
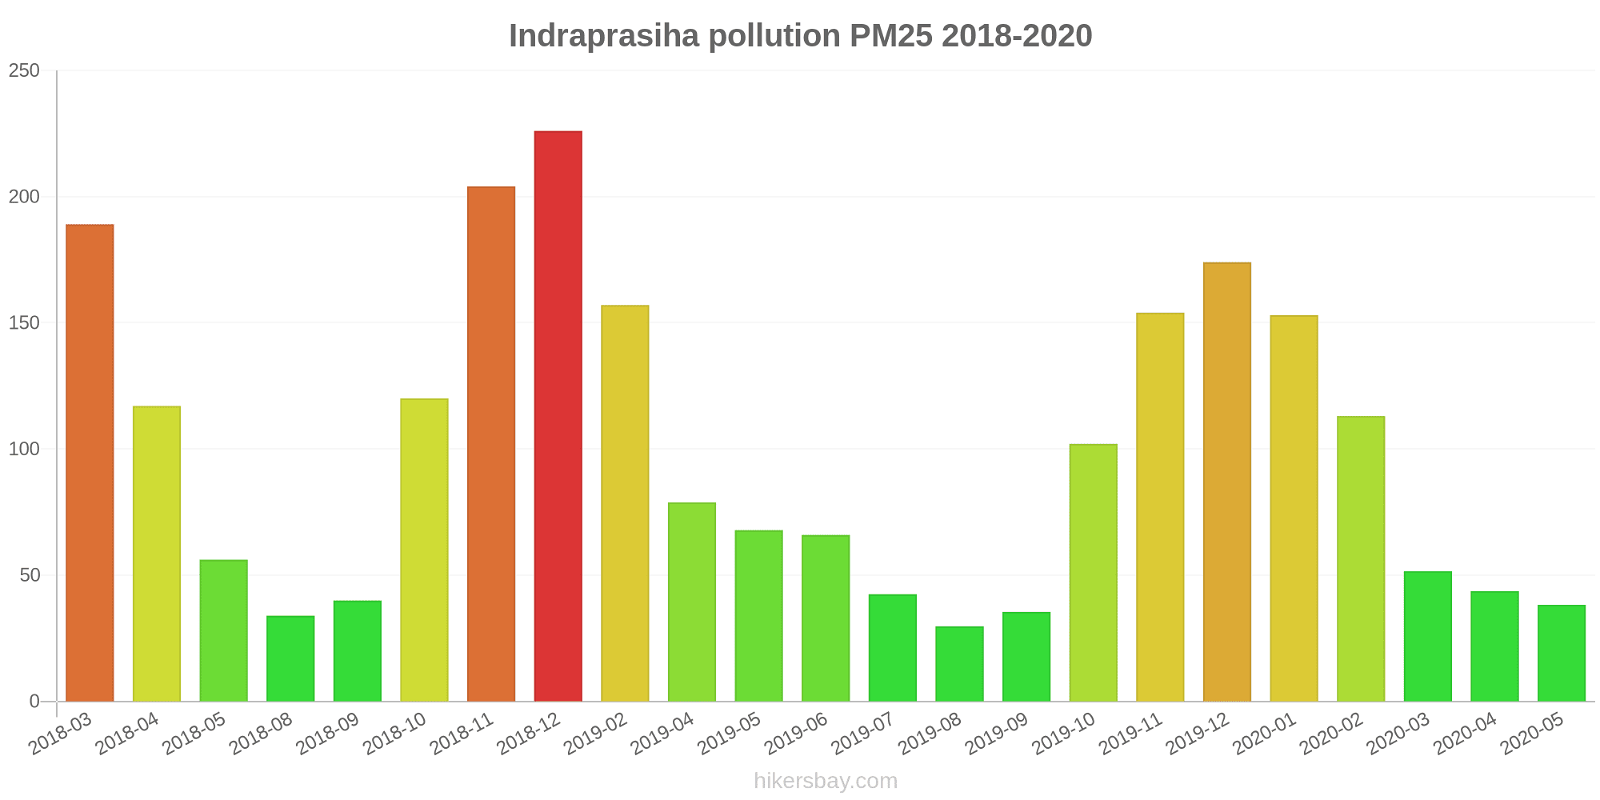
The highest PM2.5 values were recorded: 226 (December 2018).
The lowest level of particulate matter PM2.5 pollution occurs in month: August (30).
What is the level of PM10 today in Indraprasiha? (particulate matter (PM10) suspended dust)
The current level of particulate matter PM10 in Indraprasiha is:
327 (Very bad Hazardous)
The highest PM10 values usually occur in month: 413 (December 2018).
The lowest value of particulate matter PM10 pollution in Indraprasiha is usually recorded in: August (76).
How high is the level of NO2? (nitrogen dioxide (NO2))
46 (Moderate)
How is the O3 level today in Indraprasiha? (ozone (O3))
1 (Good)
What is the level of SO2 pollution? (sulfur dioxide (SO2))
0 (Good)
How high is the CO level? (carbon monoxide (CO))
300 (Good)
Current data Monday, October 31, 2022, 12:45 AM
PM2,5 228 (Very bad Hazardous)
PM10 327 (Very bad Hazardous)
NO2 46 (Moderate)
O3 1 (Good)
SO2 0 (Good)
CO 300 (Good)
Data on air pollution from recent days in Indraprasiha
index
2022-10-31
pm25
228
Very bad Hazardous
pm10
327
Very bad Hazardous
no2
46
Moderate
o3
1
Good
so2
0
Good
co
300
Good
data source »
Air pollution in Indraprasiha from March 2018 to May 2020
index
2020-05
2020-04
2020-03
2020-02
2020-01
2019-12
2019-11
2019-10
2019-09
2019-08
2019-07
2019-06
2019-05
2019-04
2019-02
2018-12
2018-11
2018-10
2018-09
2018-08
2018-05
2018-04
2018-03
pm25
38 (Unhealthy for Sensitive Groups)
44 (Unhealthy for Sensitive Groups)
52 (Unhealthy for Sensitive Groups)
113 (Very bad Hazardous)
153 (Very bad Hazardous)
174 (Very bad Hazardous)
154 (Very bad Hazardous)
102 (Very Unhealthy)
35 (Unhealthy for Sensitive Groups)
30 (Moderate)
42 (Unhealthy for Sensitive Groups)
66 (Unhealthy)
68 (Unhealthy)
79 (Very Unhealthy)
157 (Very bad Hazardous)
226 (Very bad Hazardous)
204 (Very bad Hazardous)
120 (Very bad Hazardous)
40 (Unhealthy for Sensitive Groups)
34 (Moderate)
56 (Unhealthy)
117 (Very bad Hazardous)
189 (Very bad Hazardous)
pm10
86 (Unhealthy)
92 (Unhealthy)
108 (Unhealthy)
200 (Very bad Hazardous)
232 (Very bad Hazardous)
316 (Very bad Hazardous)
278 (Very bad Hazardous)
215 (Very bad Hazardous)
88 (Unhealthy)
76 (Unhealthy for Sensitive Groups)
136 (Very Unhealthy)
188 (Very bad Hazardous)
235 (Very bad Hazardous)
265 (Very bad Hazardous)
307 (Very bad Hazardous)
413 (Very bad Hazardous)
326 (Very bad Hazardous)
269 (Very bad Hazardous)
91 (Unhealthy)
81 (Unhealthy)
187 (Very bad Hazardous)
204 (Very bad Hazardous)
210 (Very bad Hazardous)
no2
15 (Good)
17 (Good)
36 (Good)
61 (Moderate)
61 (Moderate)
85 (Moderate)
98 (Moderate)
72 (Moderate)
36 (Good)
37 (Good)
38 (Good)
51 (Moderate)
69 (Moderate)
77 (Moderate)
91 (Moderate)
79 (Moderate)
83 (Moderate)
84 (Moderate)
39 (Good)
38 (Good)
51 (Moderate)
71 (Moderate)
82 (Moderate)
co
464 (Good)
452 (Good)
750 (Good)
1 (Good)
1 (Good)
1 (Good)
2 (Good)
1 (Good)
1 (Good)
1 (Good)
1 (Good)
1 (Good)
1 (Good)
1 (Good)
2 (Good)
3 (Good)
2 (Good)
2 (Good)
969 (Good)
824 (Good)
1 (Good)
39 (Good)
65 (Good)
o3
30 (Good)
25 (Good)
19 (Good)
19 (Good)
14 (Good)
15 (Good)
12 (Good)
17 (Good)
15 (Good)
14 (Good)
22 (Good)
52 (Good)
50 (Good)
34 (Good)
21 (Good)
11 (Good)
38 (Good)
49 (Good)
24 (Good)
26 (Good)
79 (Moderate)
59 (Good)
28 (Good)
so2
19 (Good)
19 (Good)
19 (Good)
18 (Good)
13 (Good)
12 (Good)
15 (Good)
13 (Good)
7.8 (Good)
9.1 (Good)
10 (Good)
12 (Good)
26 (Good)
23 (Good)
14 (Good)
12 (Good)
15 (Good)
17 (Good)
11 (Good)
10 (Good)
6.9 (Good)
21 (Good)
32 (Good)
data source »
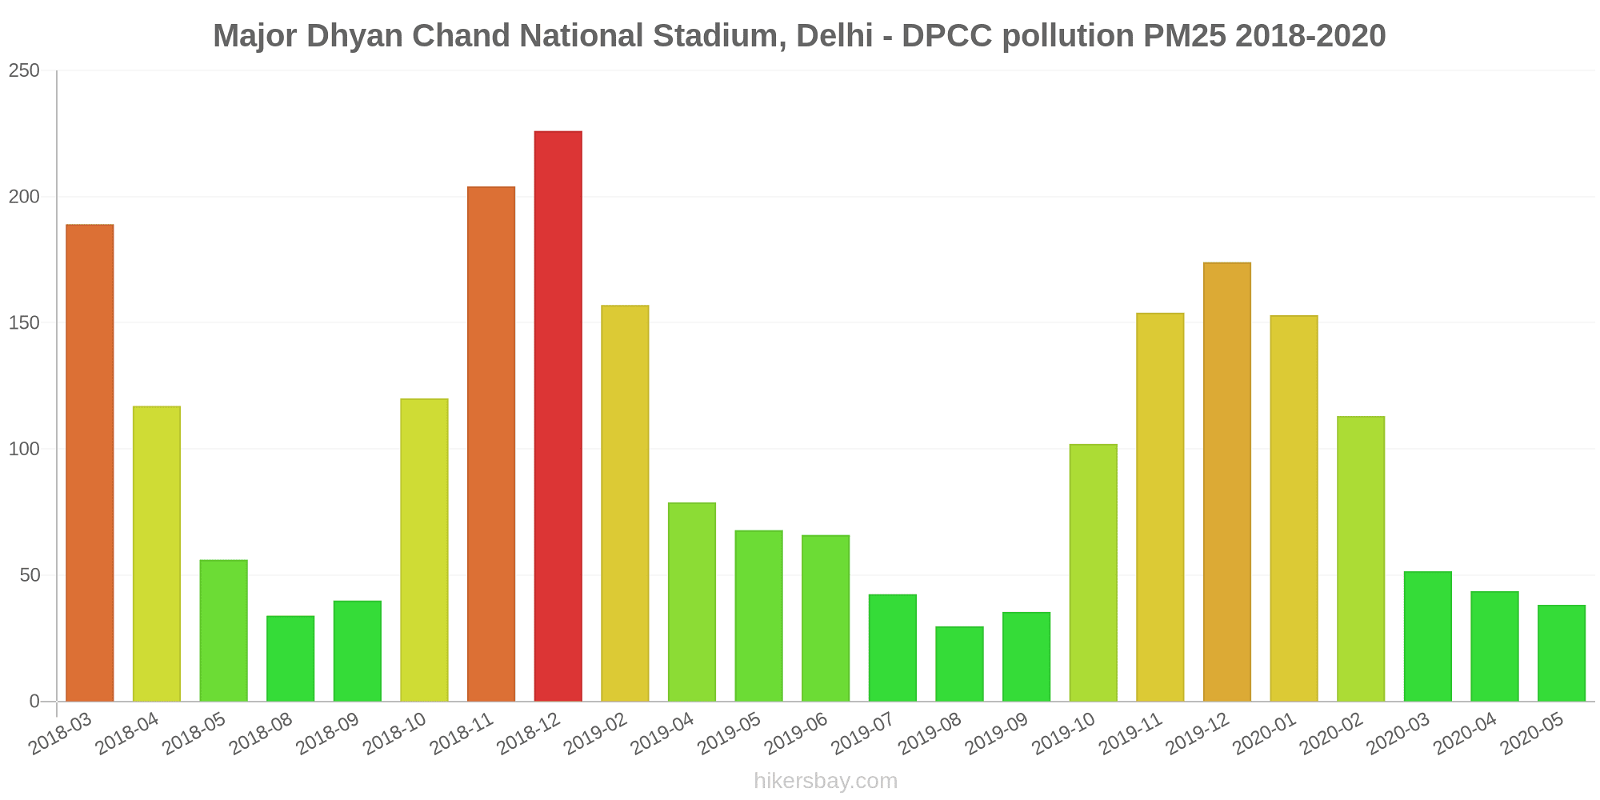
Major Dhyan Chand National Stadium, Delhi - DPCC
Monday, October 31, 2022, 12:45 AM
PM2,5 228 (Very bad Hazardous)
particulate matter (PM2.5) dust
PM10 327 (Very bad Hazardous)
particulate matter (PM10) suspended dust
NO2 46 (Moderate)
nitrogen dioxide (NO2)
O3 1 (Good)
ozone (O3)
SO2 0.1 (Good)
sulfur dioxide (SO2)
CO 300 (Good)
carbon monoxide (CO)
Major Dhyan Chand National Stadium, Delhi - DPCC
index
2022-10-31
pm25
228
pm10
327
no2
46
o3
1
so2
0.1
co
300
Major Dhyan Chand National Stadium, Delhi - DPCC
2018-03 2020-05
index
2020-05
2020-04
2020-03
2020-02
2020-01
2019-12
2019-11
2019-10
2019-09
2019-08
2019-07
2019-06
2019-05
2019-04
2019-02
2018-12
2018-11
2018-10
2018-09
2018-08
2018-05
2018-04
2018-03
so2
19
19
19
18
13
12
15
13
7.8
9.1
10
12
26
23
14
12
15
17
11
10
6.9
21
32
pm25
38
44
52
113
153
174
154
102
35
30
42
66
68
79
157
226
204
120
40
34
56
117
189
pm10
86
92
108
200
232
316
278
215
88
76
136
188
235
265
307
413
326
269
91
81
187
204
210
no2
15
17
36
61
61
85
98
72
36
37
38
51
69
77
91
79
83
84
39
38
51
71
82
co
464
452
750
1
1
1
2
1
1
1
1
1
1
1
2
3
2
2
969
824
1
39
65
o3
30
25
19
19
14
15
12
17
15
14
22
52
50
34
21
11
38
49
24
26
79
59
28
* Pollution data source:
https://openaq.org
(caaqm)
The data is licensed under CC-By 4.0
PM2,5 228 (Very bad Hazardous)
PM10 327 (Very bad Hazardous)
NO2 46 (Moderate)
O3 1 (Good)
SO2 0 (Good)
CO 300 (Good)
Data on air pollution from recent days in Indraprasiha
| index | 2022-10-31 |
|---|---|
| pm25 | 228 Very bad Hazardous |
| pm10 | 327 Very bad Hazardous |
| no2 | 46 Moderate |
| o3 | 1 Good |
| so2 | 0 Good |
| co | 300 Good |

| index | 2020-05 | 2020-04 | 2020-03 | 2020-02 | 2020-01 | 2019-12 | 2019-11 | 2019-10 | 2019-09 | 2019-08 | 2019-07 | 2019-06 | 2019-05 | 2019-04 | 2019-02 | 2018-12 | 2018-11 | 2018-10 | 2018-09 | 2018-08 | 2018-05 | 2018-04 | 2018-03 |
|---|---|---|---|---|---|---|---|---|---|---|---|---|---|---|---|---|---|---|---|---|---|---|---|
| pm25 | 38 (Unhealthy for Sensitive Groups) | 44 (Unhealthy for Sensitive Groups) | 52 (Unhealthy for Sensitive Groups) | 113 (Very bad Hazardous) | 153 (Very bad Hazardous) | 174 (Very bad Hazardous) | 154 (Very bad Hazardous) | 102 (Very Unhealthy) | 35 (Unhealthy for Sensitive Groups) | 30 (Moderate) | 42 (Unhealthy for Sensitive Groups) | 66 (Unhealthy) | 68 (Unhealthy) | 79 (Very Unhealthy) | 157 (Very bad Hazardous) | 226 (Very bad Hazardous) | 204 (Very bad Hazardous) | 120 (Very bad Hazardous) | 40 (Unhealthy for Sensitive Groups) | 34 (Moderate) | 56 (Unhealthy) | 117 (Very bad Hazardous) | 189 (Very bad Hazardous) |
| pm10 | 86 (Unhealthy) | 92 (Unhealthy) | 108 (Unhealthy) | 200 (Very bad Hazardous) | 232 (Very bad Hazardous) | 316 (Very bad Hazardous) | 278 (Very bad Hazardous) | 215 (Very bad Hazardous) | 88 (Unhealthy) | 76 (Unhealthy for Sensitive Groups) | 136 (Very Unhealthy) | 188 (Very bad Hazardous) | 235 (Very bad Hazardous) | 265 (Very bad Hazardous) | 307 (Very bad Hazardous) | 413 (Very bad Hazardous) | 326 (Very bad Hazardous) | 269 (Very bad Hazardous) | 91 (Unhealthy) | 81 (Unhealthy) | 187 (Very bad Hazardous) | 204 (Very bad Hazardous) | 210 (Very bad Hazardous) |
| no2 | 15 (Good) | 17 (Good) | 36 (Good) | 61 (Moderate) | 61 (Moderate) | 85 (Moderate) | 98 (Moderate) | 72 (Moderate) | 36 (Good) | 37 (Good) | 38 (Good) | 51 (Moderate) | 69 (Moderate) | 77 (Moderate) | 91 (Moderate) | 79 (Moderate) | 83 (Moderate) | 84 (Moderate) | 39 (Good) | 38 (Good) | 51 (Moderate) | 71 (Moderate) | 82 (Moderate) |
| co | 464 (Good) | 452 (Good) | 750 (Good) | 1 (Good) | 1 (Good) | 1 (Good) | 2 (Good) | 1 (Good) | 1 (Good) | 1 (Good) | 1 (Good) | 1 (Good) | 1 (Good) | 1 (Good) | 2 (Good) | 3 (Good) | 2 (Good) | 2 (Good) | 969 (Good) | 824 (Good) | 1 (Good) | 39 (Good) | 65 (Good) |
| o3 | 30 (Good) | 25 (Good) | 19 (Good) | 19 (Good) | 14 (Good) | 15 (Good) | 12 (Good) | 17 (Good) | 15 (Good) | 14 (Good) | 22 (Good) | 52 (Good) | 50 (Good) | 34 (Good) | 21 (Good) | 11 (Good) | 38 (Good) | 49 (Good) | 24 (Good) | 26 (Good) | 79 (Moderate) | 59 (Good) | 28 (Good) |
| so2 | 19 (Good) | 19 (Good) | 19 (Good) | 18 (Good) | 13 (Good) | 12 (Good) | 15 (Good) | 13 (Good) | 7.8 (Good) | 9.1 (Good) | 10 (Good) | 12 (Good) | 26 (Good) | 23 (Good) | 14 (Good) | 12 (Good) | 15 (Good) | 17 (Good) | 11 (Good) | 10 (Good) | 6.9 (Good) | 21 (Good) | 32 (Good) |
PM2,5 228 (Very bad Hazardous)
particulate matter (PM2.5) dustPM10 327 (Very bad Hazardous)
particulate matter (PM10) suspended dustNO2 46 (Moderate)
nitrogen dioxide (NO2)O3 1 (Good)
ozone (O3)SO2 0.1 (Good)
sulfur dioxide (SO2)CO 300 (Good)
carbon monoxide (CO)Major Dhyan Chand National Stadium, Delhi - DPCC
| index | 2022-10-31 |
|---|---|
| pm25 | 228 |
| pm10 | 327 |
| no2 | 46 |
| o3 | 1 |
| so2 | 0.1 |
| co | 300 |
Major Dhyan Chand National Stadium, Delhi - DPCC

| index | 2020-05 | 2020-04 | 2020-03 | 2020-02 | 2020-01 | 2019-12 | 2019-11 | 2019-10 | 2019-09 | 2019-08 | 2019-07 | 2019-06 | 2019-05 | 2019-04 | 2019-02 | 2018-12 | 2018-11 | 2018-10 | 2018-09 | 2018-08 | 2018-05 | 2018-04 | 2018-03 |
|---|---|---|---|---|---|---|---|---|---|---|---|---|---|---|---|---|---|---|---|---|---|---|---|
| so2 | 19 | 19 | 19 | 18 | 13 | 12 | 15 | 13 | 7.8 | 9.1 | 10 | 12 | 26 | 23 | 14 | 12 | 15 | 17 | 11 | 10 | 6.9 | 21 | 32 |
| pm25 | 38 | 44 | 52 | 113 | 153 | 174 | 154 | 102 | 35 | 30 | 42 | 66 | 68 | 79 | 157 | 226 | 204 | 120 | 40 | 34 | 56 | 117 | 189 |
| pm10 | 86 | 92 | 108 | 200 | 232 | 316 | 278 | 215 | 88 | 76 | 136 | 188 | 235 | 265 | 307 | 413 | 326 | 269 | 91 | 81 | 187 | 204 | 210 |
| no2 | 15 | 17 | 36 | 61 | 61 | 85 | 98 | 72 | 36 | 37 | 38 | 51 | 69 | 77 | 91 | 79 | 83 | 84 | 39 | 38 | 51 | 71 | 82 |
| co | 464 | 452 | 750 | 1 | 1 | 1 | 2 | 1 | 1 | 1 | 1 | 1 | 1 | 1 | 2 | 3 | 2 | 2 | 969 | 824 | 1 | 39 | 65 |
| o3 | 30 | 25 | 19 | 19 | 14 | 15 | 12 | 17 | 15 | 14 | 22 | 52 | 50 | 34 | 21 | 11 | 38 | 49 | 24 | 26 | 79 | 59 | 28 |