Air Pollution in Rāmlila Ground: Real-time Air Quality Index and smog alert.
Pollution and air quality forecast for Rāmlila Ground. Today is Wednesday, May 13, 2026. The following air pollution values have been recorded for Rāmlila Ground:- particulate matter (PM10) suspended dust - 235 (Very bad Hazardous)
- sulfur dioxide (SO2) - 8 (Good)
- particulate matter (PM2.5) dust - 188 (Very bad Hazardous)
- carbon monoxide (CO) - 1760 (Good)
- nitrogen dioxide (NO2) - 83 (Moderate)
- ozone (O3) - 16 (Good)

What is the air quality in Rāmlila Ground today? Is the air polluted in Rāmlila Ground?. Is there smog?
What is the level of PM10 today in Rāmlila Ground? (particulate matter (PM10) suspended dust)
The current level of particulate matter PM10 in Rāmlila Ground is:
235 (Very bad Hazardous)
The highest PM10 values usually occur in month: 341 (December 2018).
The lowest value of particulate matter PM10 pollution in Rāmlila Ground is usually recorded in: August (64).
What is the level of SO2 pollution? (sulfur dioxide (SO2))
8 (Good)
What is the current level of PM2.5 in Rāmlila Ground? (particulate matter (PM2.5) dust)
Today's PM2.5 level is:
188 (Very bad Hazardous)
For comparison, the highest level of PM2.5 in Rāmlila Ground in the last 7 days was: 200 (Monday, October 31, 2022) and the lowest: 200 (Monday, October 31, 2022).
The highest PM2.5 values were recorded: 269 (December 2018).
The lowest level of particulate matter PM2.5 pollution occurs in month: August (37).
How high is the CO level? (carbon monoxide (CO))
1760 (Good)
How high is the level of NO2? (nitrogen dioxide (NO2))
83 (Moderate)
How is the O3 level today in Rāmlila Ground? (ozone (O3))
16 (Good)
Current data Monday, October 31, 2022, 1:45 AM
PM10 235 (Very bad Hazardous)
SO2 8 (Good)
PM2,5 188 (Very bad Hazardous)
CO 1760 (Good)
NO2 83 (Moderate)
O3 16 (Good)
Data on air pollution from recent days in Rāmlila Ground
index
2022-10-31
pm10
246
Very bad Hazardous
so2
9
Good
pm25
200
Very bad Hazardous
co
1910
Good
no2
87
Moderate
o3
16
Good
data source »
Air pollution in Rāmlila Ground from December 2018 to May 2020

index
2020-05
2020-04
2020-03
2020-02
2020-01
2019-12
2019-11
2019-10
2019-09
2019-08
2019-07
2019-05
2019-04
2019-02
2018-12
pm25
53 (Unhealthy for Sensitive Groups)
58 (Unhealthy)
57 (Unhealthy)
121 (Very bad Hazardous)
145 (Very bad Hazardous)
196 (Very bad Hazardous)
176 (Very bad Hazardous)
116 (Very bad Hazardous)
42 (Unhealthy for Sensitive Groups)
37 (Unhealthy for Sensitive Groups)
47 (Unhealthy for Sensitive Groups)
92 (Very Unhealthy)
83 (Very Unhealthy)
200 (Very bad Hazardous)
269 (Very bad Hazardous)
no2
21 (Good)
19 (Good)
35 (Good)
26 (Good)
29 (Good)
58 (Moderate)
54 (Moderate)
20 (Good)
22 (Good)
15 (Good)
32 (Good)
62 (Moderate)
- (Good)
25 (Good)
40 (Good)
so2
13 (Good)
15 (Good)
16 (Good)
19 (Good)
11 (Good)
4.9 (Good)
7.7 (Good)
9.3 (Good)
2.9 (Good)
2.5 (Good)
3.2 (Good)
27 (Good)
19 (Good)
- (Good)
7.5 (Good)
co
2 (Good)
2 (Good)
1 (Good)
1 (Good)
1 (Good)
1 (Good)
1 (Good)
985 (Good)
730 (Good)
644 (Good)
1 (Good)
1 (Good)
1 (Good)
1 (Good)
3 (Good)
o3
73 (Moderate)
45 (Good)
27 (Good)
19 (Good)
13 (Good)
17 (Good)
29 (Good)
47 (Good)
27 (Good)
30 (Good)
16 (Good)
15 (Good)
- (Good)
12 (Good)
12 (Good)
pm10
140 (Very Unhealthy)
84 (Unhealthy)
90 (Unhealthy)
172 (Very bad Hazardous)
186 (Very bad Hazardous)
248 (Very bad Hazardous)
223 (Very bad Hazardous)
164 (Very bad Hazardous)
70 (Unhealthy for Sensitive Groups)
64 (Unhealthy for Sensitive Groups)
115 (Very Unhealthy)
205 (Very bad Hazardous)
190 (Very bad Hazardous)
275 (Very bad Hazardous)
341 (Very bad Hazardous)
data source »
ITO, New Delhi - CPCB
Monday, October 31, 2022, 1:45 AM
PM10 235 (Very bad Hazardous)
particulate matter (PM10) suspended dust
SO2 8.4 (Good)
sulfur dioxide (SO2)
PM2,5 188 (Very bad Hazardous)
particulate matter (PM2.5) dust
CO 1760 (Good)
carbon monoxide (CO)
NO2 83 (Moderate)
nitrogen dioxide (NO2)
O3 16 (Good)
ozone (O3)
ITO, New Delhi - CPCB
index
2022-10-31
pm10
246
so2
8.5
pm25
200
co
1910
no2
87
o3
16
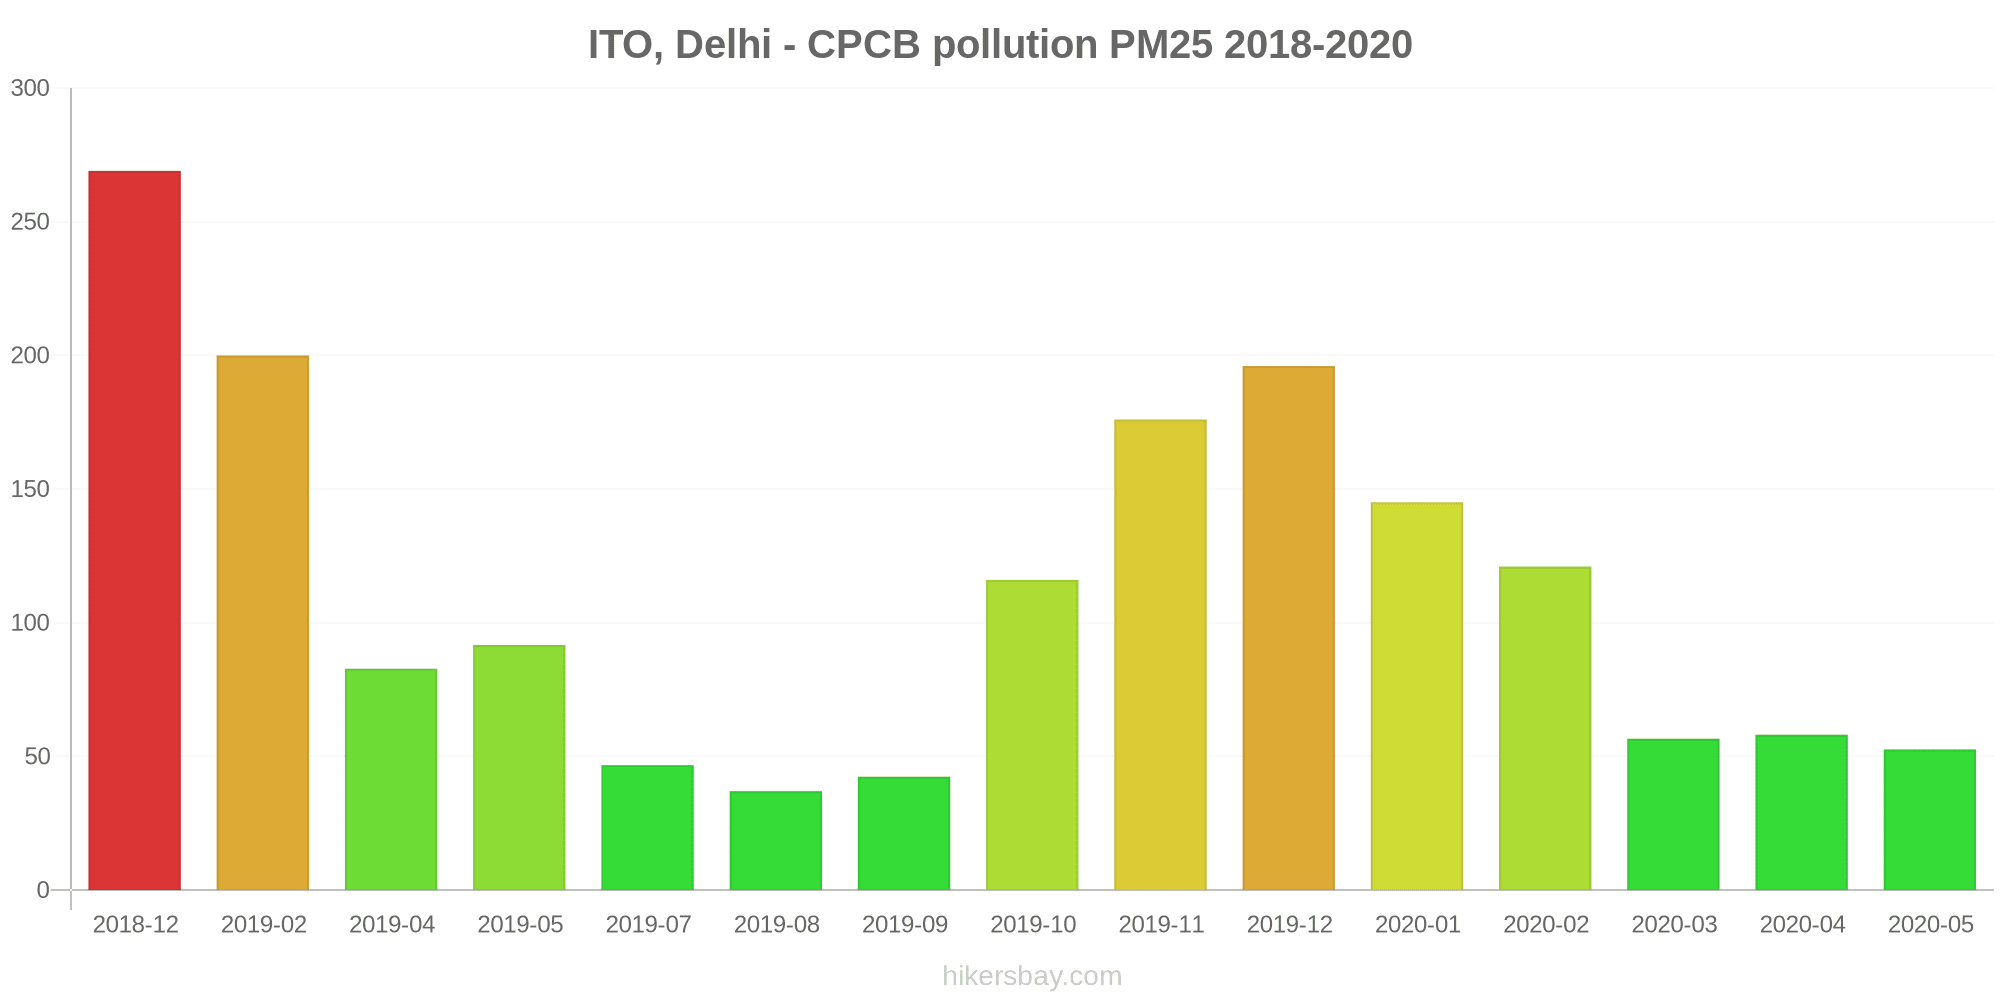
ITO, Delhi - CPCB
2018-12 2020-05

index
2020-05
2020-04
2020-03
2020-02
2020-01
2019-12
2019-11
2019-10
2019-09
2019-08
2019-07
2019-05
2019-04
2019-02
2018-12
pm10
140
84
90
172
186
248
223
164
70
64
115
205
190
275
341
no2
21
19
35
26
29
58
54
20
22
15
32
62
-
25
40
so2
13
15
16
19
11
4.9
7.7
9.3
2.9
2.5
3.2
27
19
-
7.5
co
2
2
1
1
1
1
1
985
730
644
1
1
1
1
3
o3
73
45
27
19
13
17
29
47
27
30
16
15
-
12
12
pm25
53
58
57
121
145
196
176
116
42
37
47
92
83
200
269
* Pollution data source:
https://openaq.org
(caaqm)
The data is licensed under CC-By 4.0
PM10 235 (Very bad Hazardous)
SO2 8 (Good)
PM2,5 188 (Very bad Hazardous)
CO 1760 (Good)
NO2 83 (Moderate)
O3 16 (Good)
Data on air pollution from recent days in Rāmlila Ground
| index | 2022-10-31 |
|---|---|
| pm10 | 246 Very bad Hazardous |
| so2 | 9 Good |
| pm25 | 200 Very bad Hazardous |
| co | 1910 Good |
| no2 | 87 Moderate |
| o3 | 16 Good |

| index | 2020-05 | 2020-04 | 2020-03 | 2020-02 | 2020-01 | 2019-12 | 2019-11 | 2019-10 | 2019-09 | 2019-08 | 2019-07 | 2019-05 | 2019-04 | 2019-02 | 2018-12 |
|---|---|---|---|---|---|---|---|---|---|---|---|---|---|---|---|
| pm25 | 53 (Unhealthy for Sensitive Groups) | 58 (Unhealthy) | 57 (Unhealthy) | 121 (Very bad Hazardous) | 145 (Very bad Hazardous) | 196 (Very bad Hazardous) | 176 (Very bad Hazardous) | 116 (Very bad Hazardous) | 42 (Unhealthy for Sensitive Groups) | 37 (Unhealthy for Sensitive Groups) | 47 (Unhealthy for Sensitive Groups) | 92 (Very Unhealthy) | 83 (Very Unhealthy) | 200 (Very bad Hazardous) | 269 (Very bad Hazardous) |
| no2 | 21 (Good) | 19 (Good) | 35 (Good) | 26 (Good) | 29 (Good) | 58 (Moderate) | 54 (Moderate) | 20 (Good) | 22 (Good) | 15 (Good) | 32 (Good) | 62 (Moderate) | - (Good) | 25 (Good) | 40 (Good) |
| so2 | 13 (Good) | 15 (Good) | 16 (Good) | 19 (Good) | 11 (Good) | 4.9 (Good) | 7.7 (Good) | 9.3 (Good) | 2.9 (Good) | 2.5 (Good) | 3.2 (Good) | 27 (Good) | 19 (Good) | - (Good) | 7.5 (Good) |
| co | 2 (Good) | 2 (Good) | 1 (Good) | 1 (Good) | 1 (Good) | 1 (Good) | 1 (Good) | 985 (Good) | 730 (Good) | 644 (Good) | 1 (Good) | 1 (Good) | 1 (Good) | 1 (Good) | 3 (Good) |
| o3 | 73 (Moderate) | 45 (Good) | 27 (Good) | 19 (Good) | 13 (Good) | 17 (Good) | 29 (Good) | 47 (Good) | 27 (Good) | 30 (Good) | 16 (Good) | 15 (Good) | - (Good) | 12 (Good) | 12 (Good) |
| pm10 | 140 (Very Unhealthy) | 84 (Unhealthy) | 90 (Unhealthy) | 172 (Very bad Hazardous) | 186 (Very bad Hazardous) | 248 (Very bad Hazardous) | 223 (Very bad Hazardous) | 164 (Very bad Hazardous) | 70 (Unhealthy for Sensitive Groups) | 64 (Unhealthy for Sensitive Groups) | 115 (Very Unhealthy) | 205 (Very bad Hazardous) | 190 (Very bad Hazardous) | 275 (Very bad Hazardous) | 341 (Very bad Hazardous) |
PM10 235 (Very bad Hazardous)
particulate matter (PM10) suspended dustSO2 8.4 (Good)
sulfur dioxide (SO2)PM2,5 188 (Very bad Hazardous)
particulate matter (PM2.5) dustCO 1760 (Good)
carbon monoxide (CO)NO2 83 (Moderate)
nitrogen dioxide (NO2)O3 16 (Good)
ozone (O3)ITO, New Delhi - CPCB
| index | 2022-10-31 |
|---|---|
| pm10 | 246 |
| so2 | 8.5 |
| pm25 | 200 |
| co | 1910 |
| no2 | 87 |
| o3 | 16 |
ITO, Delhi - CPCB
| index | 2020-05 | 2020-04 | 2020-03 | 2020-02 | 2020-01 | 2019-12 | 2019-11 | 2019-10 | 2019-09 | 2019-08 | 2019-07 | 2019-05 | 2019-04 | 2019-02 | 2018-12 |
|---|---|---|---|---|---|---|---|---|---|---|---|---|---|---|---|
| pm10 | 140 | 84 | 90 | 172 | 186 | 248 | 223 | 164 | 70 | 64 | 115 | 205 | 190 | 275 | 341 |
| no2 | 21 | 19 | 35 | 26 | 29 | 58 | 54 | 20 | 22 | 15 | 32 | 62 | - | 25 | 40 |
| so2 | 13 | 15 | 16 | 19 | 11 | 4.9 | 7.7 | 9.3 | 2.9 | 2.5 | 3.2 | 27 | 19 | - | 7.5 |
| co | 2 | 2 | 1 | 1 | 1 | 1 | 1 | 985 | 730 | 644 | 1 | 1 | 1 | 1 | 3 |
| o3 | 73 | 45 | 27 | 19 | 13 | 17 | 29 | 47 | 27 | 30 | 16 | 15 | - | 12 | 12 |
| pm25 | 53 | 58 | 57 | 121 | 145 | 196 | 176 | 116 | 42 | 37 | 47 | 92 | 83 | 200 | 269 |