Air Pollution in Shāhpur Jāt: Real-time Air Quality Index and smog alert.
Pollution and air quality forecast for Shāhpur Jāt. Today is Monday, March 30, 2026. The following air pollution values have been recorded for Shāhpur Jāt:- particulate matter (PM10) suspended dust - 979 (Very bad Hazardous)
- sulfur dioxide (SO2) - 24 (Good)
- particulate matter (PM2.5) dust - 275 (Very bad Hazardous)
- carbon monoxide (CO) - 1920 (Good)
- nitrogen dioxide (NO2) - 28 (Good)
- ozone (O3) - 58 (Good)

What is the air quality in Shāhpur Jāt today? Is the air polluted in Shāhpur Jāt?. Is there smog?
What is the level of PM10 today in Shāhpur Jāt? (particulate matter (PM10) suspended dust)
The current level of particulate matter PM10 in Shāhpur Jāt is:
979 (Very bad Hazardous)
The highest PM10 values usually occur in month: 517 (December 2018).
The lowest value of particulate matter PM10 pollution in Shāhpur Jāt is usually recorded in: April (101).
What is the level of SO2 pollution? (sulfur dioxide (SO2))
24 (Good)
What is the current level of PM2.5 in Shāhpur Jāt? (particulate matter (PM2.5) dust)
Today's PM2.5 level is:
275 (Very bad Hazardous)
For comparison, the highest level of PM2.5 in Shāhpur Jāt in the last 7 days was: 258 (Monday, October 31, 2022) and the lowest: 258 (Monday, October 31, 2022).
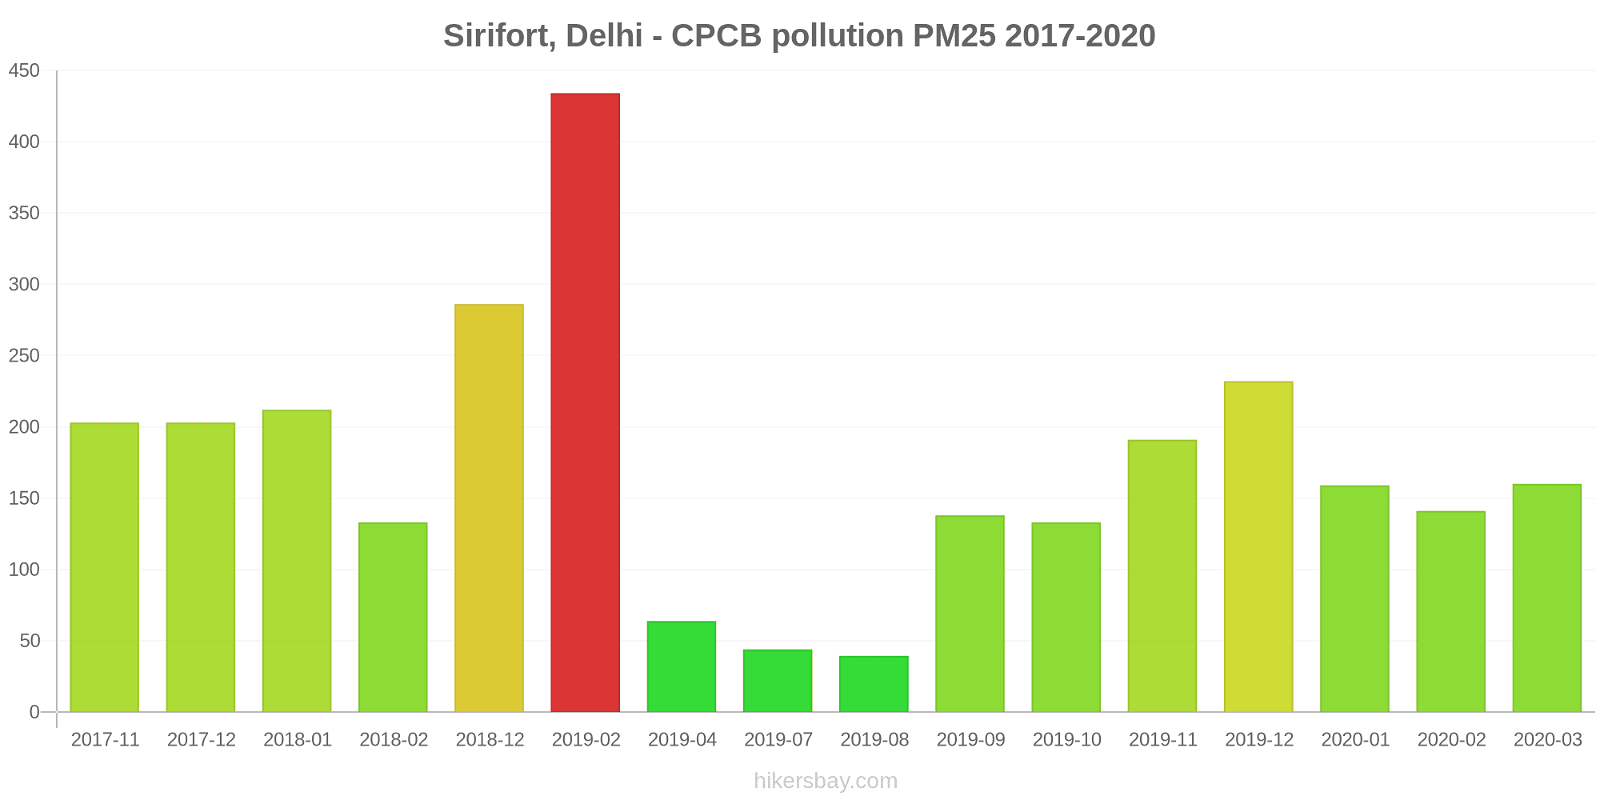
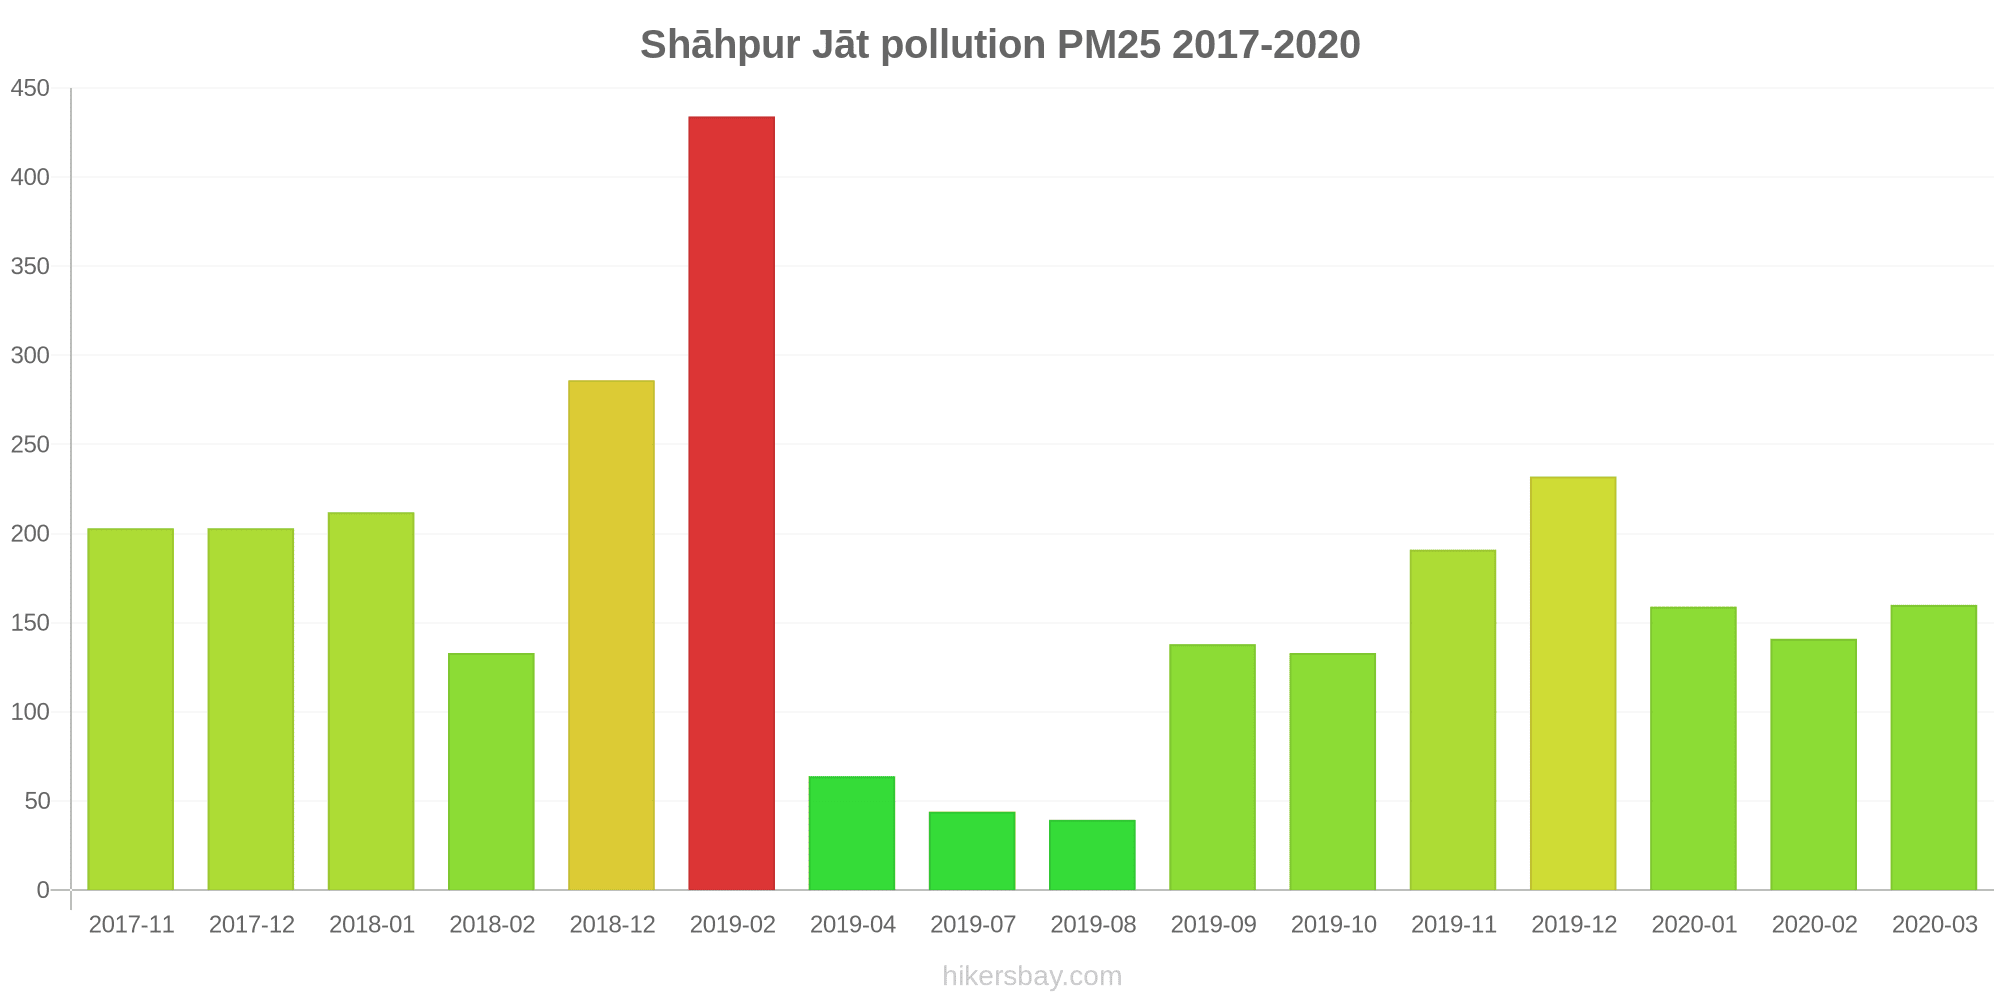
The highest PM2.5 values were recorded: 434 (February 2019).
The lowest level of particulate matter PM2.5 pollution occurs in month: August (39).
How high is the CO level? (carbon monoxide (CO))
1920 (Good)
How high is the level of NO2? (nitrogen dioxide (NO2))
28 (Good)
How is the O3 level today in Shāhpur Jāt? (ozone (O3))
58 (Good)
Current data Monday, October 31, 2022, 1:45 AM
PM10 979 (Very bad Hazardous)
SO2 24 (Good)
PM2,5 275 (Very bad Hazardous)
CO 1920 (Good)
NO2 28 (Good)
O3 58 (Good)
Data on air pollution from recent days in Shāhpur Jāt
index
2022-10-31
pm10
679
Very bad Hazardous
so2
24
Good
pm25
258
Very bad Hazardous
co
2040
Moderate
no2
19
Good
o3
59
Good
data source »
Air pollution in Shāhpur Jāt from November 2017 to May 2020

index
2020-05
2020-04
2020-03
2020-02
2020-01
2019-12
2019-11
2019-10
2019-09
2019-08
2019-07
2019-05
2019-04
2019-02
2018-12
2018-02
2018-01
2017-12
2017-11
pm10
107 (Unhealthy)
101 (Unhealthy)
159 (Very bad Hazardous)
257 (Very bad Hazardous)
247 (Very bad Hazardous)
333 (Very bad Hazardous)
332 (Very bad Hazardous)
384 (Very bad Hazardous)
252 (Very bad Hazardous)
182 (Very bad Hazardous)
186 (Very bad Hazardous)
270 (Very bad Hazardous)
307 (Very bad Hazardous)
460 (Very bad Hazardous)
517 (Very bad Hazardous)
- (Good)
- (Good)
- (Good)
- (Good)
no2
20 (Good)
15 (Good)
36 (Good)
56 (Moderate)
60 (Moderate)
60 (Moderate)
66 (Moderate)
74 (Moderate)
45 (Moderate)
41 (Moderate)
19 (Good)
- (Good)
1.4 (Good)
89 (Moderate)
53 (Moderate)
- (Good)
- (Good)
- (Good)
- (Good)
so2
7.2 (Good)
6.7 (Good)
5.7 (Good)
7.4 (Good)
9.7 (Good)
11 (Good)
11 (Good)
4.7 (Good)
6.3 (Good)
14 (Good)
13 (Good)
5.5 (Good)
8.4 (Good)
6 (Good)
21 (Good)
- (Good)
- (Good)
- (Good)
- (Good)
co
308 (Good)
383 (Good)
775 (Good)
1 (Good)
1 (Good)
1 (Good)
2 (Good)
2 (Good)
776 (Good)
1 (Good)
880 (Good)
- (Good)
602 (Good)
2 (Good)
2 (Good)
- (Good)
- (Good)
- (Good)
- (Good)
o3
85 (Moderate)
65 (Good)
159 (Unhealthy)
38 (Good)
28 (Good)
23 (Good)
35 (Good)
48 (Good)
24 (Good)
22 (Good)
13 (Good)
71 (Moderate)
51 (Good)
31 (Good)
36 (Good)
- (Good)
- (Good)
- (Good)
- (Good)
pm25
- (Good)
- (Good)
160 (Very bad Hazardous)
141 (Very bad Hazardous)
159 (Very bad Hazardous)
232 (Very bad Hazardous)
191 (Very bad Hazardous)
133 (Very bad Hazardous)
138 (Very bad Hazardous)
39 (Unhealthy for Sensitive Groups)
44 (Unhealthy for Sensitive Groups)
- (Good)
64 (Unhealthy)
434 (Very bad Hazardous)
286 (Very bad Hazardous)
133 (Very bad Hazardous)
212 (Very bad Hazardous)
203 (Very bad Hazardous)
203 (Very bad Hazardous)
data source »
Sirifort, New Delhi - CPCB
Monday, October 31, 2022, 1:45 AM
PM10 979 (Very bad Hazardous)
particulate matter (PM10) suspended dust
SO2 24 (Good)
sulfur dioxide (SO2)
PM2,5 275 (Very bad Hazardous)
particulate matter (PM2.5) dust
CO 1920 (Good)
carbon monoxide (CO)
NO2 28 (Good)
nitrogen dioxide (NO2)
O3 58 (Good)
ozone (O3)
Sirifort, New Delhi - CPCB
index
2022-10-31
pm10
679
so2
24
pm25
258
co
2040
no2
19
o3
59
Sirifort, Delhi - CPCB
2017-11 2020-05
index
2020-05
2020-04
2020-03
2020-02
2020-01
2019-12
2019-11
2019-10
2019-09
2019-08
2019-07
2019-05
2019-04
2019-02
2018-12
2018-02
2018-01
2017-12
2017-11
pm25
-
-
160
141
159
232
191
133
138
39
44
-
64
434
286
133
212
203
203
pm10
107
101
159
257
247
333
332
384
252
182
186
270
307
460
517
-
-
-
-
no2
20
15
36
56
60
60
66
74
45
41
19
-
1.4
89
53
-
-
-
-
so2
7.2
6.7
5.7
7.4
9.7
11
11
4.7
6.3
14
13
5.5
8.4
6
21
-
-
-
-
co
308
383
775
1
1
1
2
2
776
1
880
-
602
2
2
-
-
-
-
o3
85
65
159
38
28
23
35
48
24
22
13
71
51
31
36
-
-
-
-
* Pollution data source:
https://openaq.org
(caaqm)
The data is licensed under CC-By 4.0
PM10 979 (Very bad Hazardous)
SO2 24 (Good)
PM2,5 275 (Very bad Hazardous)
CO 1920 (Good)
NO2 28 (Good)
O3 58 (Good)
Data on air pollution from recent days in Shāhpur Jāt
| index | 2022-10-31 |
|---|---|
| pm10 | 679 Very bad Hazardous |
| so2 | 24 Good |
| pm25 | 258 Very bad Hazardous |
| co | 2040 Moderate |
| no2 | 19 Good |
| o3 | 59 Good |
| index | 2020-05 | 2020-04 | 2020-03 | 2020-02 | 2020-01 | 2019-12 | 2019-11 | 2019-10 | 2019-09 | 2019-08 | 2019-07 | 2019-05 | 2019-04 | 2019-02 | 2018-12 | 2018-02 | 2018-01 | 2017-12 | 2017-11 |
|---|---|---|---|---|---|---|---|---|---|---|---|---|---|---|---|---|---|---|---|
| pm10 | 107 (Unhealthy) | 101 (Unhealthy) | 159 (Very bad Hazardous) | 257 (Very bad Hazardous) | 247 (Very bad Hazardous) | 333 (Very bad Hazardous) | 332 (Very bad Hazardous) | 384 (Very bad Hazardous) | 252 (Very bad Hazardous) | 182 (Very bad Hazardous) | 186 (Very bad Hazardous) | 270 (Very bad Hazardous) | 307 (Very bad Hazardous) | 460 (Very bad Hazardous) | 517 (Very bad Hazardous) | - (Good) | - (Good) | - (Good) | - (Good) |
| no2 | 20 (Good) | 15 (Good) | 36 (Good) | 56 (Moderate) | 60 (Moderate) | 60 (Moderate) | 66 (Moderate) | 74 (Moderate) | 45 (Moderate) | 41 (Moderate) | 19 (Good) | - (Good) | 1.4 (Good) | 89 (Moderate) | 53 (Moderate) | - (Good) | - (Good) | - (Good) | - (Good) |
| so2 | 7.2 (Good) | 6.7 (Good) | 5.7 (Good) | 7.4 (Good) | 9.7 (Good) | 11 (Good) | 11 (Good) | 4.7 (Good) | 6.3 (Good) | 14 (Good) | 13 (Good) | 5.5 (Good) | 8.4 (Good) | 6 (Good) | 21 (Good) | - (Good) | - (Good) | - (Good) | - (Good) |
| co | 308 (Good) | 383 (Good) | 775 (Good) | 1 (Good) | 1 (Good) | 1 (Good) | 2 (Good) | 2 (Good) | 776 (Good) | 1 (Good) | 880 (Good) | - (Good) | 602 (Good) | 2 (Good) | 2 (Good) | - (Good) | - (Good) | - (Good) | - (Good) |
| o3 | 85 (Moderate) | 65 (Good) | 159 (Unhealthy) | 38 (Good) | 28 (Good) | 23 (Good) | 35 (Good) | 48 (Good) | 24 (Good) | 22 (Good) | 13 (Good) | 71 (Moderate) | 51 (Good) | 31 (Good) | 36 (Good) | - (Good) | - (Good) | - (Good) | - (Good) |
| pm25 | - (Good) | - (Good) | 160 (Very bad Hazardous) | 141 (Very bad Hazardous) | 159 (Very bad Hazardous) | 232 (Very bad Hazardous) | 191 (Very bad Hazardous) | 133 (Very bad Hazardous) | 138 (Very bad Hazardous) | 39 (Unhealthy for Sensitive Groups) | 44 (Unhealthy for Sensitive Groups) | - (Good) | 64 (Unhealthy) | 434 (Very bad Hazardous) | 286 (Very bad Hazardous) | 133 (Very bad Hazardous) | 212 (Very bad Hazardous) | 203 (Very bad Hazardous) | 203 (Very bad Hazardous) |
PM10 979 (Very bad Hazardous)
particulate matter (PM10) suspended dustSO2 24 (Good)
sulfur dioxide (SO2)PM2,5 275 (Very bad Hazardous)
particulate matter (PM2.5) dustCO 1920 (Good)
carbon monoxide (CO)NO2 28 (Good)
nitrogen dioxide (NO2)O3 58 (Good)
ozone (O3)Sirifort, New Delhi - CPCB
| index | 2022-10-31 |
|---|---|
| pm10 | 679 |
| so2 | 24 |
| pm25 | 258 |
| co | 2040 |
| no2 | 19 |
| o3 | 59 |
Sirifort, Delhi - CPCB

| index | 2020-05 | 2020-04 | 2020-03 | 2020-02 | 2020-01 | 2019-12 | 2019-11 | 2019-10 | 2019-09 | 2019-08 | 2019-07 | 2019-05 | 2019-04 | 2019-02 | 2018-12 | 2018-02 | 2018-01 | 2017-12 | 2017-11 |
|---|---|---|---|---|---|---|---|---|---|---|---|---|---|---|---|---|---|---|---|
| pm25 | - | - | 160 | 141 | 159 | 232 | 191 | 133 | 138 | 39 | 44 | - | 64 | 434 | 286 | 133 | 212 | 203 | 203 |
| pm10 | 107 | 101 | 159 | 257 | 247 | 333 | 332 | 384 | 252 | 182 | 186 | 270 | 307 | 460 | 517 | - | - | - | - |
| no2 | 20 | 15 | 36 | 56 | 60 | 60 | 66 | 74 | 45 | 41 | 19 | - | 1.4 | 89 | 53 | - | - | - | - |
| so2 | 7.2 | 6.7 | 5.7 | 7.4 | 9.7 | 11 | 11 | 4.7 | 6.3 | 14 | 13 | 5.5 | 8.4 | 6 | 21 | - | - | - | - |
| co | 308 | 383 | 775 | 1 | 1 | 1 | 2 | 2 | 776 | 1 | 880 | - | 602 | 2 | 2 | - | - | - | - |
| o3 | 85 | 65 | 159 | 38 | 28 | 23 | 35 | 48 | 24 | 22 | 13 | 71 | 51 | 31 | 36 | - | - | - | - |