Air Pollution in Kirtinagar: Real-time Air Quality Index and smog alert.
Pollution and air quality forecast for Kirtinagar. Today is Monday, March 30, 2026. The following air pollution values have been recorded for Kirtinagar:- nitrogen dioxide (NO2) - 37 (Good)
- carbon monoxide (CO) - 2410 (Moderate)
- particulate matter (PM10) suspended dust - 834 (Very bad Hazardous)
- ozone (O3) - 8 (Good)
- sulfur dioxide (SO2) - 10 (Good)
- particulate matter (PM2.5) dust - 139 (Very bad Hazardous)

What is the air quality in Kirtinagar today? Is the air polluted in Kirtinagar?. Is there smog?
How high is the level of NO2? (nitrogen dioxide (NO2))
37 (Good)
How high is the CO level? (carbon monoxide (CO))
2410 (Moderate)
What is the level of PM10 today in Kirtinagar? (particulate matter (PM10) suspended dust)
The current level of particulate matter PM10 in Kirtinagar is:
834 (Very bad Hazardous)
How is the O3 level today in Kirtinagar? (ozone (O3))
8 (Good)
What is the level of SO2 pollution? (sulfur dioxide (SO2))
10 (Good)
What is the current level of PM2.5 in Kirtinagar? (particulate matter (PM2.5) dust)
Today's PM2.5 level is:
139 (Very bad Hazardous)
For comparison, the highest level of PM2.5 in Kirtinagar in the last 7 days was: 149 (Monday, October 31, 2022) and the lowest: 149 (Monday, October 31, 2022).
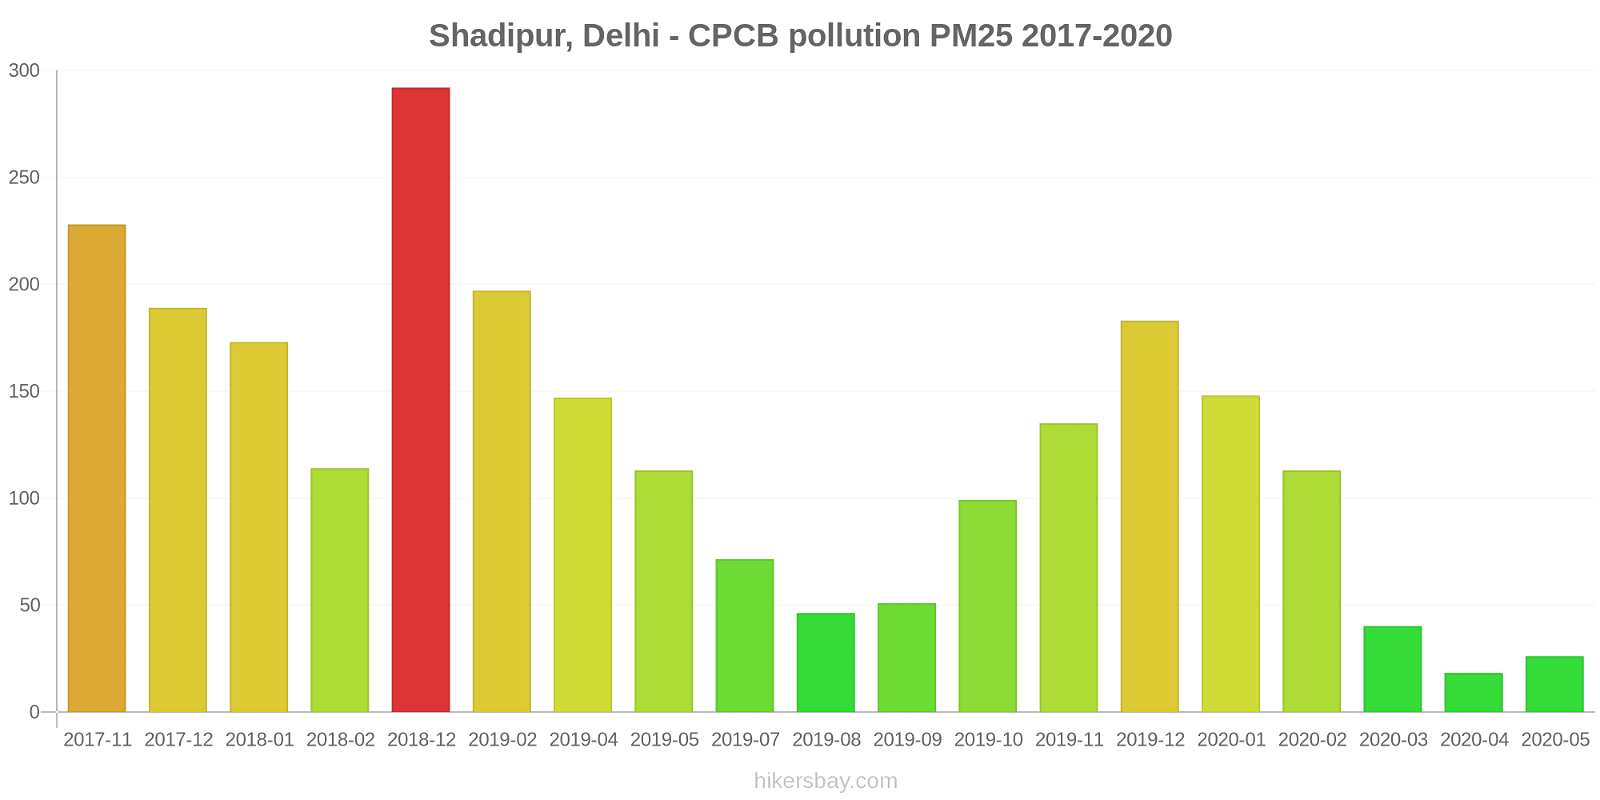
The highest PM2.5 values were recorded: 292 (December 2018).
The lowest level of particulate matter PM2.5 pollution occurs in month: April (18).
Current data Monday, October 31, 2022, 2:00 AM
NO2 37 (Good)
CO 2410 (Moderate)
PM10 834 (Very bad Hazardous)
O3 8 (Good)
SO2 10 (Good)
PM2,5 139 (Very bad Hazardous)
Data on air pollution from recent days in Kirtinagar
index
2022-10-31
no2
50
Moderate
co
2190
Moderate
pm10
709
Very bad Hazardous
o3
13
Good
so2
10
Good
pm25
149
Very bad Hazardous
data source »
Air pollution in Kirtinagar from November 2017 to May 2020

index
2020-05
2020-04
2020-03
2020-02
2020-01
2019-12
2019-11
2019-10
2019-09
2019-08
2019-07
2019-05
2019-04
2019-02
2018-12
2018-02
2018-01
2017-12
2017-11
pm25
26 (Moderate)
18 (Moderate)
40 (Unhealthy for Sensitive Groups)
113 (Very bad Hazardous)
148 (Very bad Hazardous)
183 (Very bad Hazardous)
135 (Very bad Hazardous)
99 (Very Unhealthy)
51 (Unhealthy for Sensitive Groups)
46 (Unhealthy for Sensitive Groups)
72 (Unhealthy)
113 (Very bad Hazardous)
147 (Very bad Hazardous)
197 (Very bad Hazardous)
292 (Very bad Hazardous)
114 (Very bad Hazardous)
173 (Very bad Hazardous)
189 (Very bad Hazardous)
228 (Very bad Hazardous)
no2
14 (Good)
19 (Good)
41 (Moderate)
76 (Moderate)
64 (Moderate)
65 (Moderate)
83 (Moderate)
82 (Moderate)
61 (Moderate)
32 (Good)
32 (Good)
73 (Moderate)
74 (Moderate)
83 (Moderate)
89 (Moderate)
40 (Good)
49 (Moderate)
50 (Moderate)
77 (Moderate)
so2
4.1 (Good)
7.1 (Good)
6.4 (Good)
13 (Good)
11 (Good)
12 (Good)
12 (Good)
12 (Good)
8.8 (Good)
8 (Good)
7.1 (Good)
18 (Good)
29 (Good)
7.5 (Good)
15 (Good)
15 (Good)
12 (Good)
14 (Good)
21 (Good)
co
688 (Good)
954 (Good)
899 (Good)
1 (Good)
1 (Good)
1 (Good)
1 (Good)
1 (Good)
1 (Good)
1 (Good)
1 (Good)
1 (Good)
1 (Good)
1 (Good)
2 (Good)
1 (Good)
1 (Good)
1 (Good)
2 (Good)
o3
47 (Good)
63 (Good)
49 (Good)
37 (Good)
18 (Good)
15 (Good)
32 (Good)
39 (Good)
28 (Good)
17 (Good)
13 (Good)
42 (Good)
39 (Good)
20 (Good)
25 (Good)
30 (Good)
22 (Good)
20 (Good)
17 (Good)
data source »
Shadipur, New Delhi - CPCB
Monday, October 31, 2022, 2:00 AM
NO2 37 (Good)
nitrogen dioxide (NO2)
CO 2410 (Moderate)
carbon monoxide (CO)
PM10 834 (Very bad Hazardous)
particulate matter (PM10) suspended dust
O3 8 (Good)
ozone (O3)
SO2 10 (Good)
sulfur dioxide (SO2)
PM2,5 139 (Very bad Hazardous)
particulate matter (PM2.5) dust
Shadipur, New Delhi - CPCB
index
2022-10-31
no2
50
co
2190
pm10
709
o3
13
so2
9.7
pm25
149
Shadipur, Delhi - CPCB
2017-11 2020-05
index
2020-05
2020-04
2020-03
2020-02
2020-01
2019-12
2019-11
2019-10
2019-09
2019-08
2019-07
2019-05
2019-04
2019-02
2018-12
2018-02
2018-01
2017-12
2017-11
no2
14
19
41
76
64
65
83
82
61
32
32
73
74
83
89
40
49
50
77
so2
4.1
7.1
6.4
13
11
12
12
12
8.8
8
7.1
18
29
7.5
15
15
12
14
21
co
688
954
899
1
1
1
1
1
1
1
1
1
1
1
2
1
1
1
2
o3
47
63
49
37
18
15
32
39
28
17
13
42
39
20
25
30
22
20
17
pm25
26
18
40
113
148
183
135
99
51
46
72
113
147
197
292
114
173
189
228
* Pollution data source:
https://openaq.org
(caaqm)
The data is licensed under CC-By 4.0
NO2 37 (Good)
CO 2410 (Moderate)
PM10 834 (Very bad Hazardous)
O3 8 (Good)
SO2 10 (Good)
PM2,5 139 (Very bad Hazardous)
Data on air pollution from recent days in Kirtinagar
| index | 2022-10-31 |
|---|---|
| no2 | 50 Moderate |
| co | 2190 Moderate |
| pm10 | 709 Very bad Hazardous |
| o3 | 13 Good |
| so2 | 10 Good |
| pm25 | 149 Very bad Hazardous |

| index | 2020-05 | 2020-04 | 2020-03 | 2020-02 | 2020-01 | 2019-12 | 2019-11 | 2019-10 | 2019-09 | 2019-08 | 2019-07 | 2019-05 | 2019-04 | 2019-02 | 2018-12 | 2018-02 | 2018-01 | 2017-12 | 2017-11 |
|---|---|---|---|---|---|---|---|---|---|---|---|---|---|---|---|---|---|---|---|
| pm25 | 26 (Moderate) | 18 (Moderate) | 40 (Unhealthy for Sensitive Groups) | 113 (Very bad Hazardous) | 148 (Very bad Hazardous) | 183 (Very bad Hazardous) | 135 (Very bad Hazardous) | 99 (Very Unhealthy) | 51 (Unhealthy for Sensitive Groups) | 46 (Unhealthy for Sensitive Groups) | 72 (Unhealthy) | 113 (Very bad Hazardous) | 147 (Very bad Hazardous) | 197 (Very bad Hazardous) | 292 (Very bad Hazardous) | 114 (Very bad Hazardous) | 173 (Very bad Hazardous) | 189 (Very bad Hazardous) | 228 (Very bad Hazardous) |
| no2 | 14 (Good) | 19 (Good) | 41 (Moderate) | 76 (Moderate) | 64 (Moderate) | 65 (Moderate) | 83 (Moderate) | 82 (Moderate) | 61 (Moderate) | 32 (Good) | 32 (Good) | 73 (Moderate) | 74 (Moderate) | 83 (Moderate) | 89 (Moderate) | 40 (Good) | 49 (Moderate) | 50 (Moderate) | 77 (Moderate) |
| so2 | 4.1 (Good) | 7.1 (Good) | 6.4 (Good) | 13 (Good) | 11 (Good) | 12 (Good) | 12 (Good) | 12 (Good) | 8.8 (Good) | 8 (Good) | 7.1 (Good) | 18 (Good) | 29 (Good) | 7.5 (Good) | 15 (Good) | 15 (Good) | 12 (Good) | 14 (Good) | 21 (Good) |
| co | 688 (Good) | 954 (Good) | 899 (Good) | 1 (Good) | 1 (Good) | 1 (Good) | 1 (Good) | 1 (Good) | 1 (Good) | 1 (Good) | 1 (Good) | 1 (Good) | 1 (Good) | 1 (Good) | 2 (Good) | 1 (Good) | 1 (Good) | 1 (Good) | 2 (Good) |
| o3 | 47 (Good) | 63 (Good) | 49 (Good) | 37 (Good) | 18 (Good) | 15 (Good) | 32 (Good) | 39 (Good) | 28 (Good) | 17 (Good) | 13 (Good) | 42 (Good) | 39 (Good) | 20 (Good) | 25 (Good) | 30 (Good) | 22 (Good) | 20 (Good) | 17 (Good) |
NO2 37 (Good)
nitrogen dioxide (NO2)CO 2410 (Moderate)
carbon monoxide (CO)PM10 834 (Very bad Hazardous)
particulate matter (PM10) suspended dustO3 8 (Good)
ozone (O3)SO2 10 (Good)
sulfur dioxide (SO2)PM2,5 139 (Very bad Hazardous)
particulate matter (PM2.5) dustShadipur, New Delhi - CPCB
| index | 2022-10-31 |
|---|---|
| no2 | 50 |
| co | 2190 |
| pm10 | 709 |
| o3 | 13 |
| so2 | 9.7 |
| pm25 | 149 |
Shadipur, Delhi - CPCB

| index | 2020-05 | 2020-04 | 2020-03 | 2020-02 | 2020-01 | 2019-12 | 2019-11 | 2019-10 | 2019-09 | 2019-08 | 2019-07 | 2019-05 | 2019-04 | 2019-02 | 2018-12 | 2018-02 | 2018-01 | 2017-12 | 2017-11 |
|---|---|---|---|---|---|---|---|---|---|---|---|---|---|---|---|---|---|---|---|
| no2 | 14 | 19 | 41 | 76 | 64 | 65 | 83 | 82 | 61 | 32 | 32 | 73 | 74 | 83 | 89 | 40 | 49 | 50 | 77 |
| so2 | 4.1 | 7.1 | 6.4 | 13 | 11 | 12 | 12 | 12 | 8.8 | 8 | 7.1 | 18 | 29 | 7.5 | 15 | 15 | 12 | 14 | 21 |
| co | 688 | 954 | 899 | 1 | 1 | 1 | 1 | 1 | 1 | 1 | 1 | 1 | 1 | 1 | 2 | 1 | 1 | 1 | 2 |
| o3 | 47 | 63 | 49 | 37 | 18 | 15 | 32 | 39 | 28 | 17 | 13 | 42 | 39 | 20 | 25 | 30 | 22 | 20 | 17 |
| pm25 | 26 | 18 | 40 | 113 | 148 | 183 | 135 | 99 | 51 | 46 | 72 | 113 | 147 | 197 | 292 | 114 | 173 | 189 | 228 |