Air Pollution in Bhālswa Jahangirpur: Real-time Air Quality Index and smog alert.
Pollution and air quality forecast for Bhālswa Jahangirpur. Today is Wednesday, May 13, 2026. The following air pollution values have been recorded for Bhālswa Jahangirpur:- particulate matter (PM2.5) dust - 250 (Very bad Hazardous)
- particulate matter (PM10) suspended dust - 399 (Very bad Hazardous)
- nitrogen dioxide (NO2) - 83 (Moderate)
- sulfur dioxide (SO2) - 13 (Good)
- carbon monoxide (CO) - 700 (Good)
- ozone (O3) - 1 (Good)

What is the air quality in Bhālswa Jahangirpur today? Is the air polluted in Bhālswa Jahangirpur?. Is there smog?
What is the current level of PM2.5 in Bhālswa Jahangirpur? (particulate matter (PM2.5) dust)
Today's PM2.5 level is:
250 (Very bad Hazardous)
For comparison, the highest level of PM2.5 in Bhālswa Jahangirpur in the last 7 days was: 250 (Monday, October 31, 2022) and the lowest: 250 (Monday, October 31, 2022).
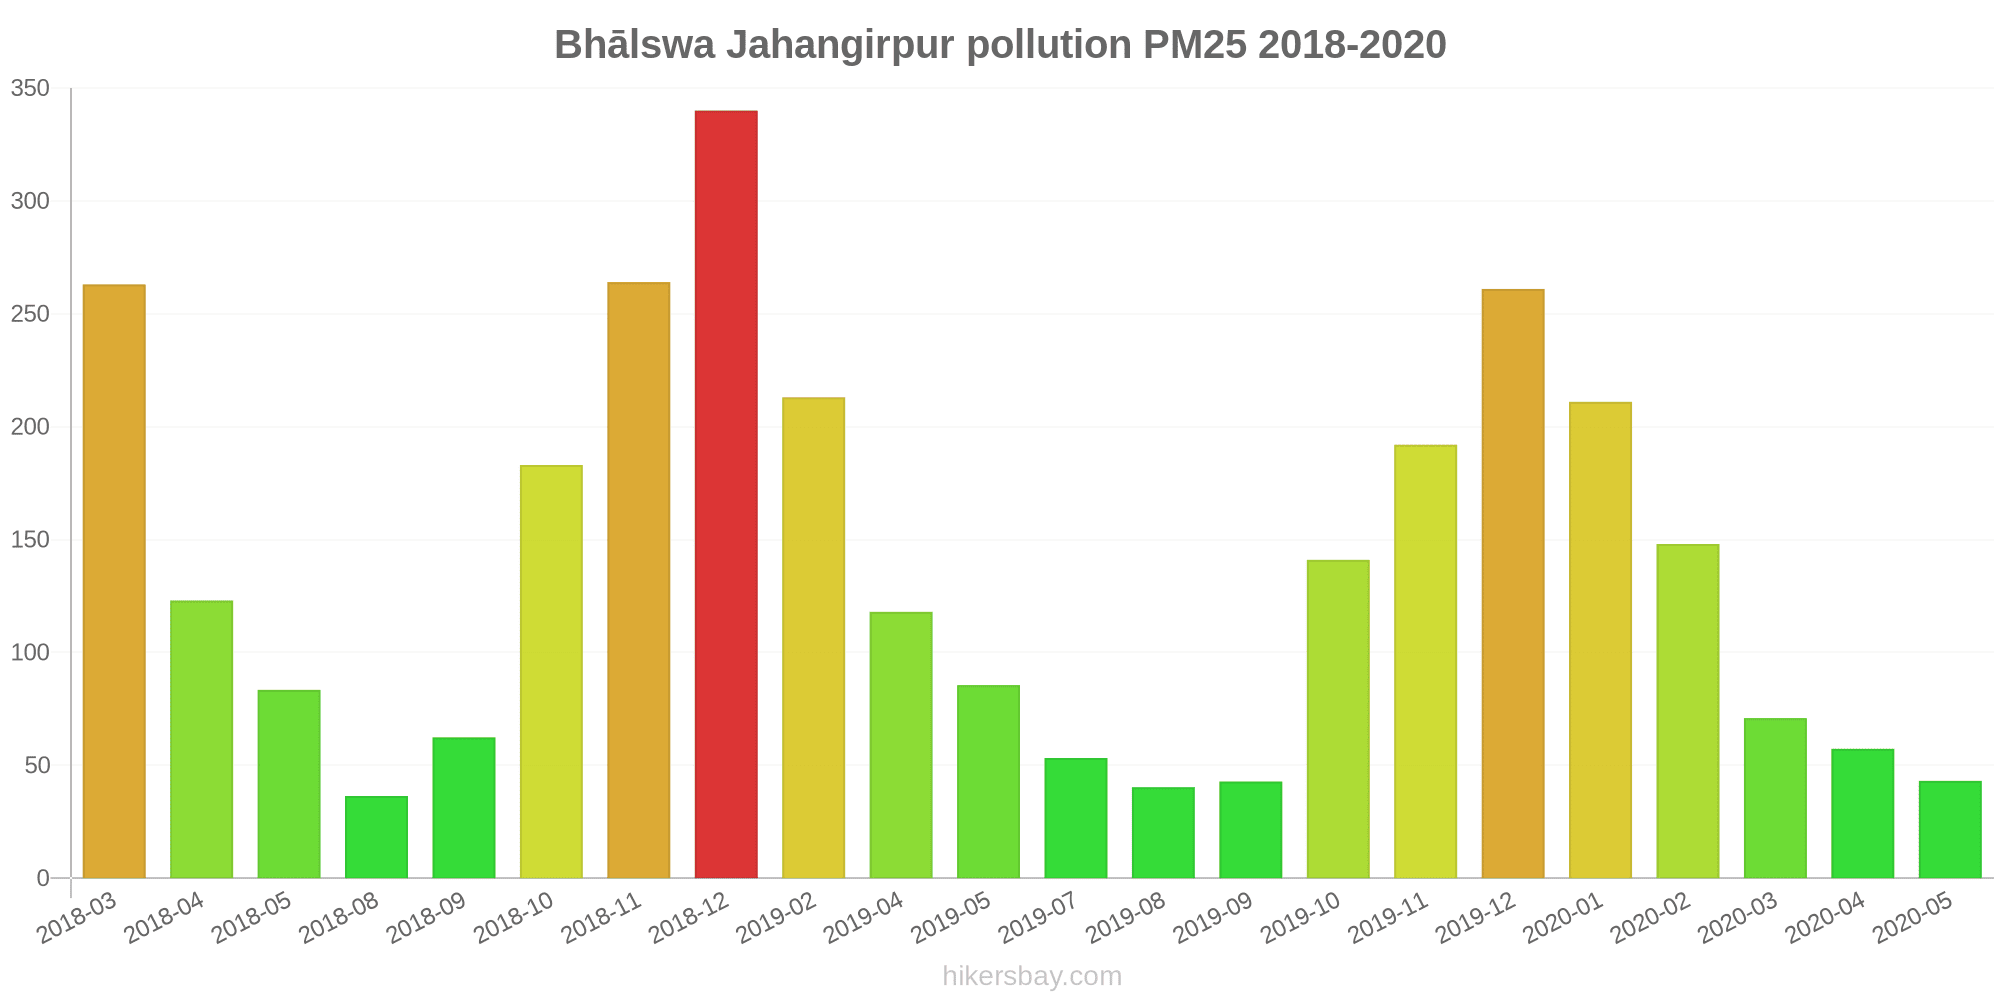
The highest PM2.5 values were recorded: 340 (December 2018).
The lowest level of particulate matter PM2.5 pollution occurs in month: August (36).
What is the level of PM10 today in Bhālswa Jahangirpur? (particulate matter (PM10) suspended dust)
The current level of particulate matter PM10 in Bhālswa Jahangirpur is:
399 (Very bad Hazardous)
The highest PM10 values usually occur in month: 544 (December 2018).
The lowest value of particulate matter PM10 pollution in Bhālswa Jahangirpur is usually recorded in: August (96).
How high is the level of NO2? (nitrogen dioxide (NO2))
83 (Moderate)
What is the level of SO2 pollution? (sulfur dioxide (SO2))
13 (Good)
How high is the CO level? (carbon monoxide (CO))
700 (Good)
How is the O3 level today in Bhālswa Jahangirpur? (ozone (O3))
1 (Good)
Current data Monday, October 31, 2022, 12:45 AM
PM2,5 250 (Very bad Hazardous)
PM10 399 (Very bad Hazardous)
NO2 83 (Moderate)
SO2 13 (Good)
CO 700 (Good)
O3 1 (Good)
Data on air pollution from recent days in Bhālswa Jahangirpur
index
2022-10-30
2022-10-31
o3
1
Good
-
Good
pm25
-
Good
250
Very bad Hazardous
pm10
-
Good
399
Very bad Hazardous
no2
-
Good
83
Moderate
so2
-
Good
13
Good
co
-
Good
700
Good
data source »
Air pollution in Bhālswa Jahangirpur from March 2018 to May 2020

index
2020-05
2020-04
2020-03
2020-02
2020-01
2019-12
2019-11
2019-10
2019-09
2019-08
2019-07
2019-05
2019-04
2019-02
2018-12
2018-11
2018-10
2018-09
2018-08
2018-05
2018-04
2018-03
pm25
43 (Unhealthy for Sensitive Groups)
57 (Unhealthy)
71 (Unhealthy)
148 (Very bad Hazardous)
211 (Very bad Hazardous)
261 (Very bad Hazardous)
192 (Very bad Hazardous)
141 (Very bad Hazardous)
43 (Unhealthy for Sensitive Groups)
40 (Unhealthy for Sensitive Groups)
53 (Unhealthy for Sensitive Groups)
86 (Very Unhealthy)
118 (Very bad Hazardous)
213 (Very bad Hazardous)
340 (Very bad Hazardous)
264 (Very bad Hazardous)
183 (Very bad Hazardous)
62 (Unhealthy)
36 (Unhealthy for Sensitive Groups)
83 (Very Unhealthy)
123 (Very bad Hazardous)
263 (Very bad Hazardous)
pm10
106 (Unhealthy)
132 (Very Unhealthy)
162 (Very bad Hazardous)
266 (Very bad Hazardous)
315 (Very bad Hazardous)
395 (Very bad Hazardous)
325 (Very bad Hazardous)
273 (Very bad Hazardous)
102 (Unhealthy)
96 (Unhealthy)
130 (Very Unhealthy)
229 (Very bad Hazardous)
357 (Very bad Hazardous)
377 (Very bad Hazardous)
544 (Very bad Hazardous)
407 (Very bad Hazardous)
363 (Very bad Hazardous)
147 (Very Unhealthy)
106 (Unhealthy)
244 (Very bad Hazardous)
275 (Very bad Hazardous)
265 (Very bad Hazardous)
no2
44 (Moderate)
70 (Moderate)
76 (Moderate)
139 (Unhealthy for Sensitive Groups)
164 (Unhealthy)
174 (Unhealthy)
99 (Moderate)
71 (Moderate)
35 (Good)
32 (Good)
33 (Good)
48 (Moderate)
59 (Moderate)
79 (Moderate)
71 (Moderate)
54 (Moderate)
57 (Moderate)
30 (Good)
31 (Good)
63 (Moderate)
52 (Moderate)
81 (Moderate)
so2
1.6 (Good)
1.1 (Good)
2.4 (Good)
7.7 (Good)
8.8 (Good)
8.4 (Good)
14 (Good)
18 (Good)
17 (Good)
13 (Good)
13 (Good)
24 (Good)
30 (Good)
20 (Good)
22 (Good)
7.8 (Good)
18 (Good)
11 (Good)
9.7 (Good)
22 (Good)
24 (Good)
33 (Good)
co
804 (Good)
941 (Good)
894 (Good)
1 (Good)
1 (Good)
1 (Good)
1 (Good)
1 (Good)
1 (Good)
1 (Good)
1 (Good)
1 (Good)
1 (Good)
2 (Good)
2 (Good)
2 (Good)
2 (Good)
1 (Good)
1 (Good)
1 (Good)
34 (Good)
69 (Good)
o3
7.8 (Good)
6.2 (Good)
6.8 (Good)
5.4 (Good)
3.6 (Good)
12 (Good)
15 (Good)
59 (Good)
41 (Good)
28 (Good)
28 (Good)
61 (Good)
48 (Good)
50 (Good)
18 (Good)
9.3 (Good)
41 (Good)
24 (Good)
16 (Good)
56 (Good)
52 (Good)
20 (Good)
data source »
Jahangirpuri, Delhi - DPCC
Monday, October 31, 2022, 12:45 AM
PM2,5 250 (Very bad Hazardous)
particulate matter (PM2.5) dust
PM10 399 (Very bad Hazardous)
particulate matter (PM10) suspended dust
NO2 83 (Moderate)
nitrogen dioxide (NO2)
SO2 13 (Good)
sulfur dioxide (SO2)
CO 700 (Good)
carbon monoxide (CO)
O3 0.5 (Good)
ozone (O3)
Jahangirpuri, Delhi - DPCC
index
2022-10-31
2022-10-30
o3
-
0.5
pm25
250
-
pm10
399
-
no2
83
-
so2
13
-
co
700
-
Jahangirpuri, Delhi - DPCC
2018-03 2020-05

index
2020-05
2020-04
2020-03
2020-02
2020-01
2019-12
2019-11
2019-10
2019-09
2019-08
2019-07
2019-05
2019-04
2019-02
2018-12
2018-11
2018-10
2018-09
2018-08
2018-05
2018-04
2018-03
pm25
43
57
71
148
211
261
192
141
43
40
53
86
118
213
340
264
183
62
36
83
123
263
pm10
106
132
162
266
315
395
325
273
102
96
130
229
357
377
544
407
363
147
106
244
275
265
no2
44
70
76
139
164
174
99
71
35
32
33
48
59
79
71
54
57
30
31
63
52
81
so2
1.6
1.1
2.4
7.7
8.8
8.4
14
18
17
13
13
24
30
20
22
7.8
18
11
9.7
22
24
33
co
804
941
894
1
1
1
1
1
1
1
1
1
1
2
2
2
2
1
1
1
34
69
o3
7.8
6.2
6.8
5.4
3.6
12
15
59
41
28
28
61
48
50
18
9.3
41
24
16
56
52
20
* Pollution data source:
https://openaq.org
(caaqm)
The data is licensed under CC-By 4.0
PM2,5 250 (Very bad Hazardous)
PM10 399 (Very bad Hazardous)
NO2 83 (Moderate)
SO2 13 (Good)
CO 700 (Good)
O3 1 (Good)
Data on air pollution from recent days in Bhālswa Jahangirpur
| index | 2022-10-30 | 2022-10-31 |
|---|---|---|
| o3 | 1 Good |
- Good |
| pm25 | - Good |
250 Very bad Hazardous |
| pm10 | - Good |
399 Very bad Hazardous |
| no2 | - Good |
83 Moderate |
| so2 | - Good |
13 Good |
| co | - Good |
700 Good |
| index | 2020-05 | 2020-04 | 2020-03 | 2020-02 | 2020-01 | 2019-12 | 2019-11 | 2019-10 | 2019-09 | 2019-08 | 2019-07 | 2019-05 | 2019-04 | 2019-02 | 2018-12 | 2018-11 | 2018-10 | 2018-09 | 2018-08 | 2018-05 | 2018-04 | 2018-03 |
|---|---|---|---|---|---|---|---|---|---|---|---|---|---|---|---|---|---|---|---|---|---|---|
| pm25 | 43 (Unhealthy for Sensitive Groups) | 57 (Unhealthy) | 71 (Unhealthy) | 148 (Very bad Hazardous) | 211 (Very bad Hazardous) | 261 (Very bad Hazardous) | 192 (Very bad Hazardous) | 141 (Very bad Hazardous) | 43 (Unhealthy for Sensitive Groups) | 40 (Unhealthy for Sensitive Groups) | 53 (Unhealthy for Sensitive Groups) | 86 (Very Unhealthy) | 118 (Very bad Hazardous) | 213 (Very bad Hazardous) | 340 (Very bad Hazardous) | 264 (Very bad Hazardous) | 183 (Very bad Hazardous) | 62 (Unhealthy) | 36 (Unhealthy for Sensitive Groups) | 83 (Very Unhealthy) | 123 (Very bad Hazardous) | 263 (Very bad Hazardous) |
| pm10 | 106 (Unhealthy) | 132 (Very Unhealthy) | 162 (Very bad Hazardous) | 266 (Very bad Hazardous) | 315 (Very bad Hazardous) | 395 (Very bad Hazardous) | 325 (Very bad Hazardous) | 273 (Very bad Hazardous) | 102 (Unhealthy) | 96 (Unhealthy) | 130 (Very Unhealthy) | 229 (Very bad Hazardous) | 357 (Very bad Hazardous) | 377 (Very bad Hazardous) | 544 (Very bad Hazardous) | 407 (Very bad Hazardous) | 363 (Very bad Hazardous) | 147 (Very Unhealthy) | 106 (Unhealthy) | 244 (Very bad Hazardous) | 275 (Very bad Hazardous) | 265 (Very bad Hazardous) |
| no2 | 44 (Moderate) | 70 (Moderate) | 76 (Moderate) | 139 (Unhealthy for Sensitive Groups) | 164 (Unhealthy) | 174 (Unhealthy) | 99 (Moderate) | 71 (Moderate) | 35 (Good) | 32 (Good) | 33 (Good) | 48 (Moderate) | 59 (Moderate) | 79 (Moderate) | 71 (Moderate) | 54 (Moderate) | 57 (Moderate) | 30 (Good) | 31 (Good) | 63 (Moderate) | 52 (Moderate) | 81 (Moderate) |
| so2 | 1.6 (Good) | 1.1 (Good) | 2.4 (Good) | 7.7 (Good) | 8.8 (Good) | 8.4 (Good) | 14 (Good) | 18 (Good) | 17 (Good) | 13 (Good) | 13 (Good) | 24 (Good) | 30 (Good) | 20 (Good) | 22 (Good) | 7.8 (Good) | 18 (Good) | 11 (Good) | 9.7 (Good) | 22 (Good) | 24 (Good) | 33 (Good) |
| co | 804 (Good) | 941 (Good) | 894 (Good) | 1 (Good) | 1 (Good) | 1 (Good) | 1 (Good) | 1 (Good) | 1 (Good) | 1 (Good) | 1 (Good) | 1 (Good) | 1 (Good) | 2 (Good) | 2 (Good) | 2 (Good) | 2 (Good) | 1 (Good) | 1 (Good) | 1 (Good) | 34 (Good) | 69 (Good) |
| o3 | 7.8 (Good) | 6.2 (Good) | 6.8 (Good) | 5.4 (Good) | 3.6 (Good) | 12 (Good) | 15 (Good) | 59 (Good) | 41 (Good) | 28 (Good) | 28 (Good) | 61 (Good) | 48 (Good) | 50 (Good) | 18 (Good) | 9.3 (Good) | 41 (Good) | 24 (Good) | 16 (Good) | 56 (Good) | 52 (Good) | 20 (Good) |
PM2,5 250 (Very bad Hazardous)
particulate matter (PM2.5) dustPM10 399 (Very bad Hazardous)
particulate matter (PM10) suspended dustNO2 83 (Moderate)
nitrogen dioxide (NO2)SO2 13 (Good)
sulfur dioxide (SO2)CO 700 (Good)
carbon monoxide (CO)O3 0.5 (Good)
ozone (O3)Jahangirpuri, Delhi - DPCC
| index | 2022-10-31 | 2022-10-30 |
|---|---|---|
| o3 | - | 0.5 |
| pm25 | 250 | - |
| pm10 | 399 | - |
| no2 | 83 | - |
| so2 | 13 | - |
| co | 700 | - |
Jahangirpuri, Delhi - DPCC
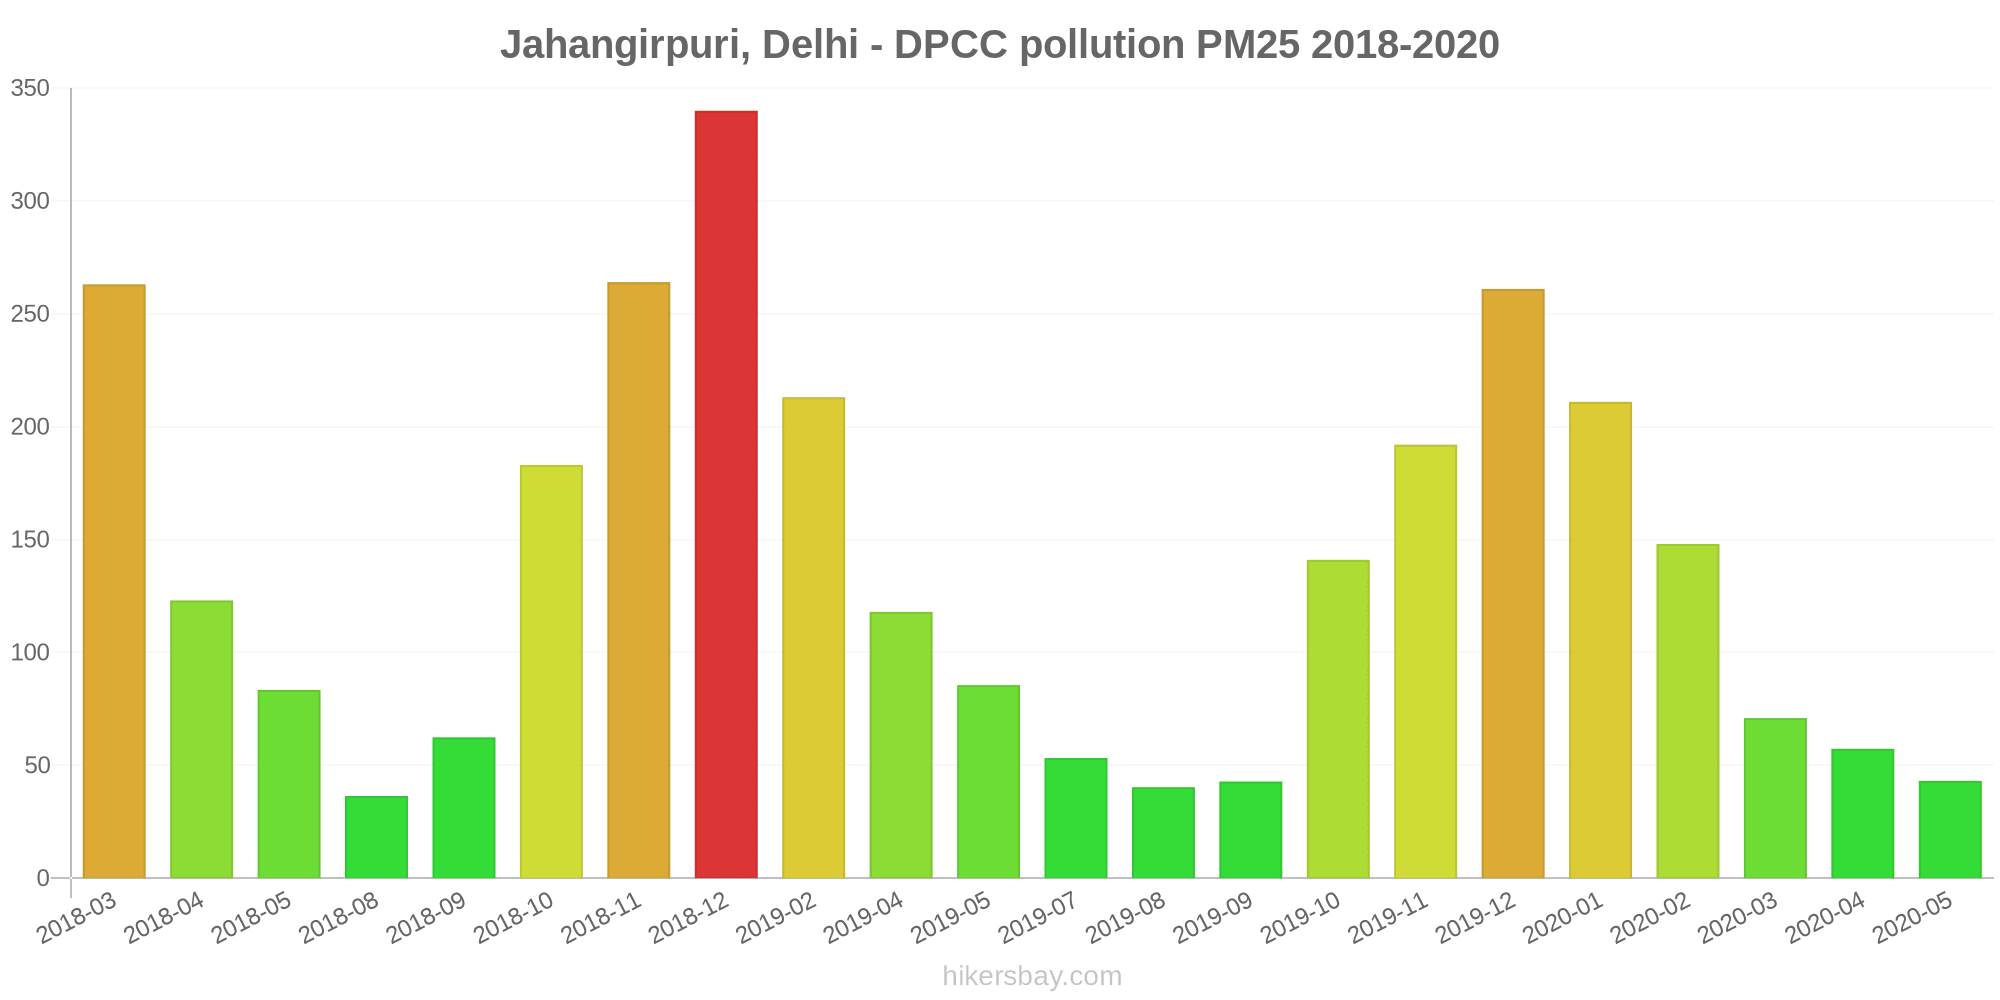
| index | 2020-05 | 2020-04 | 2020-03 | 2020-02 | 2020-01 | 2019-12 | 2019-11 | 2019-10 | 2019-09 | 2019-08 | 2019-07 | 2019-05 | 2019-04 | 2019-02 | 2018-12 | 2018-11 | 2018-10 | 2018-09 | 2018-08 | 2018-05 | 2018-04 | 2018-03 |
|---|---|---|---|---|---|---|---|---|---|---|---|---|---|---|---|---|---|---|---|---|---|---|
| pm25 | 43 | 57 | 71 | 148 | 211 | 261 | 192 | 141 | 43 | 40 | 53 | 86 | 118 | 213 | 340 | 264 | 183 | 62 | 36 | 83 | 123 | 263 |
| pm10 | 106 | 132 | 162 | 266 | 315 | 395 | 325 | 273 | 102 | 96 | 130 | 229 | 357 | 377 | 544 | 407 | 363 | 147 | 106 | 244 | 275 | 265 |
| no2 | 44 | 70 | 76 | 139 | 164 | 174 | 99 | 71 | 35 | 32 | 33 | 48 | 59 | 79 | 71 | 54 | 57 | 30 | 31 | 63 | 52 | 81 |
| so2 | 1.6 | 1.1 | 2.4 | 7.7 | 8.8 | 8.4 | 14 | 18 | 17 | 13 | 13 | 24 | 30 | 20 | 22 | 7.8 | 18 | 11 | 9.7 | 22 | 24 | 33 |
| co | 804 | 941 | 894 | 1 | 1 | 1 | 1 | 1 | 1 | 1 | 1 | 1 | 1 | 2 | 2 | 2 | 2 | 1 | 1 | 1 | 34 | 69 |
| o3 | 7.8 | 6.2 | 6.8 | 5.4 | 3.6 | 12 | 15 | 59 | 41 | 28 | 28 | 61 | 48 | 50 | 18 | 9.3 | 41 | 24 | 16 | 56 | 52 | 20 |