Air Pollution in Alumgirpur: Real-time Air Quality Index and smog alert.
Pollution and air quality forecast for Alumgirpur. Today is Thursday, May 14, 2026. The following air pollution values have been recorded for Alumgirpur:- particulate matter (PM2.5) dust - 238 (Very bad Hazardous)
- particulate matter (PM10) suspended dust - 345 (Very bad Hazardous)
- ozone (O3) - 3 (Good)
- nitrogen dioxide (NO2) - 34 (Good)
- sulfur dioxide (SO2) - 1 (Good)
- carbon monoxide (CO) - 7000 (Unhealthy for Sensitive Groups)

What is the air quality in Alumgirpur today? Is the air polluted in Alumgirpur?. Is there smog?
What is the current level of PM2.5 in Alumgirpur? (particulate matter (PM2.5) dust)
Today's PM2.5 level is:
238 (Very bad Hazardous)
For comparison, the highest level of PM2.5 in Alumgirpur in the last 7 days was: 238 (Monday, October 31, 2022) and the lowest: 238 (Monday, October 31, 2022).
The highest PM2.5 values were recorded: 348 (November 2017).
The lowest level of particulate matter PM2.5 pollution occurs in month: August (37).
What is the level of PM10 today in Alumgirpur? (particulate matter (PM10) suspended dust)
The current level of particulate matter PM10 in Alumgirpur is:
345 (Very bad Hazardous)
The highest PM10 values usually occur in month: 495 (December 2018).
The lowest value of particulate matter PM10 pollution in Alumgirpur is usually recorded in: August (90).
How is the O3 level today in Alumgirpur? (ozone (O3))
3 (Good)
How high is the level of NO2? (nitrogen dioxide (NO2))
34 (Good)
What is the level of SO2 pollution? (sulfur dioxide (SO2))
1 (Good)
How high is the CO level? (carbon monoxide (CO))
7000 (Unhealthy for Sensitive Groups)
Current data Monday, October 31, 2022, 12:45 AM
PM2,5 238 (Very bad Hazardous)
PM10 345 (Very bad Hazardous)
O3 3 (Good)
NO2 34 (Good)
SO2 1 (Good)
CO 7000 (Unhealthy for Sensitive Groups)
Data on air pollution from recent days in Alumgirpur
index
2022-10-30
2022-10-31
co
7000
Unhealthy for Sensitive Groups
-
Good
pm25
-
Good
238
Very bad Hazardous
pm10
-
Good
345
Very bad Hazardous
o3
-
Good
3
Good
no2
-
Good
34
Good
so2
-
Good
1
Good
data source »
Air pollution in Alumgirpur from March 2018 to November 2017
index
2017-11
2017-10
2017-09
2017-08
2017-07
2017-06
2017-05
2017-04
2017-03
2017-02
2016-12
2016-11
2020-05
2020-04
2020-03
2020-02
2020-01
2019-12
2019-11
2019-10
2019-09
2019-08
2019-07
2019-05
2019-04
2019-02
2018-12
2018-11
2018-10
2018-09
2018-08
2018-05
2018-04
2018-03
no2
29 (Good)
16 (Good)
15 (Good)
7 (Good)
11 (Good)
23 (Good)
60 (Moderate)
88 (Moderate)
26 (Good)
24 (Good)
53 (Moderate)
169 (Unhealthy)
8.7 (Good)
10 (Good)
20 (Good)
28 (Good)
24 (Good)
25 (Good)
29 (Good)
26 (Good)
12 (Good)
17 (Good)
18 (Good)
48 (Moderate)
55 (Moderate)
63 (Moderate)
63 (Moderate)
68 (Moderate)
56 (Moderate)
19 (Good)
20 (Good)
- (Good)
25 (Good)
34 (Good)
pm25
348 (Very bad Hazardous)
196 (Very bad Hazardous)
61 (Unhealthy)
37 (Unhealthy for Sensitive Groups)
44 (Unhealthy for Sensitive Groups)
67 (Unhealthy)
117 (Very bad Hazardous)
106 (Very Unhealthy)
115 (Very bad Hazardous)
136 (Very bad Hazardous)
287 (Very bad Hazardous)
341 (Very bad Hazardous)
51 (Unhealthy for Sensitive Groups)
65 (Unhealthy)
77 (Very Unhealthy)
165 (Very bad Hazardous)
191 (Very bad Hazardous)
261 (Very bad Hazardous)
225 (Very bad Hazardous)
148 (Very bad Hazardous)
116 (Very bad Hazardous)
48 (Unhealthy for Sensitive Groups)
45 (Unhealthy for Sensitive Groups)
73 (Unhealthy)
84 (Very Unhealthy)
222 (Very bad Hazardous)
342 (Very bad Hazardous)
241 (Very bad Hazardous)
186 (Very bad Hazardous)
54 (Unhealthy for Sensitive Groups)
42 (Unhealthy for Sensitive Groups)
81 (Very Unhealthy)
126 (Very bad Hazardous)
179 (Very bad Hazardous)
pm10
- (Good)
- (Good)
- (Good)
- (Good)
- (Good)
- (Good)
- (Good)
- (Good)
- (Good)
- (Good)
- (Good)
- (Good)
129 (Very Unhealthy)
143 (Very Unhealthy)
145 (Very Unhealthy)
261 (Very bad Hazardous)
268 (Very bad Hazardous)
363 (Very bad Hazardous)
316 (Very bad Hazardous)
270 (Very bad Hazardous)
123 (Very Unhealthy)
90 (Unhealthy)
141 (Very Unhealthy)
242 (Very bad Hazardous)
327 (Very bad Hazardous)
363 (Very bad Hazardous)
495 (Very bad Hazardous)
376 (Very bad Hazardous)
399 (Very bad Hazardous)
125 (Very Unhealthy)
101 (Unhealthy)
275 (Very bad Hazardous)
301 (Very bad Hazardous)
263 (Very bad Hazardous)
so2
- (Good)
- (Good)
- (Good)
- (Good)
- (Good)
- (Good)
- (Good)
- (Good)
- (Good)
- (Good)
- (Good)
- (Good)
9.3 (Good)
12 (Good)
11 (Good)
10 (Good)
5 (Good)
3.9 (Good)
5.6 (Good)
6 (Good)
4.3 (Good)
3.6 (Good)
3.1 (Good)
24 (Good)
27 (Good)
25 (Good)
22 (Good)
23 (Good)
23 (Good)
13 (Good)
13 (Good)
- (Good)
9.3 (Good)
17 (Good)
co
- (Good)
- (Good)
- (Good)
- (Good)
- (Good)
- (Good)
- (Good)
- (Good)
- (Good)
- (Good)
- (Good)
- (Good)
471 (Good)
457 (Good)
733 (Good)
1 (Good)
1 (Good)
1 (Good)
1 (Good)
1 (Good)
898 (Good)
1 (Good)
1 (Good)
1 (Good)
1 (Good)
3 (Good)
2 (Good)
2 (Good)
2 (Good)
934 (Good)
834 (Good)
- (Good)
35 (Good)
57 (Good)
o3
- (Good)
- (Good)
- (Good)
- (Good)
- (Good)
- (Good)
- (Good)
- (Good)
- (Good)
- (Good)
- (Good)
- (Good)
28 (Good)
21 (Good)
17 (Good)
21 (Good)
13 (Good)
13 (Good)
14 (Good)
28 (Good)
20 (Good)
15 (Good)
20 (Good)
66 (Good)
70 (Moderate)
57 (Good)
24 (Good)
37 (Good)
34 (Good)
18 (Good)
18 (Good)
- (Good)
80 (Moderate)
47 (Good)
data source »
Rohini, Delhi - DPCC
Monday, October 31, 2022, 12:45 AM
PM2,5 238 (Very bad Hazardous)
particulate matter (PM2.5) dust
PM10 345 (Very bad Hazardous)
particulate matter (PM10) suspended dust
O3 3 (Good)
ozone (O3)
NO2 34 (Good)
nitrogen dioxide (NO2)
SO2 0.5 (Good)
sulfur dioxide (SO2)
CO 7000 (Unhealthy for Sensitive Groups)
carbon monoxide (CO)
Rohini, Delhi - DPCC
index
2022-10-31
2022-10-30
co
-
7000
pm25
238
-
pm10
345
-
o3
3
-
no2
34
-
so2
0.5
-
Delhi Technological University
2016-11 2017-11

index
2017-11
2017-10
2017-09
2017-08
2017-07
2017-06
2017-05
2017-04
2017-03
2017-02
2016-12
2016-11
pm25
348
196
61
37
44
67
117
106
115
136
287
341
no2
29
16
15
7
11
23
60
88
26
24
53
169
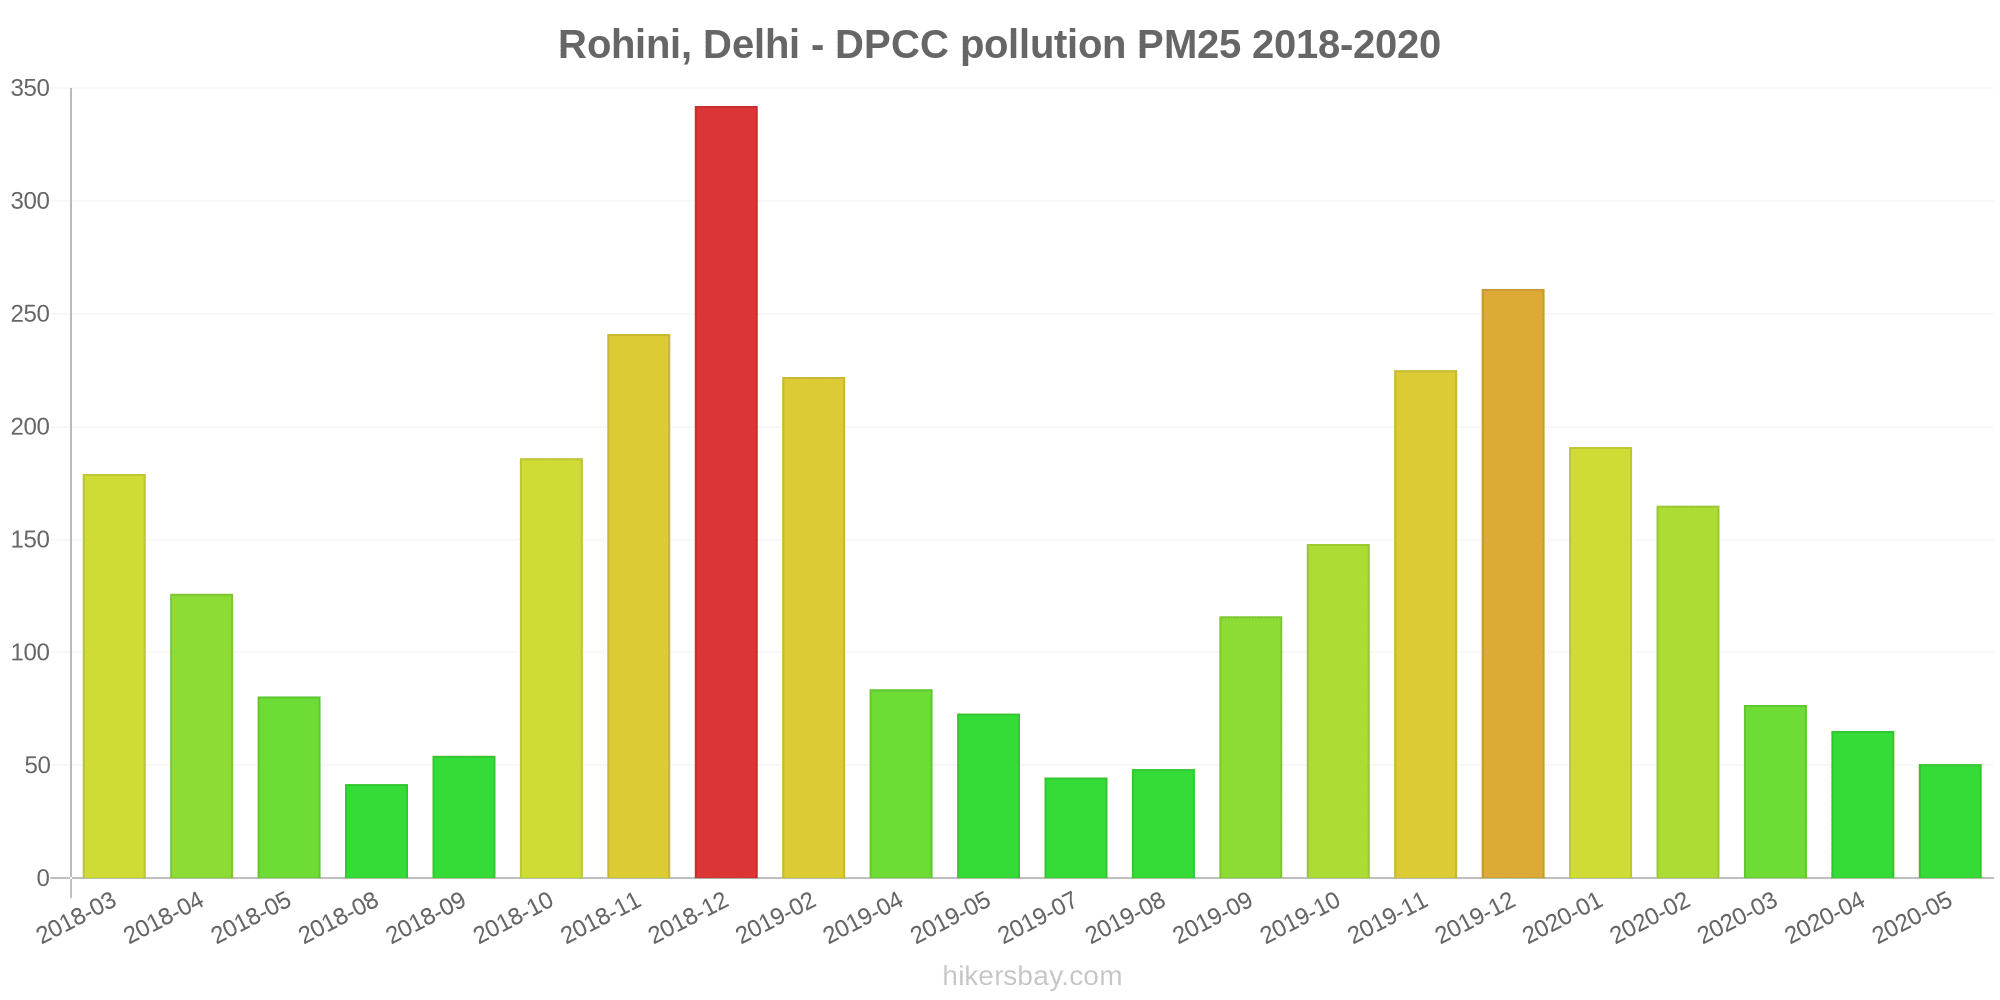
Rohini, Delhi - DPCC
2018-03 2020-05

index
2020-05
2020-04
2020-03
2020-02
2020-01
2019-12
2019-11
2019-10
2019-09
2019-08
2019-07
2019-05
2019-04
2019-02
2018-12
2018-11
2018-10
2018-09
2018-08
2018-05
2018-04
2018-03
pm25
51
65
77
165
191
261
225
148
116
48
45
73
84
222
342
241
186
54
42
81
126
179
pm10
129
143
145
261
268
363
316
270
123
90
141
242
327
363
495
376
399
125
101
275
301
263
no2
8.7
10
20
28
24
25
29
26
12
17
18
48
55
63
63
68
56
19
20
-
25
34
so2
9.3
12
11
10
5
3.9
5.6
6
4.3
3.6
3.1
24
27
25
22
23
23
13
13
-
9.3
17
co
471
457
733
1
1
1
1
1
898
1
1
1
1
3
2
2
2
934
834
-
35
57
o3
28
21
17
21
13
13
14
28
20
15
20
66
70
57
24
37
34
18
18
-
80
47
* Pollution data source:
https://openaq.org
(caaqm)
The data is licensed under CC-By 4.0
PM2,5 238 (Very bad Hazardous)
PM10 345 (Very bad Hazardous)
O3 3 (Good)
NO2 34 (Good)
SO2 1 (Good)
CO 7000 (Unhealthy for Sensitive Groups)
Data on air pollution from recent days in Alumgirpur
| index | 2022-10-30 | 2022-10-31 |
|---|---|---|
| co | 7000 Unhealthy for Sensitive Groups |
- Good |
| pm25 | - Good |
238 Very bad Hazardous |
| pm10 | - Good |
345 Very bad Hazardous |
| o3 | - Good |
3 Good |
| no2 | - Good |
34 Good |
| so2 | - Good |
1 Good |

| index | 2017-11 | 2017-10 | 2017-09 | 2017-08 | 2017-07 | 2017-06 | 2017-05 | 2017-04 | 2017-03 | 2017-02 | 2016-12 | 2016-11 | 2020-05 | 2020-04 | 2020-03 | 2020-02 | 2020-01 | 2019-12 | 2019-11 | 2019-10 | 2019-09 | 2019-08 | 2019-07 | 2019-05 | 2019-04 | 2019-02 | 2018-12 | 2018-11 | 2018-10 | 2018-09 | 2018-08 | 2018-05 | 2018-04 | 2018-03 |
|---|---|---|---|---|---|---|---|---|---|---|---|---|---|---|---|---|---|---|---|---|---|---|---|---|---|---|---|---|---|---|---|---|---|---|
| no2 | 29 (Good) | 16 (Good) | 15 (Good) | 7 (Good) | 11 (Good) | 23 (Good) | 60 (Moderate) | 88 (Moderate) | 26 (Good) | 24 (Good) | 53 (Moderate) | 169 (Unhealthy) | 8.7 (Good) | 10 (Good) | 20 (Good) | 28 (Good) | 24 (Good) | 25 (Good) | 29 (Good) | 26 (Good) | 12 (Good) | 17 (Good) | 18 (Good) | 48 (Moderate) | 55 (Moderate) | 63 (Moderate) | 63 (Moderate) | 68 (Moderate) | 56 (Moderate) | 19 (Good) | 20 (Good) | - (Good) | 25 (Good) | 34 (Good) |
| pm25 | 348 (Very bad Hazardous) | 196 (Very bad Hazardous) | 61 (Unhealthy) | 37 (Unhealthy for Sensitive Groups) | 44 (Unhealthy for Sensitive Groups) | 67 (Unhealthy) | 117 (Very bad Hazardous) | 106 (Very Unhealthy) | 115 (Very bad Hazardous) | 136 (Very bad Hazardous) | 287 (Very bad Hazardous) | 341 (Very bad Hazardous) | 51 (Unhealthy for Sensitive Groups) | 65 (Unhealthy) | 77 (Very Unhealthy) | 165 (Very bad Hazardous) | 191 (Very bad Hazardous) | 261 (Very bad Hazardous) | 225 (Very bad Hazardous) | 148 (Very bad Hazardous) | 116 (Very bad Hazardous) | 48 (Unhealthy for Sensitive Groups) | 45 (Unhealthy for Sensitive Groups) | 73 (Unhealthy) | 84 (Very Unhealthy) | 222 (Very bad Hazardous) | 342 (Very bad Hazardous) | 241 (Very bad Hazardous) | 186 (Very bad Hazardous) | 54 (Unhealthy for Sensitive Groups) | 42 (Unhealthy for Sensitive Groups) | 81 (Very Unhealthy) | 126 (Very bad Hazardous) | 179 (Very bad Hazardous) |
| pm10 | - (Good) | - (Good) | - (Good) | - (Good) | - (Good) | - (Good) | - (Good) | - (Good) | - (Good) | - (Good) | - (Good) | - (Good) | 129 (Very Unhealthy) | 143 (Very Unhealthy) | 145 (Very Unhealthy) | 261 (Very bad Hazardous) | 268 (Very bad Hazardous) | 363 (Very bad Hazardous) | 316 (Very bad Hazardous) | 270 (Very bad Hazardous) | 123 (Very Unhealthy) | 90 (Unhealthy) | 141 (Very Unhealthy) | 242 (Very bad Hazardous) | 327 (Very bad Hazardous) | 363 (Very bad Hazardous) | 495 (Very bad Hazardous) | 376 (Very bad Hazardous) | 399 (Very bad Hazardous) | 125 (Very Unhealthy) | 101 (Unhealthy) | 275 (Very bad Hazardous) | 301 (Very bad Hazardous) | 263 (Very bad Hazardous) |
| so2 | - (Good) | - (Good) | - (Good) | - (Good) | - (Good) | - (Good) | - (Good) | - (Good) | - (Good) | - (Good) | - (Good) | - (Good) | 9.3 (Good) | 12 (Good) | 11 (Good) | 10 (Good) | 5 (Good) | 3.9 (Good) | 5.6 (Good) | 6 (Good) | 4.3 (Good) | 3.6 (Good) | 3.1 (Good) | 24 (Good) | 27 (Good) | 25 (Good) | 22 (Good) | 23 (Good) | 23 (Good) | 13 (Good) | 13 (Good) | - (Good) | 9.3 (Good) | 17 (Good) |
| co | - (Good) | - (Good) | - (Good) | - (Good) | - (Good) | - (Good) | - (Good) | - (Good) | - (Good) | - (Good) | - (Good) | - (Good) | 471 (Good) | 457 (Good) | 733 (Good) | 1 (Good) | 1 (Good) | 1 (Good) | 1 (Good) | 1 (Good) | 898 (Good) | 1 (Good) | 1 (Good) | 1 (Good) | 1 (Good) | 3 (Good) | 2 (Good) | 2 (Good) | 2 (Good) | 934 (Good) | 834 (Good) | - (Good) | 35 (Good) | 57 (Good) |
| o3 | - (Good) | - (Good) | - (Good) | - (Good) | - (Good) | - (Good) | - (Good) | - (Good) | - (Good) | - (Good) | - (Good) | - (Good) | 28 (Good) | 21 (Good) | 17 (Good) | 21 (Good) | 13 (Good) | 13 (Good) | 14 (Good) | 28 (Good) | 20 (Good) | 15 (Good) | 20 (Good) | 66 (Good) | 70 (Moderate) | 57 (Good) | 24 (Good) | 37 (Good) | 34 (Good) | 18 (Good) | 18 (Good) | - (Good) | 80 (Moderate) | 47 (Good) |
PM2,5 238 (Very bad Hazardous)
particulate matter (PM2.5) dustPM10 345 (Very bad Hazardous)
particulate matter (PM10) suspended dustO3 3 (Good)
ozone (O3)NO2 34 (Good)
nitrogen dioxide (NO2)SO2 0.5 (Good)
sulfur dioxide (SO2)CO 7000 (Unhealthy for Sensitive Groups)
carbon monoxide (CO)Rohini, Delhi - DPCC
| index | 2022-10-31 | 2022-10-30 |
|---|---|---|
| co | - | 7000 |
| pm25 | 238 | - |
| pm10 | 345 | - |
| o3 | 3 | - |
| no2 | 34 | - |
| so2 | 0.5 | - |
Delhi Technological University
| index | 2017-11 | 2017-10 | 2017-09 | 2017-08 | 2017-07 | 2017-06 | 2017-05 | 2017-04 | 2017-03 | 2017-02 | 2016-12 | 2016-11 |
|---|---|---|---|---|---|---|---|---|---|---|---|---|
| pm25 | 348 | 196 | 61 | 37 | 44 | 67 | 117 | 106 | 115 | 136 | 287 | 341 |
| no2 | 29 | 16 | 15 | 7 | 11 | 23 | 60 | 88 | 26 | 24 | 53 | 169 |
Rohini, Delhi - DPCC
| index | 2020-05 | 2020-04 | 2020-03 | 2020-02 | 2020-01 | 2019-12 | 2019-11 | 2019-10 | 2019-09 | 2019-08 | 2019-07 | 2019-05 | 2019-04 | 2019-02 | 2018-12 | 2018-11 | 2018-10 | 2018-09 | 2018-08 | 2018-05 | 2018-04 | 2018-03 |
|---|---|---|---|---|---|---|---|---|---|---|---|---|---|---|---|---|---|---|---|---|---|---|
| pm25 | 51 | 65 | 77 | 165 | 191 | 261 | 225 | 148 | 116 | 48 | 45 | 73 | 84 | 222 | 342 | 241 | 186 | 54 | 42 | 81 | 126 | 179 |
| pm10 | 129 | 143 | 145 | 261 | 268 | 363 | 316 | 270 | 123 | 90 | 141 | 242 | 327 | 363 | 495 | 376 | 399 | 125 | 101 | 275 | 301 | 263 |
| no2 | 8.7 | 10 | 20 | 28 | 24 | 25 | 29 | 26 | 12 | 17 | 18 | 48 | 55 | 63 | 63 | 68 | 56 | 19 | 20 | - | 25 | 34 |
| so2 | 9.3 | 12 | 11 | 10 | 5 | 3.9 | 5.6 | 6 | 4.3 | 3.6 | 3.1 | 24 | 27 | 25 | 22 | 23 | 23 | 13 | 13 | - | 9.3 | 17 |
| co | 471 | 457 | 733 | 1 | 1 | 1 | 1 | 1 | 898 | 1 | 1 | 1 | 1 | 3 | 2 | 2 | 2 | 934 | 834 | - | 35 | 57 |
| o3 | 28 | 21 | 17 | 21 | 13 | 13 | 14 | 28 | 20 | 15 | 20 | 66 | 70 | 57 | 24 | 37 | 34 | 18 | 18 | - | 80 | 47 |